
- Moving the markets
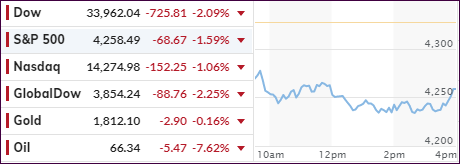
Concerns, that rebounding Covid cases, especially those identified as a Delta variant, could negatively affect an already stumbling recovery in economic activity, pulled the rug out from under the bullish theme and spanked the major indexes along with the broad market.
At one point, the Dow was down over 900 points but managed to pull itself out of a deep hole by “only” ending down some 726 points or -2.09%. The Nasdaq fared the best by giving back a more modest -1.06%, followed by the S&P 500 with -1.59%.
Gold, which was in the green for part of the day, succumbed to selling pressure by slipping -0.14% but holding on to it $1,800 level. The worst performers turned out to be energy and industrials with Small Caps losing as well but not getting hammered as bad as “value.”
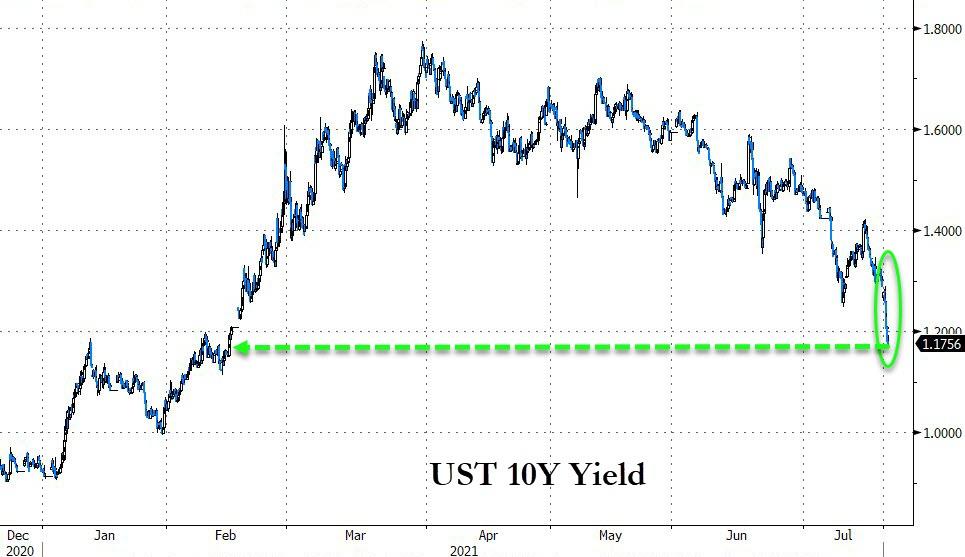
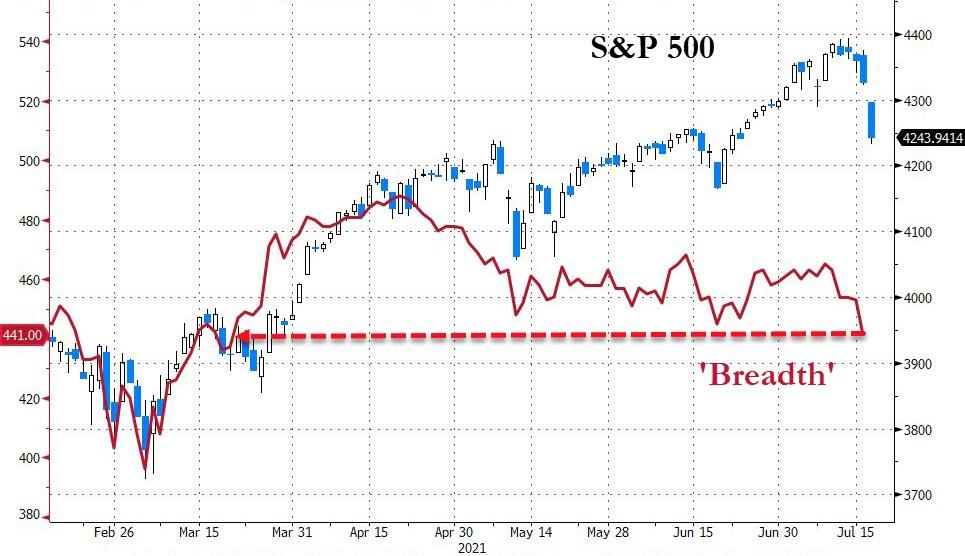
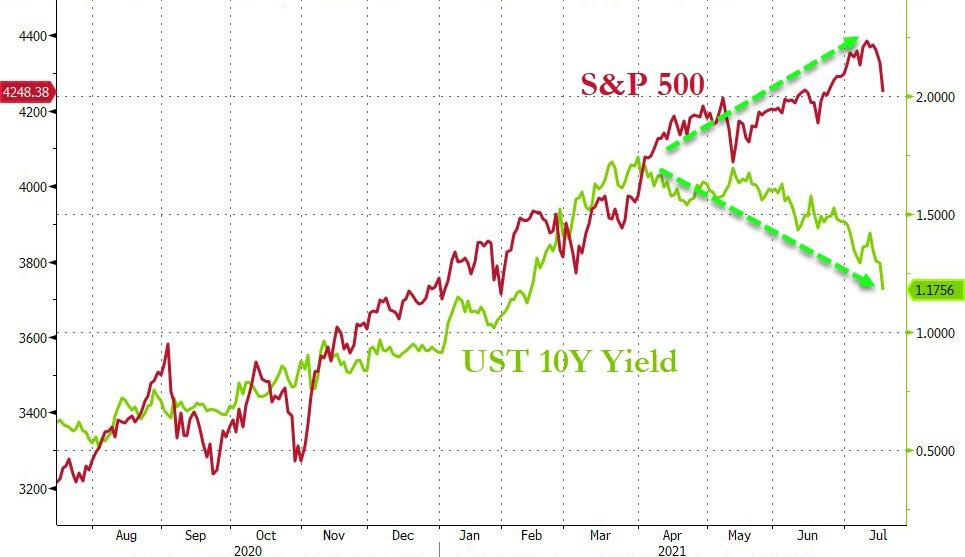
The beneficiary of this Puke-A-Thon were bond yields, which plunged to a level last seen in February with the 10-year breaking below the 1.20% level. As I posted Friday, if there is no “breadth” in the markets, yet the rally continues, it may be short lived. That was again confirmed today, as this chart demonstrates, with the fallout worsening.
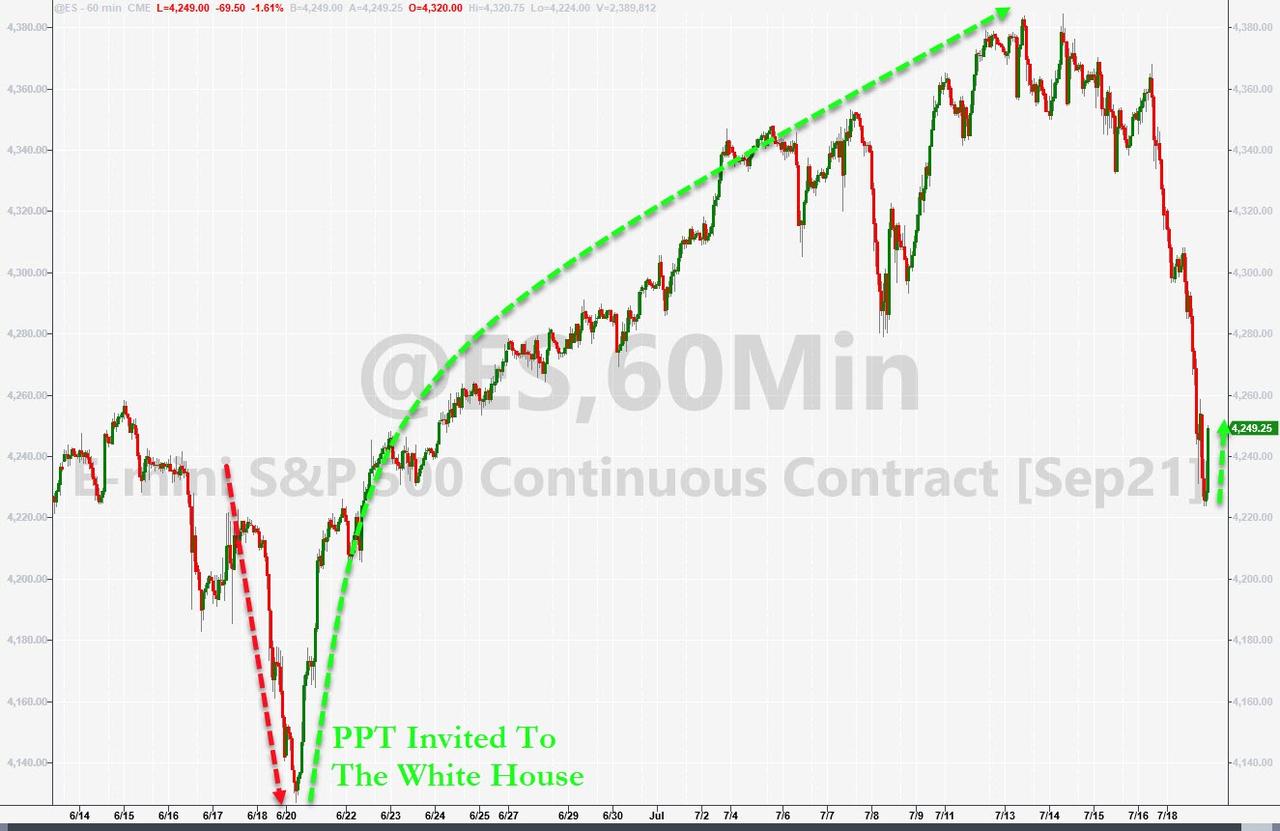
So, what caused the late small rebound? ZeroHedge speculated that the Plunge Protection Team (PPT) might have been invited to the White House again, hoping for the same result as last time. We may find out tomorrow if a “two-peat” is about to happen.
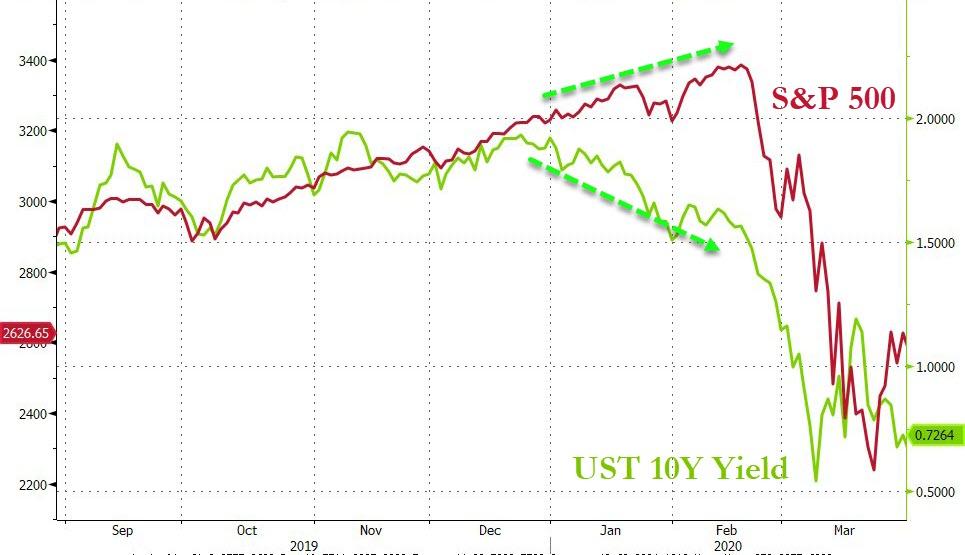
In the end, the question remains if this diversion of bond yields from the S&P 500 will result in more selling, as the jaws snap shut like last year, or will yields rise to justify the current lofty equity levels?
We will find out in due time.
2. ETFs in the Spotlight
In case you missed the announcement and description of this section, you can read it here again.
It features some of the 10 broadly diversified domestic and sector ETFs from my HighVolume list as posted every Saturday. Furthermore, they are screened for the lowest MaxDD% number meaning they have been showing better resistance to temporary sell offs than all others over the past year.
The below table simply demonstrates the magnitude with which these ETFs are fluctuating above or below their respective individual trend lines (%+/-M/A). A break below, represented by a negative number, shows weakness, while a break above, represented by a positive percentage, shows strength.
For hundreds of ETF choices, be sure to reference Thursday’s StatSheet.
For this current domestic “Buy” cycle, here’s how some our candidates have fared:
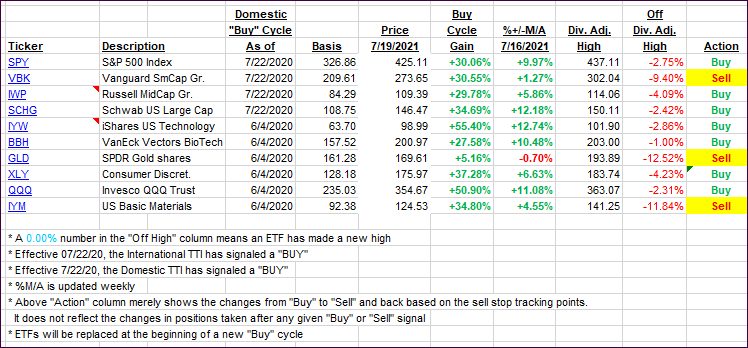
Click image to enlarge.
Again, the %+/-M/A column above shows the position of the various ETFs in relation to their respective long-term trend lines, while the trailing sell stops are being tracked in the “Off High” column. The “Action” column will signal a “Sell” once the -8% point has been taken out in the “Off High” column. For more volatile sector ETFs, the trigger point is -10%.
3. Trend Tracking Indexes (TTIs)
Our TTIs dumped but remain on the bullish side of their respective trend lines. One of our holdings triggered its trailing sell stop and will be liquidated tomorrow, unless there is a rebound in the making, in which case I will hold off for another day.
This is how we closed 07/19/2021:
Domestic TTI: +7.61% above its M/A (prior close +9.59%)—Buy signal effective 07/22/2020.
International TTI: +4.10% above its M/A (prior close +6.47%)—Buy signals effective 07/22/2020.
Disclosure: I am obliged to inform you that I, as well as my advisory clients, own some of the ETFs listed in the above table. Furthermore, they do not represent a specific investment
recommendation for you, they merely show which ETFs from the universe I track are falling within the specified guidelines.
All linked charts above are courtesy of Bloomberg via ZeroHedge.
Contact Ulli