Market Anticipation: The Fed Will Please

Ulli Market Commentary Contact

[Chart courtesy of MarketWatch.com]

  1. Moving the markets

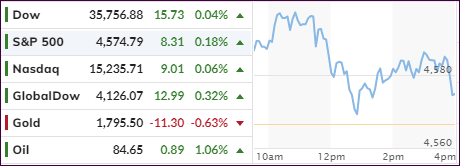
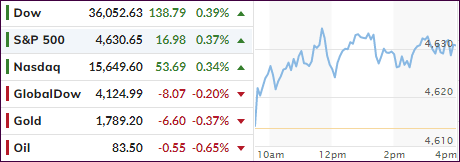
Anxiety about the upcoming Federal Reserve decision tomorrow seems to have evaporated, because equities continued their pursuit of all-time highs with the S&P 500 finishing at a record high for the third straight session, while the other two indexes set new intra-day highs.

Strong earnings provided the confidence that the year-end rally will be on deck, no matter what the Fed’s verdict on rates will be tomorrow, thereby ignoring concerns like supply chain issues, Covid risk and a slowing economy. It is doubtful that whatever announcement will be made that it will contain unexpected surprises designed to upset the bullish meme.

Statisticians at BofA pointed out that the S&P 500 has averaged gains of 1.1% in November and 2.3% in December since 1986. The final month of the year is in the green 79% of the time.

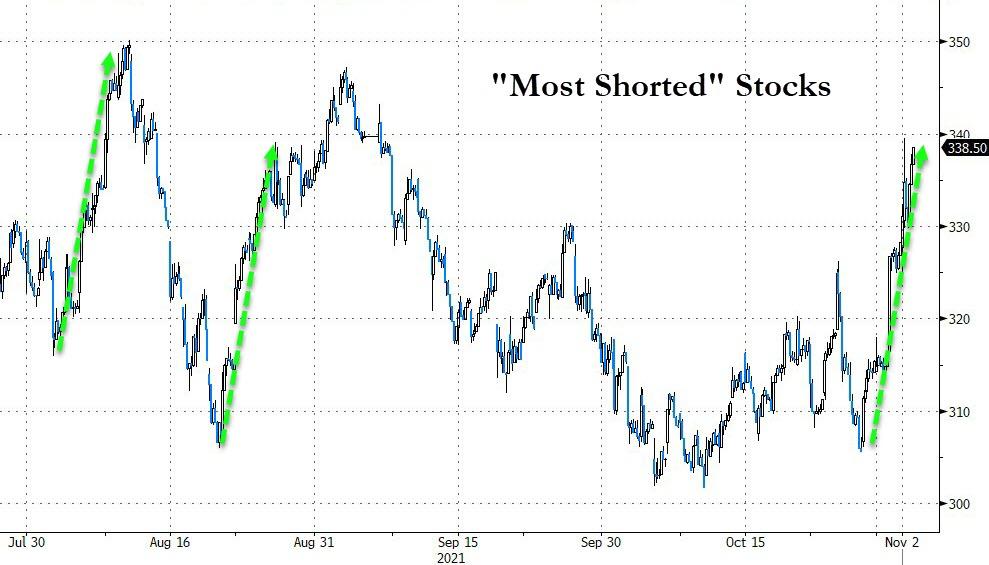
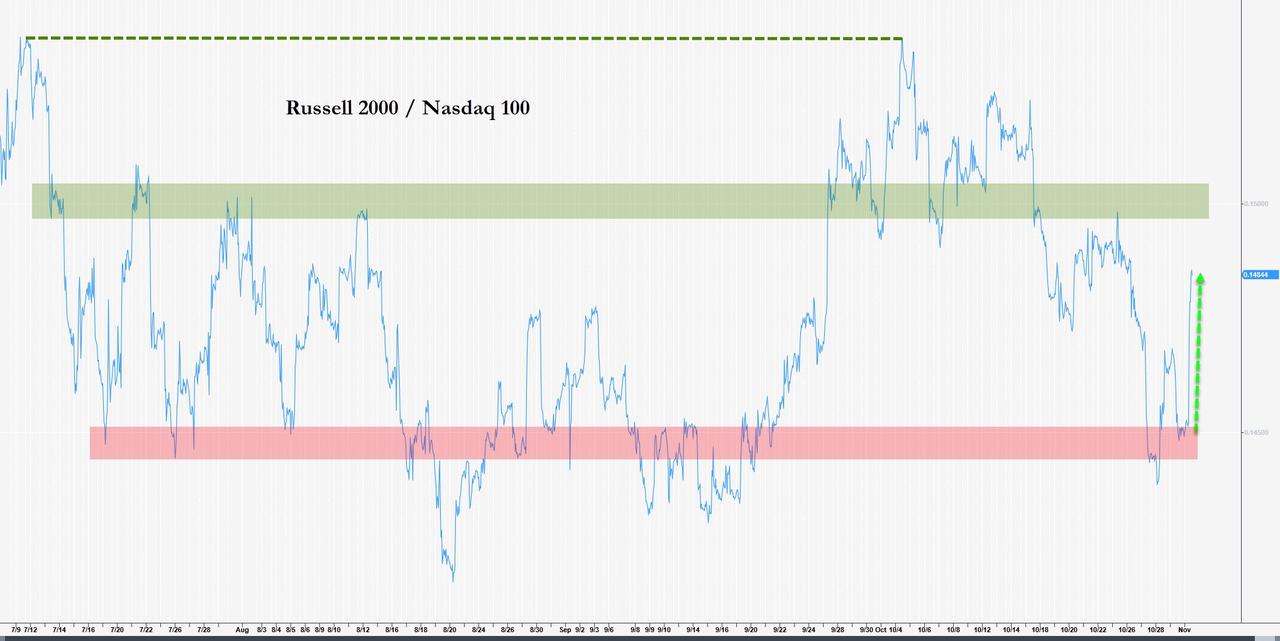
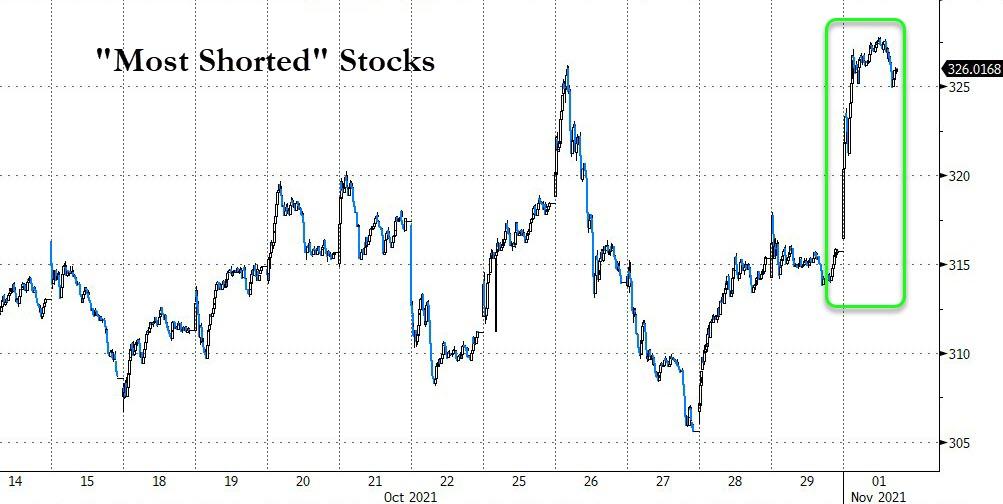
Assisting today’s ramp-a-thon was the continuation of the short squeeze which, since the beginning of August, seems to be a showing a recurring pattern in terms of amplitude.   

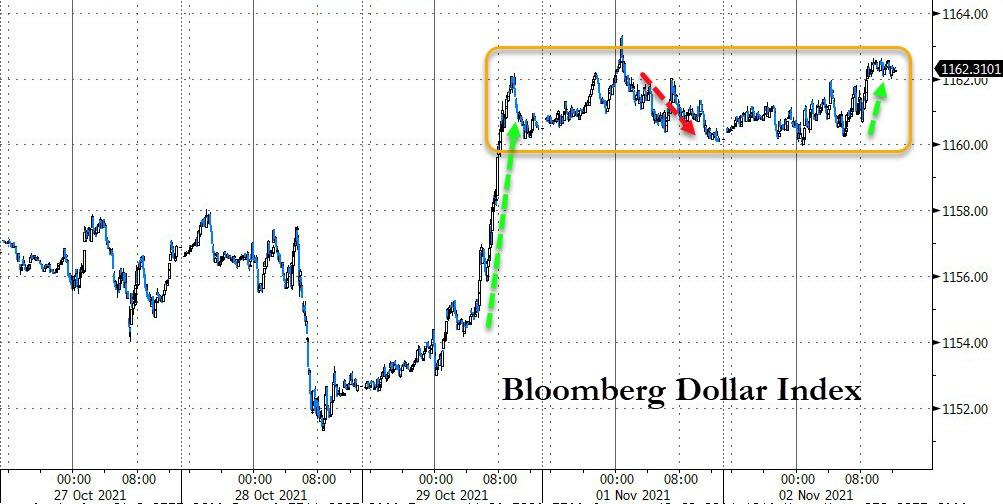
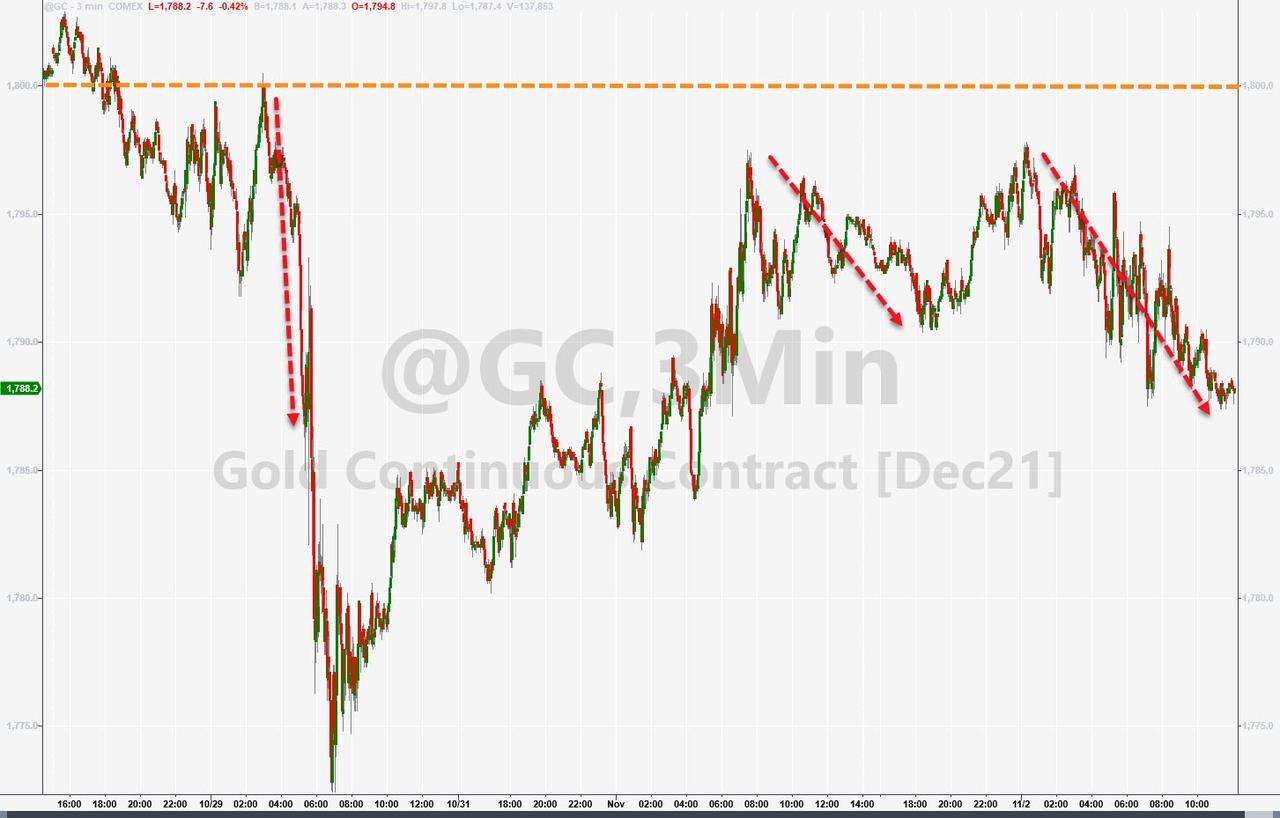
The US Dollar gained a tad but remained in a tight 3-day trading range, but gold again failed to climb over the $1,800 level and slipped 0.36% for the session.

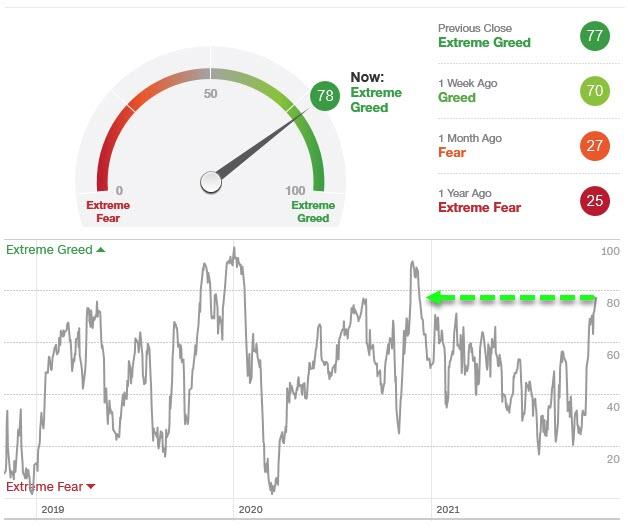
With the markets’ relentless climb, we have now entered the “extreme greed phase,” such as demonstrated in this chart. As ZeroHedge pointed out, we have now reached the “greediest” level since December 2020.

Hmm…

Read More
Bouncing Off The Unchanged Line

Ulli Market Commentary Contact

[Chart courtesy of MarketWatch.com]

  1. Moving the markets

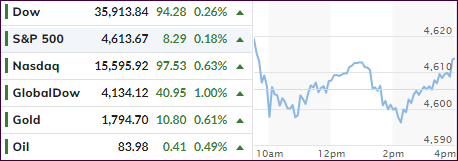
Despite an early pump, which was quickly followed by a dump, the major indexes successfully battled the unchanged line, which turned out to be a springboard for a bounce into the close. In that process, the Dow and S&P 500 set new all-time highs, thereby maintaining the bullish theme into the first day of November.

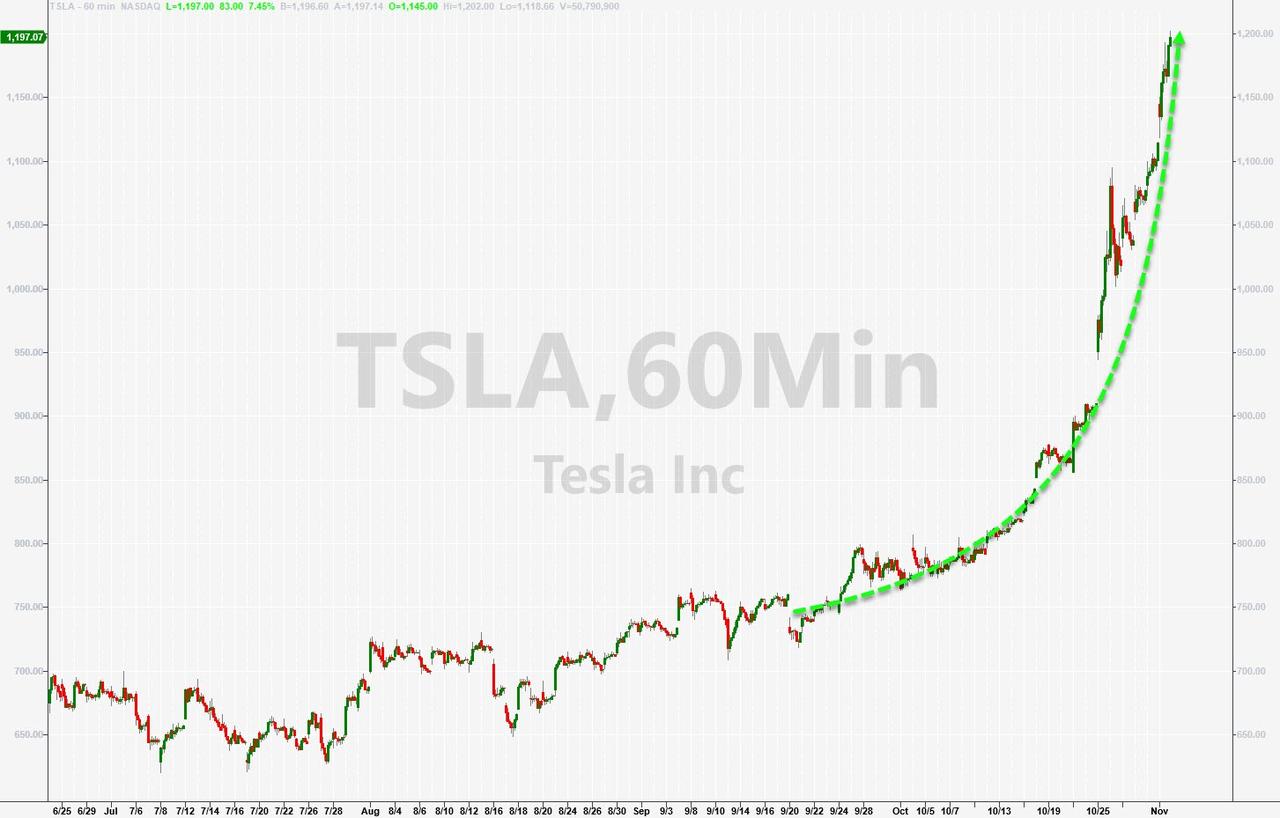
The overall gains were modest, but SmallCaps ended up having their best day since the end of August with a solid advance of 2.6%. However, the assist came from a sudden short squeeze, which helped the levitation. Tesla showed another mind-numbing gain of 8.5%, after having the crossed the $1 trillion market cap last week.

While corporate earnings season dominated the picture last month via solid profits, more announcements are on the agenda this week and might lend further assistance to the bulls. Other market affecting events will be the outcome of a 2-day Fed meeting ending this Wednesday and the all-important October jobs report, which is due on Friday. Expectations are for an increase of 450k jobs.

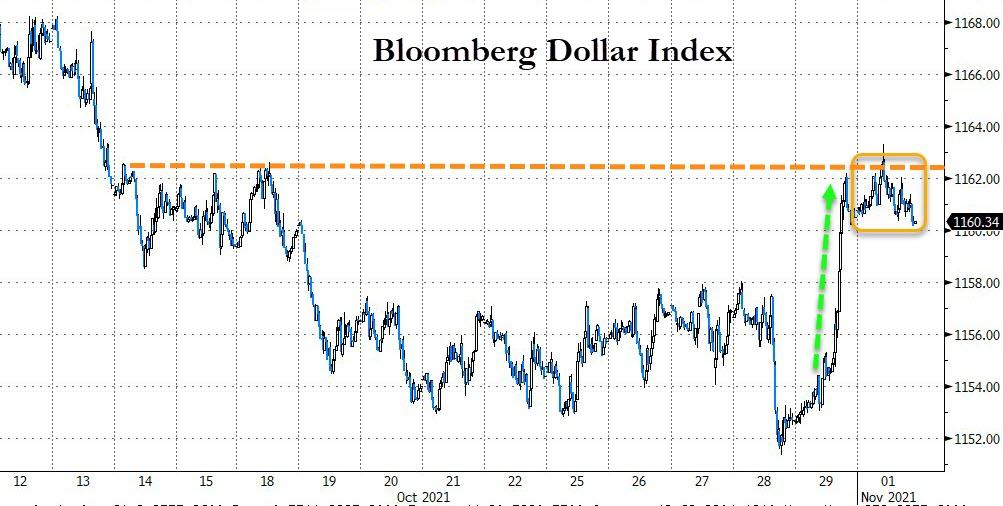
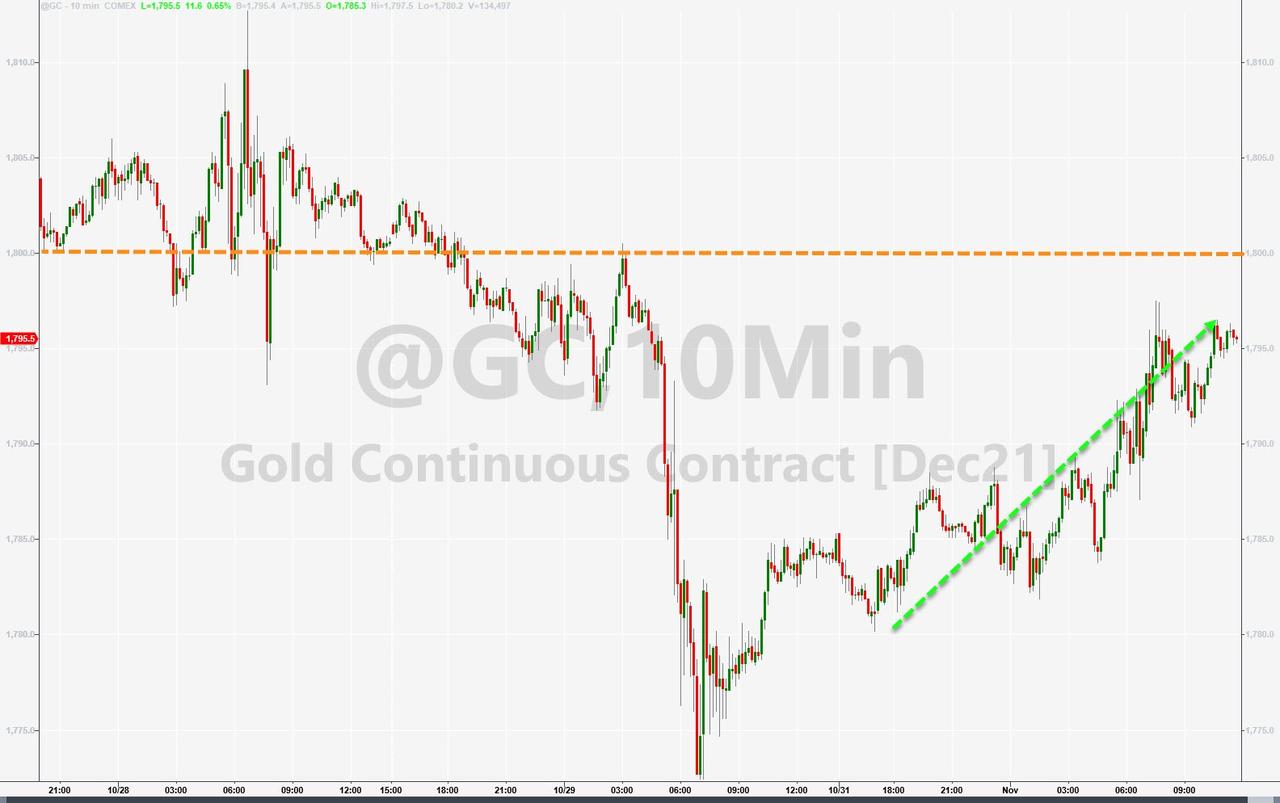
Bond yields edged higher, while the US Dollar went nowhere. Neither one of those moves proved to be a detriment for Gold, which steadily moved higher and closed the session with a 0.61% advance, but it stopped just short of the magic $1,800 level.

It was a good start to a new month after the stellar October performance.

Read More

ETF Tracker Newsletter For October 29, 2021

Ulli ETF Tracker Contact

ETF Tracker StatSheet          

You can view the latest version here.

ENDING GREEN OCTOBER WITH A BANG

[Chart courtesy of MarketWatch.com]

  1. Moving the markets

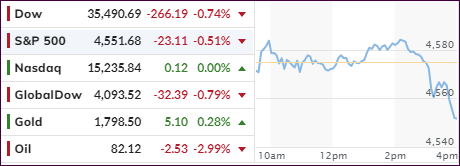
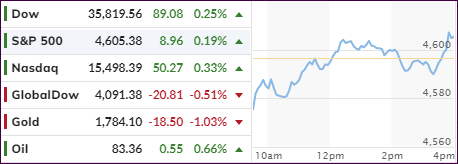
The major indexes managed to dig themselves out of an early hole to end the month of October in the positive with the S&P 500 gaining some 6.9%, while the Dow and Nasdaq posted similar advances.

Despite a few wobbles mid-month, the major up trend was never in danger of being broken, so the bulls made it through the historically most volatile time of the year, namely September and October.

More record highs were set today, as the markets notched their best month of 2021. Today’s comeback of the Nasdaq was especially surprising, as some of the disappointing results and guidance of tech heavyweights like Apple and Amazon pushed prices into the red early on. However, at the end of session, dip buyers made sure that a green close provided the positive backdrop for a solid month.

Earnings season turned out to be the driver for this bullishness, because about half of the S&P 500 reported results showed that more than 80% of them beat earnings estimates, thereby having navigated any headwinds successfully.

The US Dollar bounced back from recent losses and gained 0.83%, while bond yields slipped, as the 10-year dropped to 1.558%. The dollar’s strength hurt gold with the precious metal dipping 1% and again losing its $1,800 level.

We are now entering the seasonally strong period for equities, and we may see further gains, because early on in an inflationary environment, stocks seemed to be the beneficiary, a trend which can end in a hurry once bond yields reverse and spike. This is usually followed by a slowdown in economic activity, which affects the bottom line of companies and therefore stock prices.

On a personal note, due to time constraints, I will not be able to post tomorrow’s “ETFs on the Cutline” report.

Read More

Weekly StatSheet For The ETF Tracker Newsletter – Updated Through 10/28/2021

Ulli ETF StatSheet Contact

ETF Data updated through Thursday, October 28, 2021

Methodology/Use of this StatSheet:

1. From the universe of over 1,800 ETFs, I have selected only those with a trading volume of over $5 million per day (HV ETFs), so that liquidity and a small bid/ask spread are assured.

2. Trend Tracking Indexes (TTIs)

Buy or Sell decisions for Domestic and International ETFs (section 1 and 2), are made based on the respective TTI and its position either above or below its long-term M/A (Moving Average). A crossing of the trend line from below accompanied by some staying power above constitutes a “Buy” signal. Conversely, a clear break below the line constitutes a “Sell” signal. Additionally, I use an 8% trailing stop loss on all positions in these categories to control downside risk.

3. All other investment arenas do not have a TTI and should be traded based on the position of the individual ETF relative to its own respective trend line (%M/A). That’s why those signals are referred to as a “Selective Buy.” In other words, if an ETF crosses its own trendline to the upside, a “Buy” signal is generated. Since these areas tend to be more volatile, I recommend a wider trailing sell stop of 8%-10% depending on your risk tolerance.

If you are unfamiliar with some of the terminology, please see Glossary of Terms and new subscriber information in section 9.     

1. DOMESTIC EQUITY ETFs: BUY — since 07/22/2020

Click on chart to enlarge

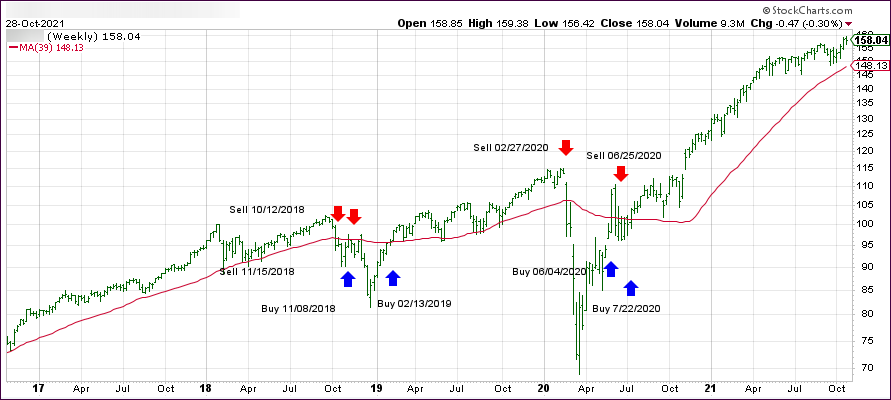
Our main directional indicator, the Domestic Trend Tracking Index (TTI-green line in the above chart) has now rallied above its long-term trend line (red) by +7.30% and remains in “BUY” mode as posted.

Read More

Losing Steam

Ulli Uncategorized Contact

[Chart courtesy of MarketWatch.com]

  1. Moving the markets

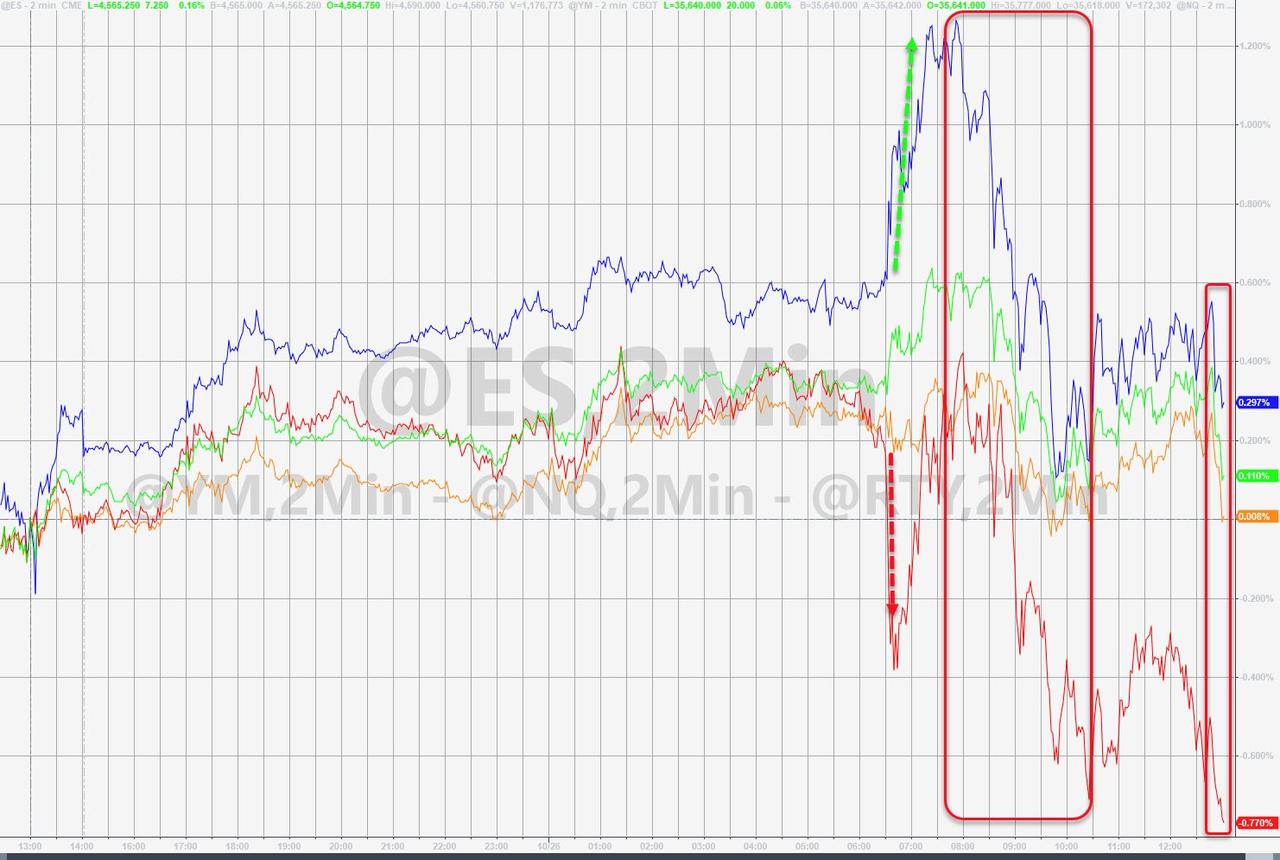
All good things must come to an end eventually, and today we saw the reality of that quotation when, after an early march higher, upward momentum faded causing the rally to lose some steam. The major indexes put up a good fight but ended the session modestly in the red with the Nasdaq faring the best by closing unchanged.

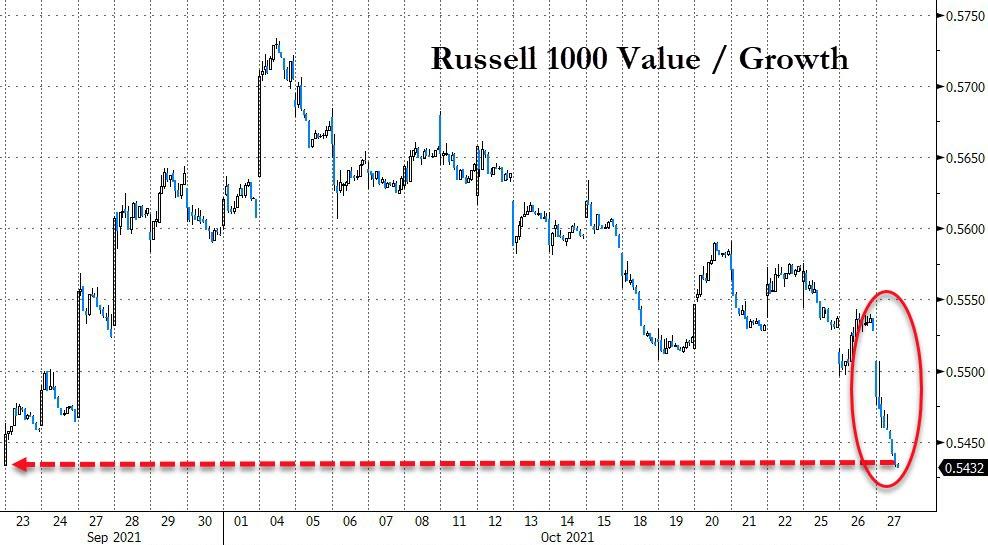
It’s worth noting that the value to growth rotation continues, as the value ETF RPV got hit hard and surrendered -2.02% vs. the growth ETF RPG, which only gave back a scant 0.15% in the last few minutes of trading.

Two of the tech heavyweights performed well after reporting stronger than expected earnings, with Microsoft and Alphabet each jumping 5%, as the former showed the fastest revenue growth since 2018. It was opposite day for Twitter, which got spanked at the tune of -9%.

Still, optimism runs rampant with LPL’s chief financial strategist calling the remainder of the year like this:

We see signs that there could be more gains to come in the final two months of the year. Seasonal tailwinds, improving market internals, and clear signs of a peak in the Delta variant all provide potential fuel for equities heading into year-end, and we maintain our overweight equities recommendation as a result.

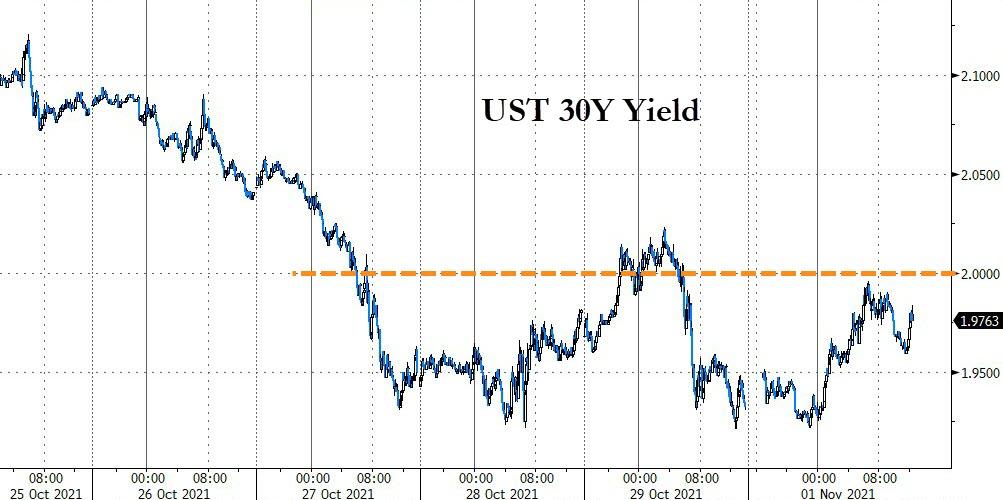
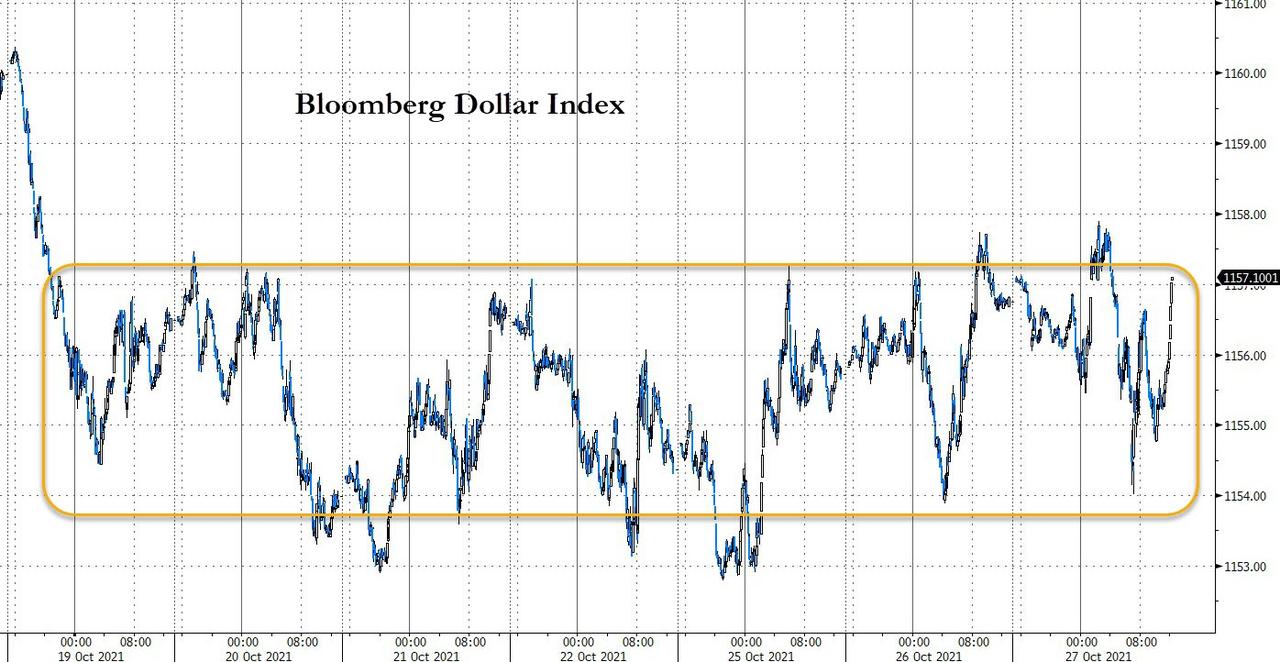
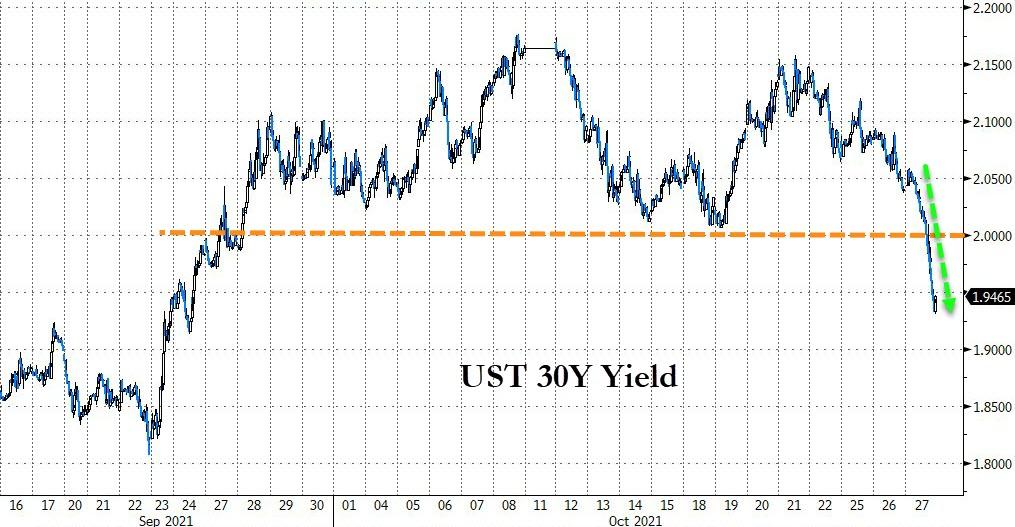
The US Dollar again pumped, dumped, and pumped but stayed within its recent trading range. Bond yields on the long end dropped sharpy with the 30-year sinking below its support level and the 10-year showing a similar move down to 1.541%.

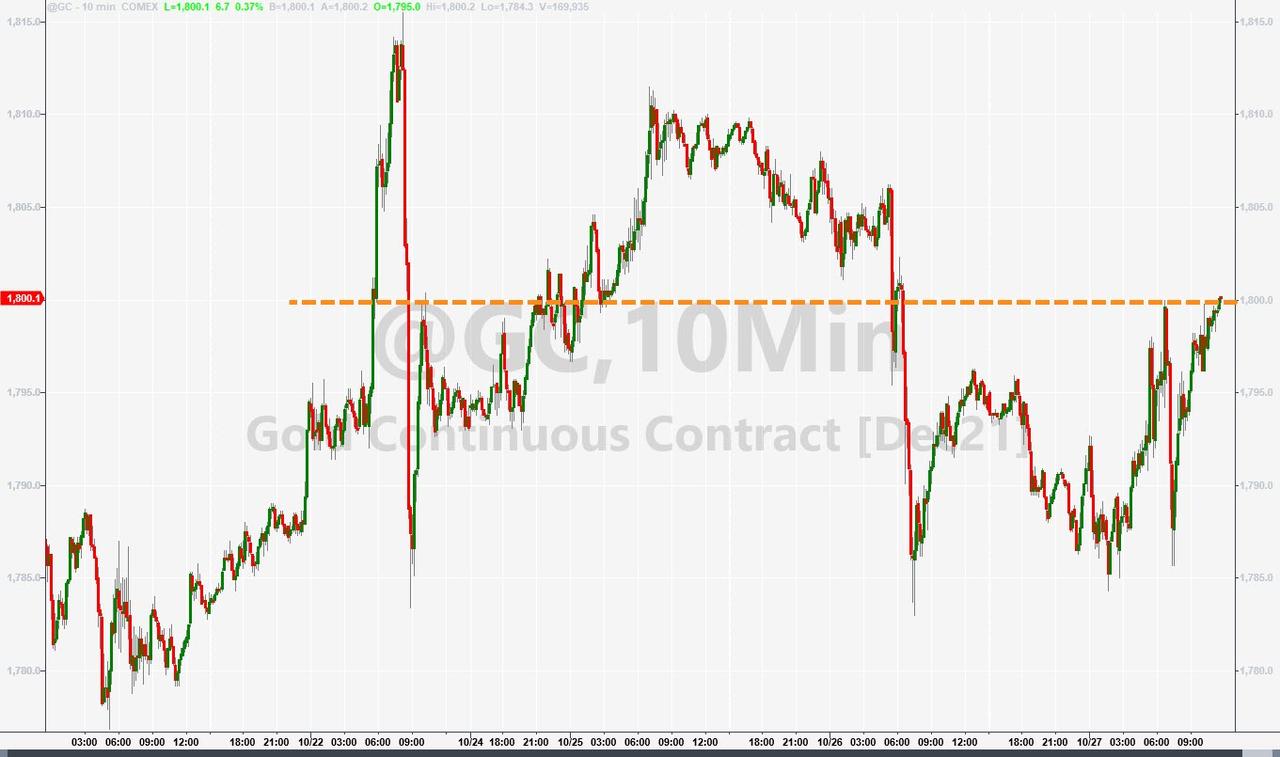
As a result, Gold found some momentum and headed higher yet was unable to reclaim its $1,800 level, which has been a glass ceiling for a while. However, given the inflationary undertones, I anticipate this ceiling to be shattered soon.  

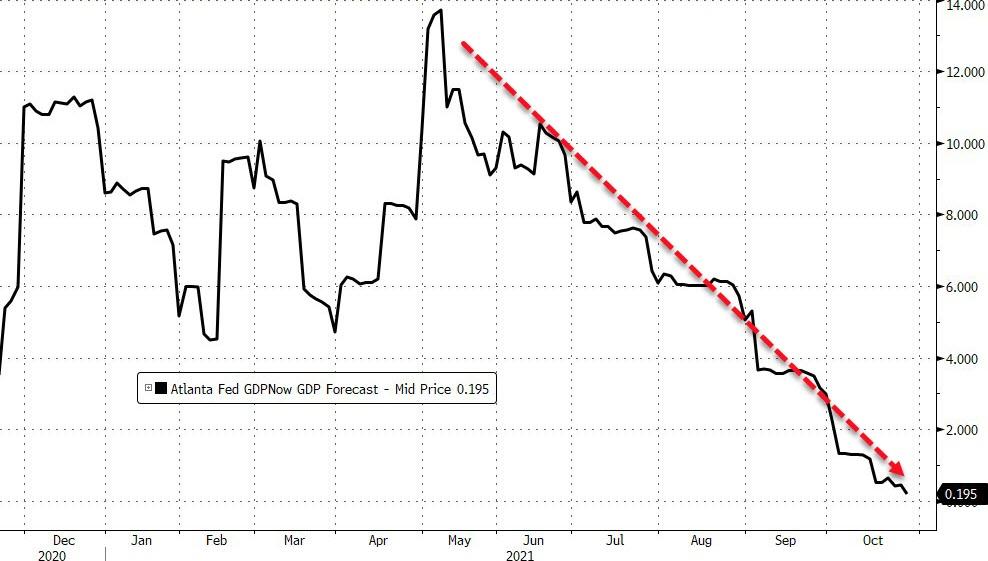
US economic growth expectation have plummeted, according to the Atlanta Fed, which indicates that we are getting close to contraction. The dreaded “S” word, as in stagflation, has been pulled onto the front burner making me ponder: “How can equities continue to go up when growth is stalling?”

Hmmm…

Read More

Riding The Bullish Range

Ulli Market Commentary Contact

[Chart courtesy of MarketWatch.com]

  1. Moving the markets

Earnings were the driver that elevated the major indexes to another green close, despite the whipsaws we saw throughout the session. A selloff during the last 30 minutes cut down the unrealized gains but kept the Dow’s record setting 3-day run intact.

Volatility was part of today’s sentiment with MarketWatch describing it this way:

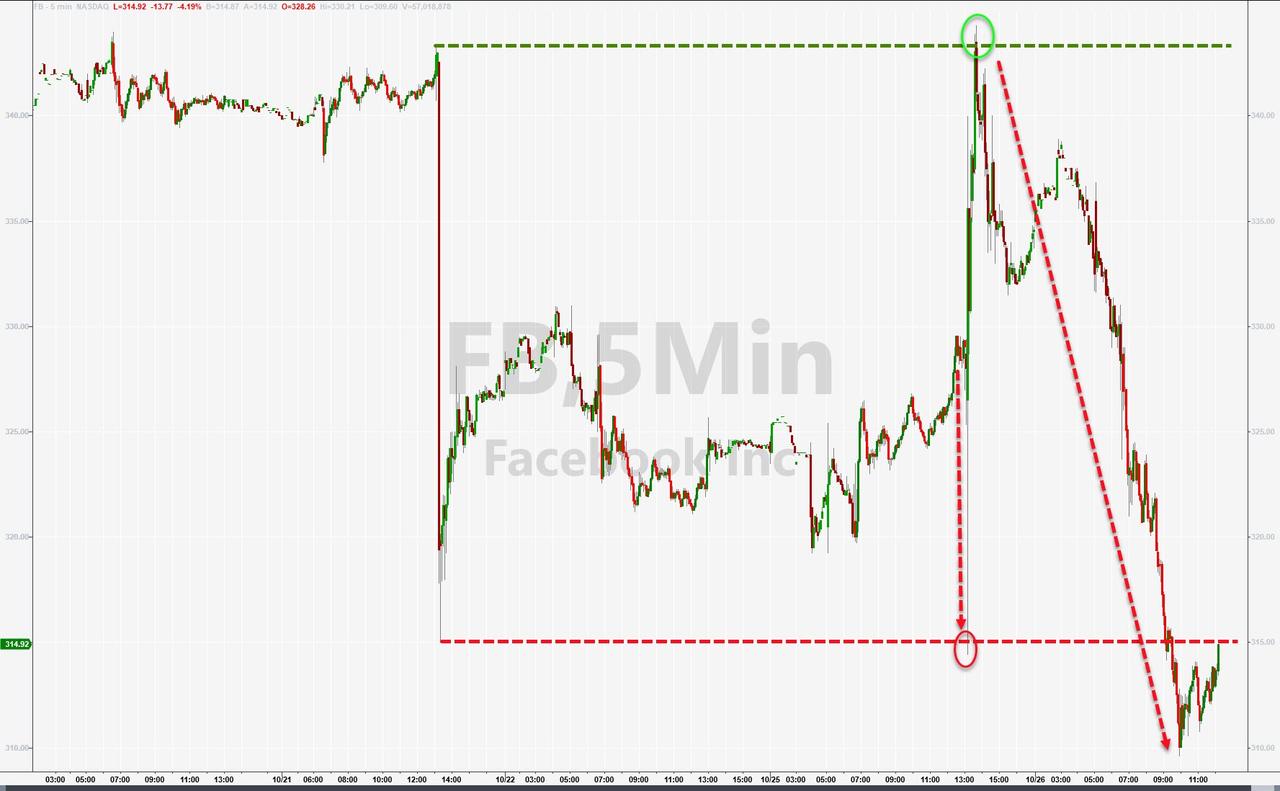
An intraday reversal in shares of Facebook weighed on major averages at midday. After trading flat to higher to start the session Facebook shares dropped more than 5%. The company topped analysts’ earnings expectations but missed estimates for revenue and monthly active users.

A host of companies, among them UPS, GE, showed improved earnings and guidance, which helped their shares jump, while Tesla, on no news, first added another 5%, then gave it up. However, after rocketing 12% in the previous session, it solidified its market cap over $1 trillion.

On deck, after the close today, are tech heavyweights Alphabet and Microsoft, which ramped higher into the close on high expectations of their reports. Analysts are pondering whether the big names will be able to step up and continue this great start to this earnings season.

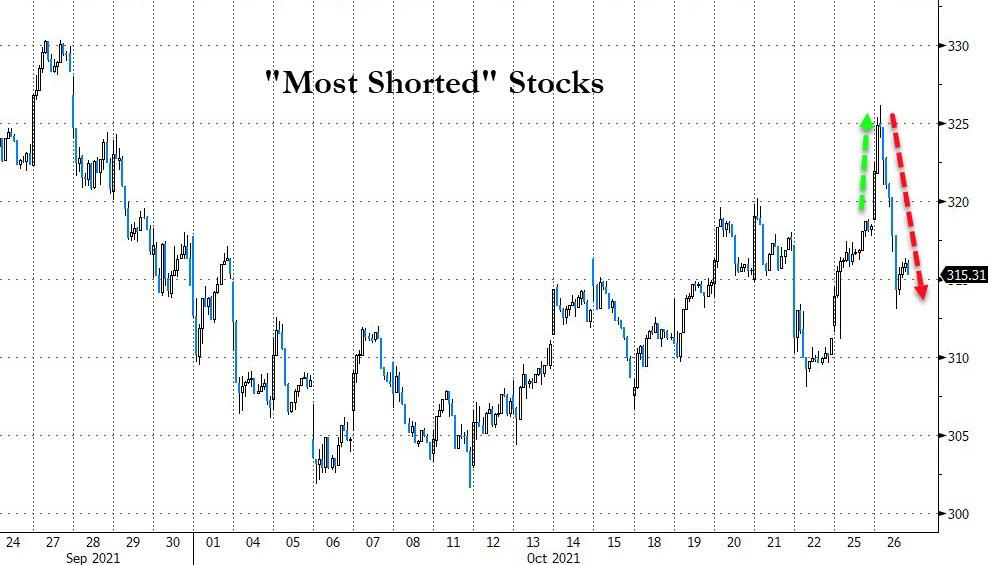
Today’s roller coaster ride was widely spread with Facebook doing a faceplant, following the China Index, which lost 4% today, and the most shorted stocks which, after an early bounce simply did what shorted stocks are supposed to do, namely go down.

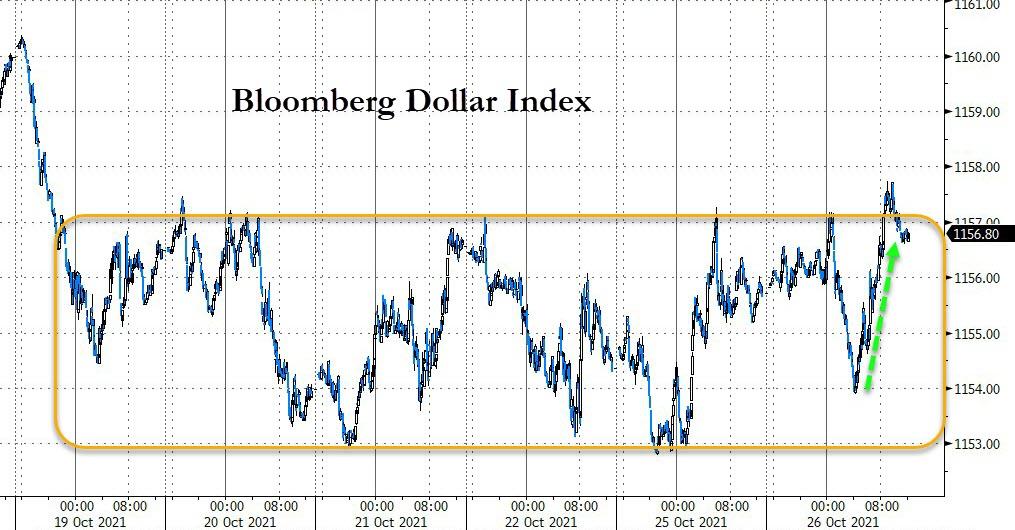
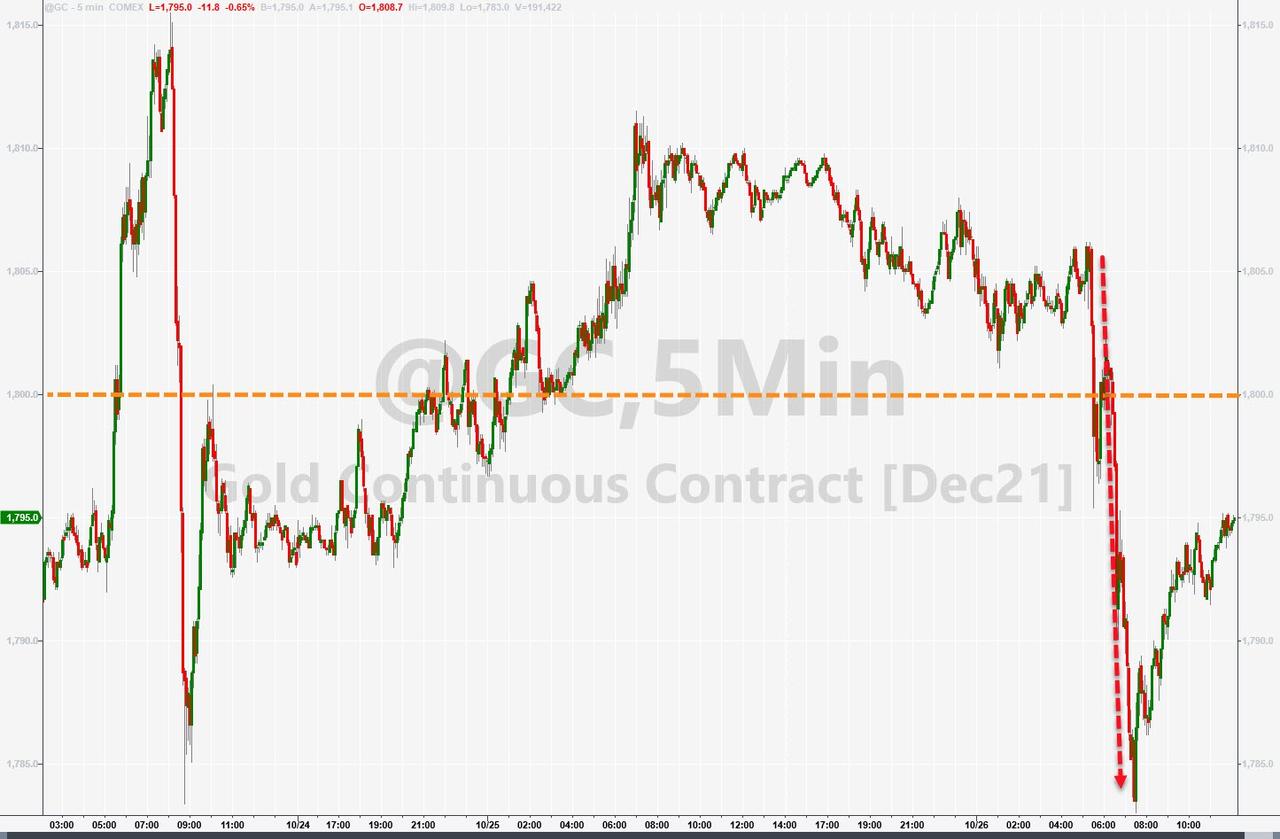
Not to be outdone, the US Dollar dumped and pumped and ended marginally higher, but stayed in its week-long trading range. Gold was not able to withstand all that volatility and gave up its hard-fought gains and its $1,800 level, despite slipping bond yields.

It looked to have been a shakeout kind of session, which is a common theme considering the major indexes are nibbling at their all-time highs.  

Read More