
- Moving the markets
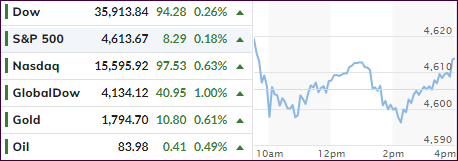
Despite an early pump, which was quickly followed by a dump, the major indexes successfully battled the unchanged line, which turned out to be a springboard for a bounce into the close. In that process, the Dow and S&P 500 set new all-time highs, thereby maintaining the bullish theme into the first day of November.
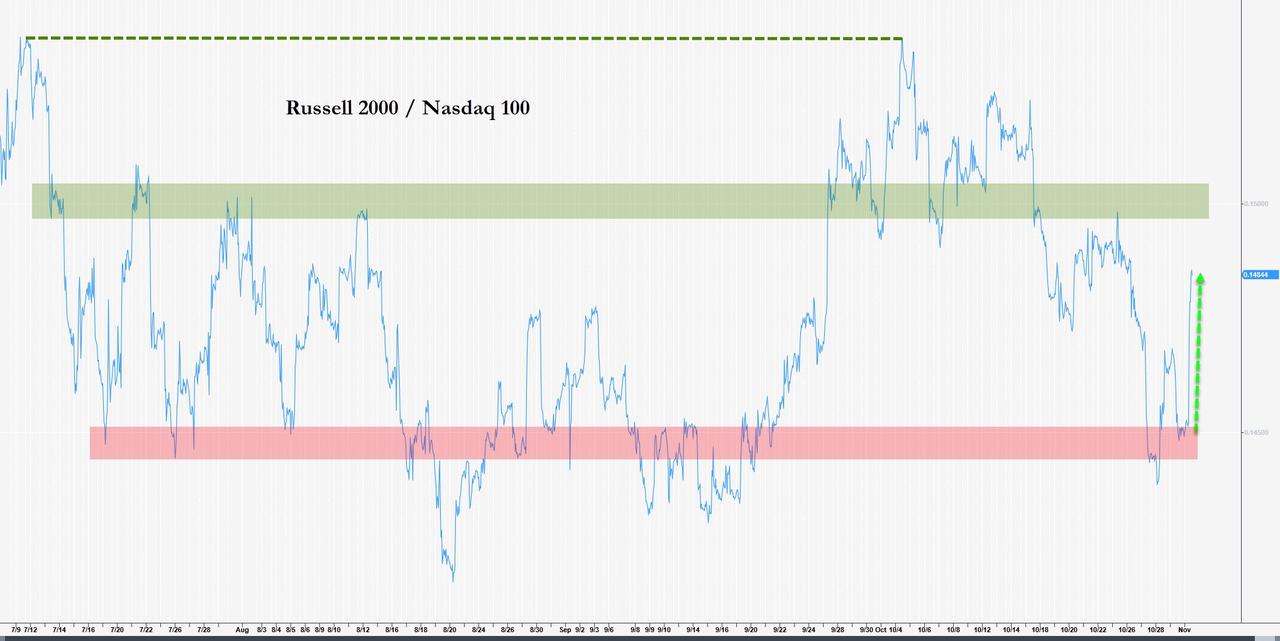
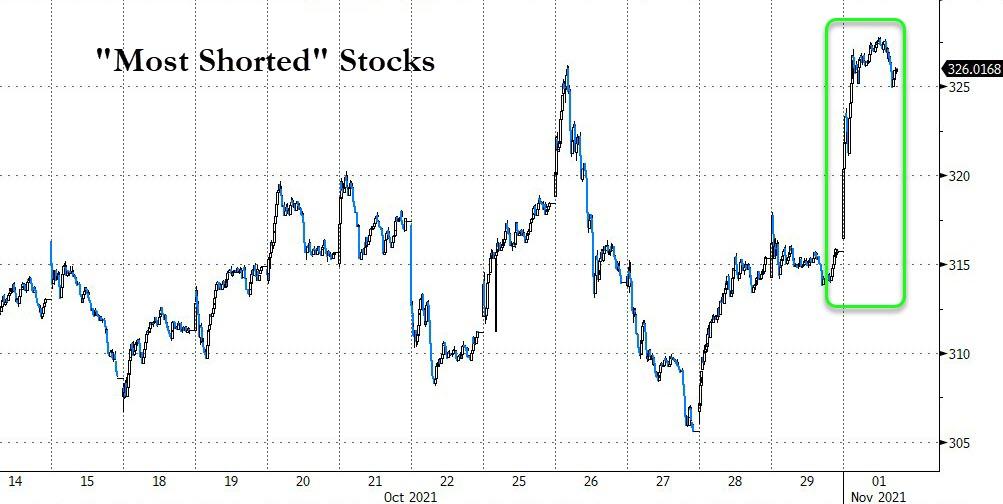
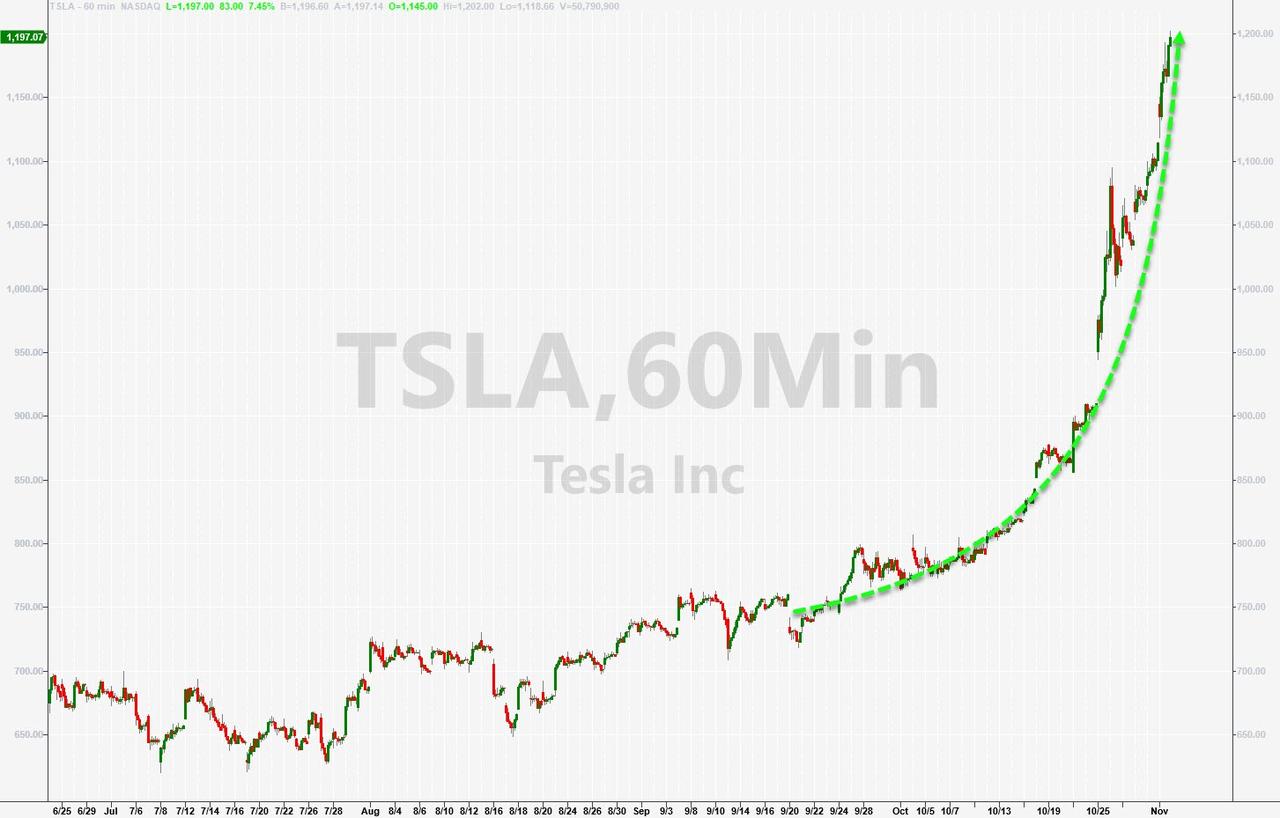
The overall gains were modest, but SmallCaps ended up having their best day since the end of August with a solid advance of 2.6%. However, the assist came from a sudden short squeeze, which helped the levitation. Tesla showed another mind-numbing gain of 8.5%, after having the crossed the $1 trillion market cap last week.
While corporate earnings season dominated the picture last month via solid profits, more announcements are on the agenda this week and might lend further assistance to the bulls. Other market affecting events will be the outcome of a 2-day Fed meeting ending this Wednesday and the all-important October jobs report, which is due on Friday. Expectations are for an increase of 450k jobs.
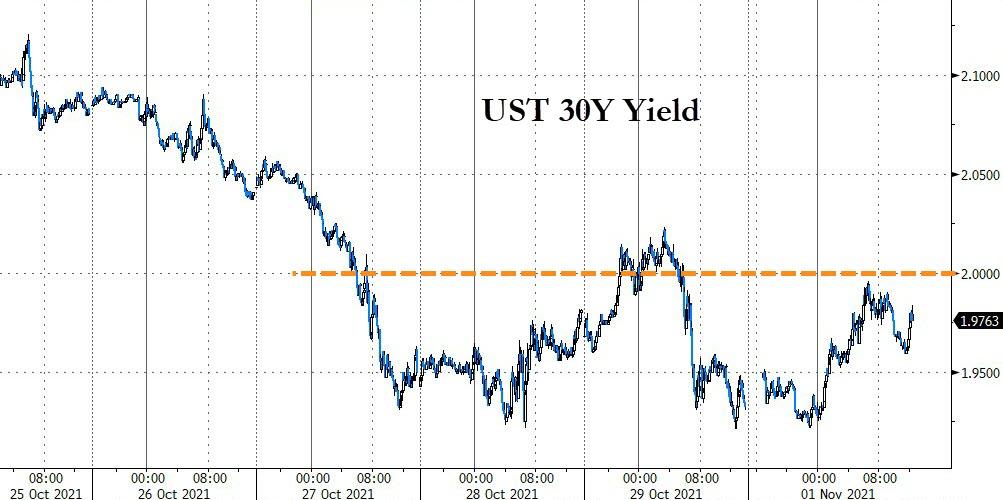
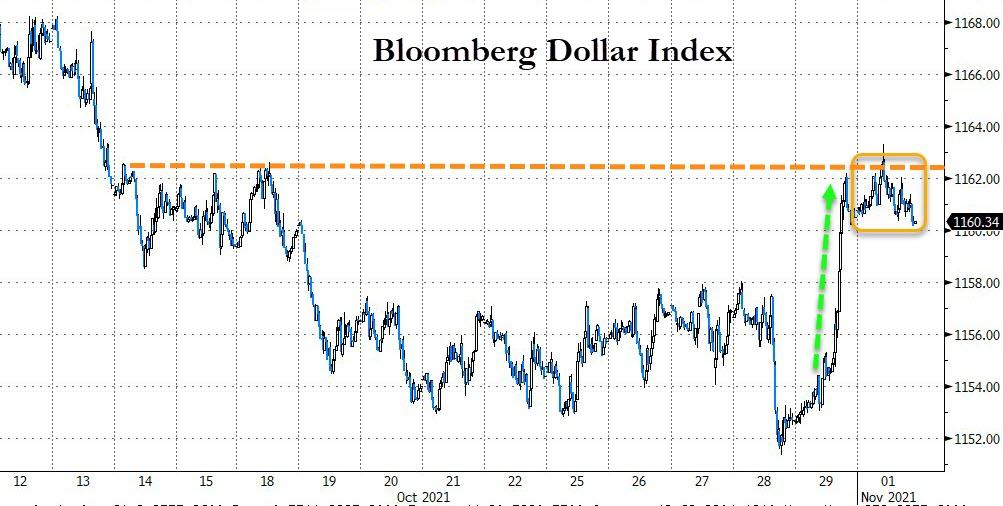
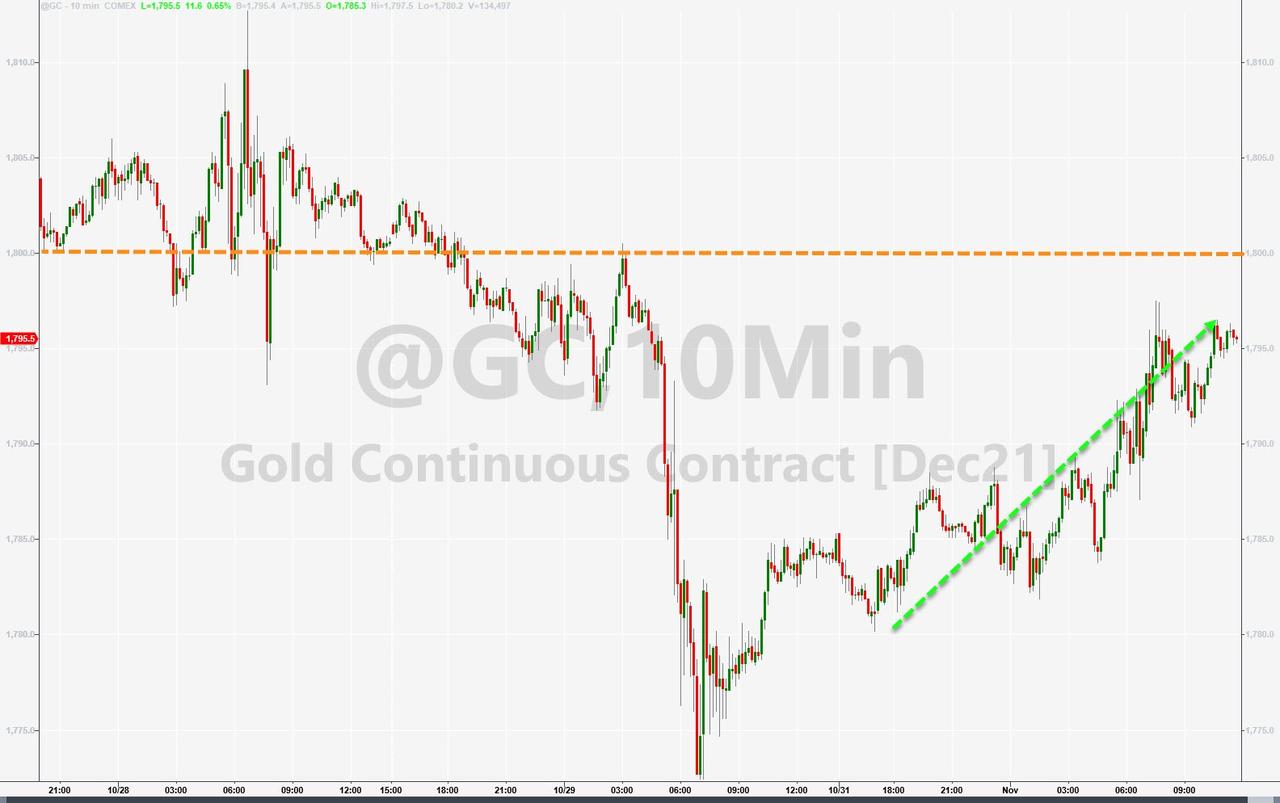
Bond yields edged higher, while the US Dollar went nowhere. Neither one of those moves proved to be a detriment for Gold, which steadily moved higher and closed the session with a 0.61% advance, but it stopped just short of the magic $1,800 level.
It was a good start to a new month after the stellar October performance.
2. ETFs in the Spotlight
In case you missed the announcement and description of this section, you can read it here again.
It features some of the 10 broadly diversified domestic and sector ETFs from my HighVolume list as posted every Saturday. Furthermore, they are screened for the lowest MaxDD% number meaning they have been showing better resistance to temporary sell offs than all others over the past year.
The below table simply demonstrates the magnitude with which these ETFs are fluctuating above or below their respective individual trend lines (%+/-M/A). A break below, represented by a negative number, shows weakness, while a break above, represented by a positive percentage, shows strength.
For hundreds of ETF choices, be sure to reference Thursday’s StatSheet.
For this current domestic “Buy” cycle, here’s how some our candidates have fared:
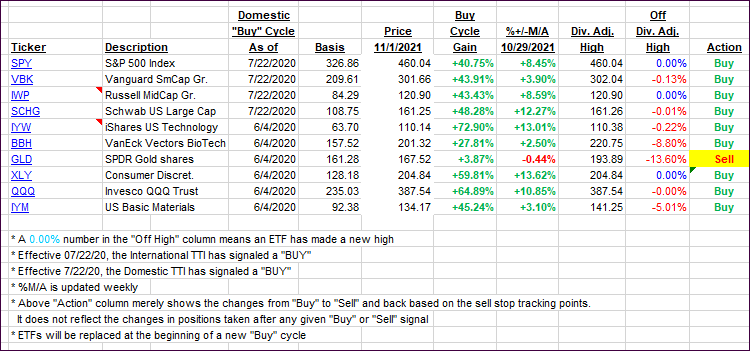
Click image to enlarge.
Again, the %+/-M/A column above shows the position of the various ETFs in relation to their respective long-term trend lines, while the trailing sell stops are being tracked in the “Off High” column. The “Action” column will signal a “Sell” once the -8% point has been taken out in the “Off High” column. For more volatile sector ETFs, the trigger point is -10%.
3. Trend Tracking Indexes (TTIs)
Our TTIs rocketed higher with the indexes starting the new month with a moderate but broad based advance.
This is how we closed 11/01/2021:
Domestic TTI: +7.36% above its M/A (prior close +6.51%)—Buy signal effective 07/22/2020.
International TTI: +4.49% above its M/A (prior close +3.42%)—Buy signal effective 07/22/2020.
Disclosure: I am obliged to inform you that I, as well as my advisory clients, own some of the ETFs listed in the above table. Furthermore, they do not represent a specific investment
recommendation for you, they merely show which ETFs from the universe I track are falling within the specified guidelines.
All linked charts above are courtesy of Bloomberg via ZeroHedge.
Contact Ulli