
- Moving the markets
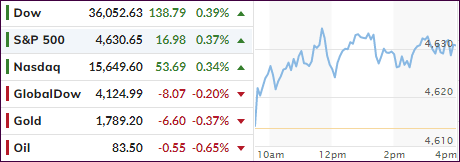
Anxiety about the upcoming Federal Reserve decision tomorrow seems to have evaporated, because equities continued their pursuit of all-time highs with the S&P 500 finishing at a record high for the third straight session, while the other two indexes set new intra-day highs.
Strong earnings provided the confidence that the year-end rally will be on deck, no matter what the Fed’s verdict on rates will be tomorrow, thereby ignoring concerns like supply chain issues, Covid risk and a slowing economy. It is doubtful that whatever announcement will be made that it will contain unexpected surprises designed to upset the bullish meme.
Statisticians at BofA pointed out that the S&P 500 has averaged gains of 1.1% in November and 2.3% in December since 1986. The final month of the year is in the green 79% of the time.
Assisting today’s ramp-a-thon was the continuation of the short squeeze which, since the beginning of August, seems to be a showing a recurring pattern in terms of amplitude.
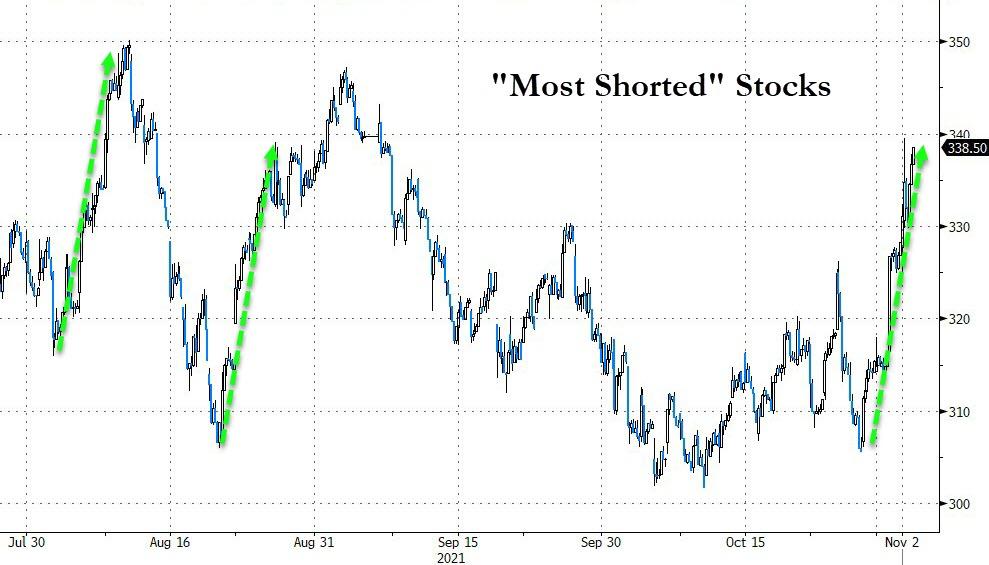
The US Dollar gained a tad but remained in a tight 3-day trading range, but gold again failed to climb over the $1,800 level and slipped 0.36% for the session.
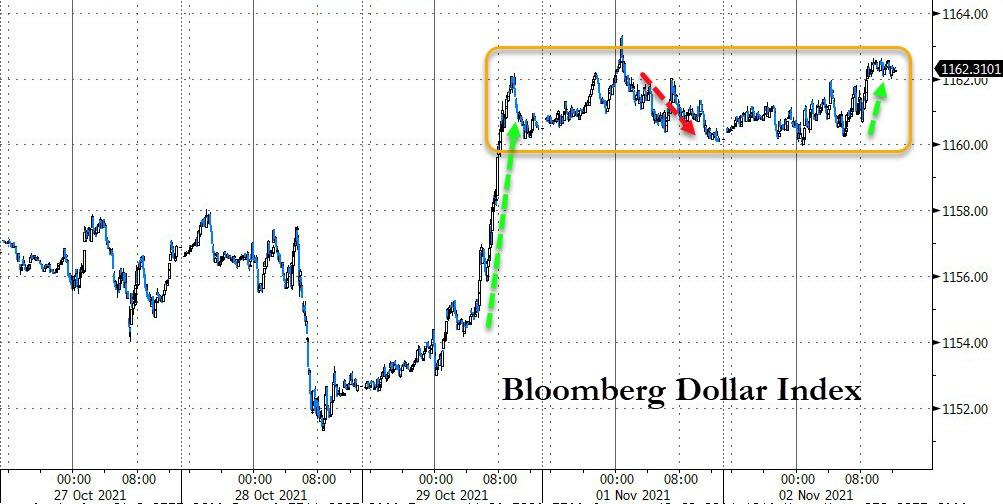
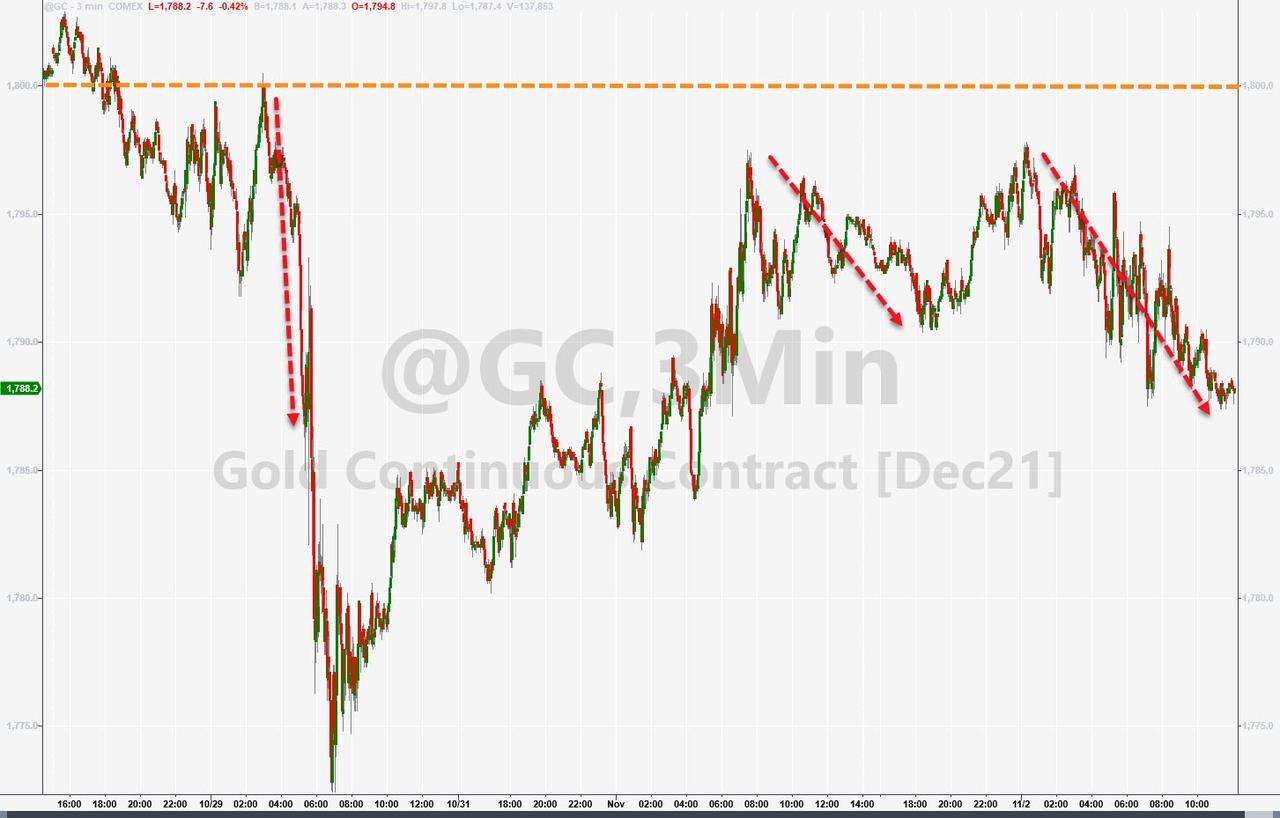
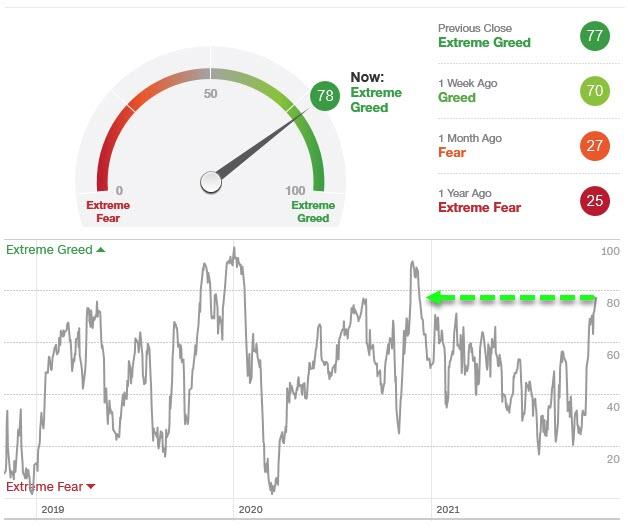
With the markets’ relentless climb, we have now entered the “extreme greed phase,” such as demonstrated in this chart. As ZeroHedge pointed out, we have now reached the “greediest” level since December 2020.
Hmm…
2. ETFs in the Spotlight
In case you missed the announcement and description of this section, you can read it here again.
It features some of the 10 broadly diversified domestic and sector ETFs from my HighVolume list as posted every Saturday. Furthermore, they are screened for the lowest MaxDD% number meaning they have been showing better resistance to temporary sell offs than all others over the past year.
The below table simply demonstrates the magnitude with which these ETFs are fluctuating above or below their respective individual trend lines (%+/-M/A). A break below, represented by a negative number, shows weakness, while a break above, represented by a positive percentage, shows strength.
For hundreds of ETF choices, be sure to reference Thursday’s StatSheet.
For this current domestic “Buy” cycle, here’s how some our candidates have fared:
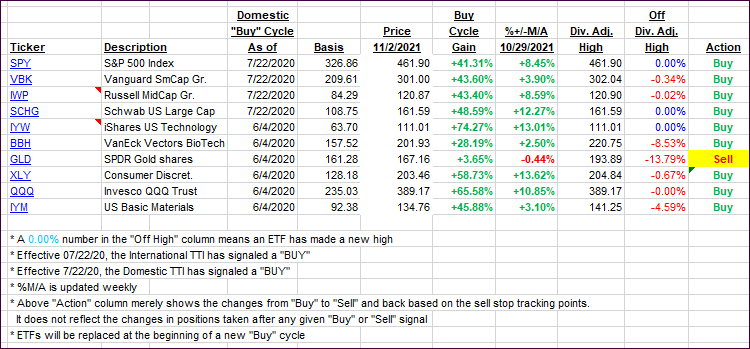
Click image to enlarge.
Again, the %+/-M/A column above shows the position of the various ETFs in relation to their respective long-term trend lines, while the trailing sell stops are being tracked in the “Off High” column. The “Action” column will signal a “Sell” once the -8% point has been taken out in the “Off High” column. For more volatile sector ETFs, the trigger point is -10%.
3. Trend Tracking Indexes (TTIs)
Our TTIs went opposite ways with the Domestic one slightly gaining but the International one retreated moderately.
This is how we closed 11/02/2021:
Domestic TTI: +7.66% above its M/A (prior close +7.36%)—Buy signal effective 07/22/2020.
International TTI: +4.26% above its M/A (prior close +4.49%)—Buy signal effective 07/22/2020.
Disclosure: I am obliged to inform you that I, as well as my advisory clients, own some of the ETFs listed in the above table. Furthermore, they do not represent a specific investment
recommendation for you, they merely show which ETFs from the universe I track are falling within the specified guidelines.
All linked charts above are courtesy of Bloomberg via ZeroHedge.
Contact Ulli