
- Moving the markets
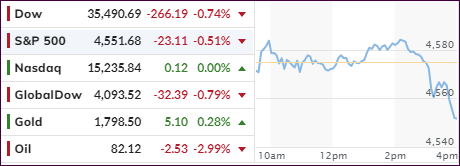
All good things must come to an end eventually, and today we saw the reality of that quotation when, after an early march higher, upward momentum faded causing the rally to lose some steam. The major indexes put up a good fight but ended the session modestly in the red with the Nasdaq faring the best by closing unchanged.
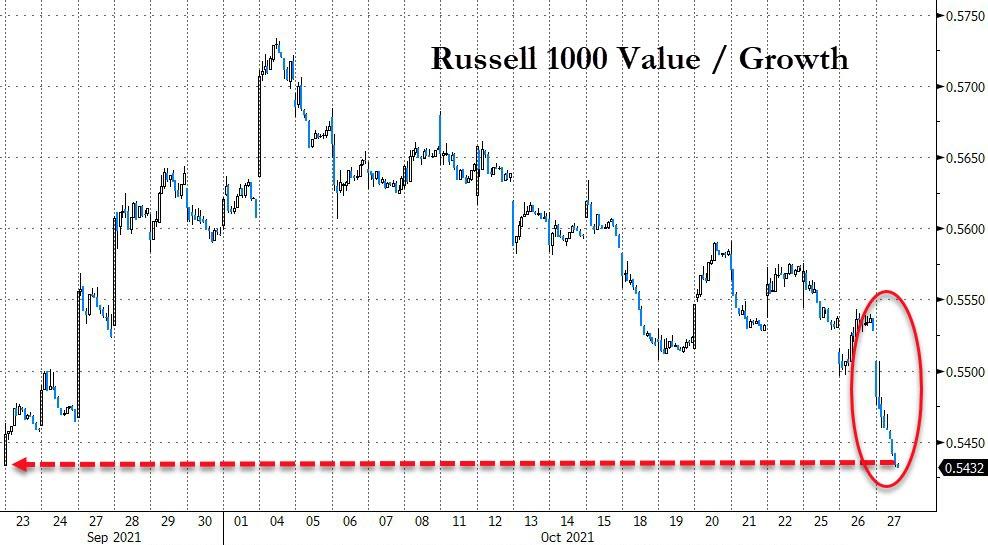
It’s worth noting that the value to growth rotation continues, as the value ETF RPV got hit hard and surrendered -2.02% vs. the growth ETF RPG, which only gave back a scant 0.15% in the last few minutes of trading.
Two of the tech heavyweights performed well after reporting stronger than expected earnings, with Microsoft and Alphabet each jumping 5%, as the former showed the fastest revenue growth since 2018. It was opposite day for Twitter, which got spanked at the tune of -9%.
Still, optimism runs rampant with LPL’s chief financial strategist calling the remainder of the year like this:
We see signs that there could be more gains to come in the final two months of the year. Seasonal tailwinds, improving market internals, and clear signs of a peak in the Delta variant all provide potential fuel for equities heading into year-end, and we maintain our overweight equities recommendation as a result.
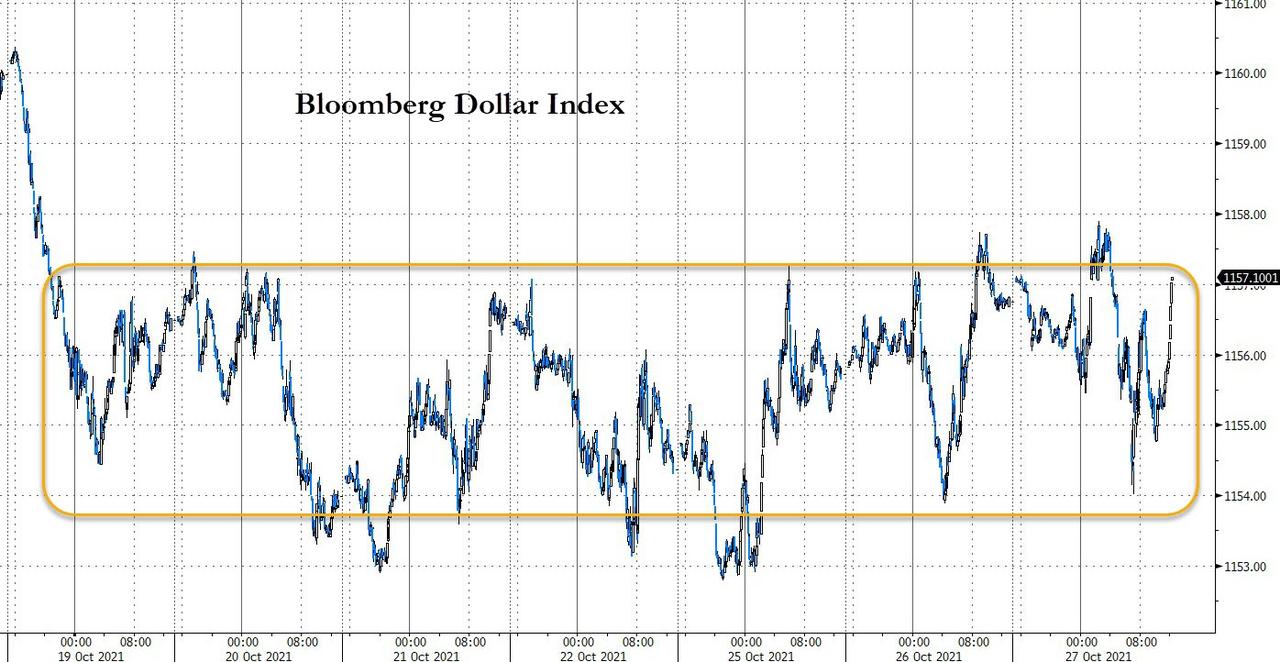
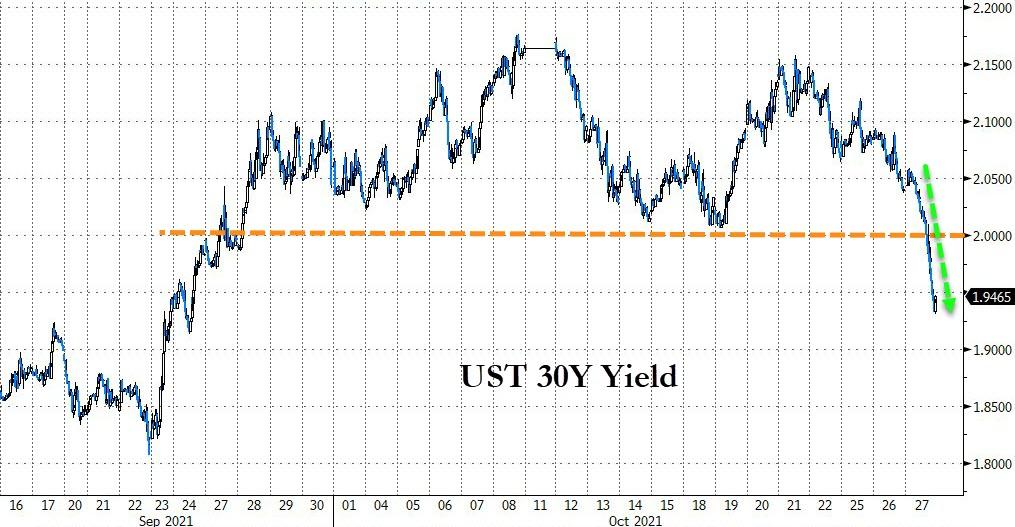
The US Dollar again pumped, dumped, and pumped but stayed within its recent trading range. Bond yields on the long end dropped sharpy with the 30-year sinking below its support level and the 10-year showing a similar move down to 1.541%.
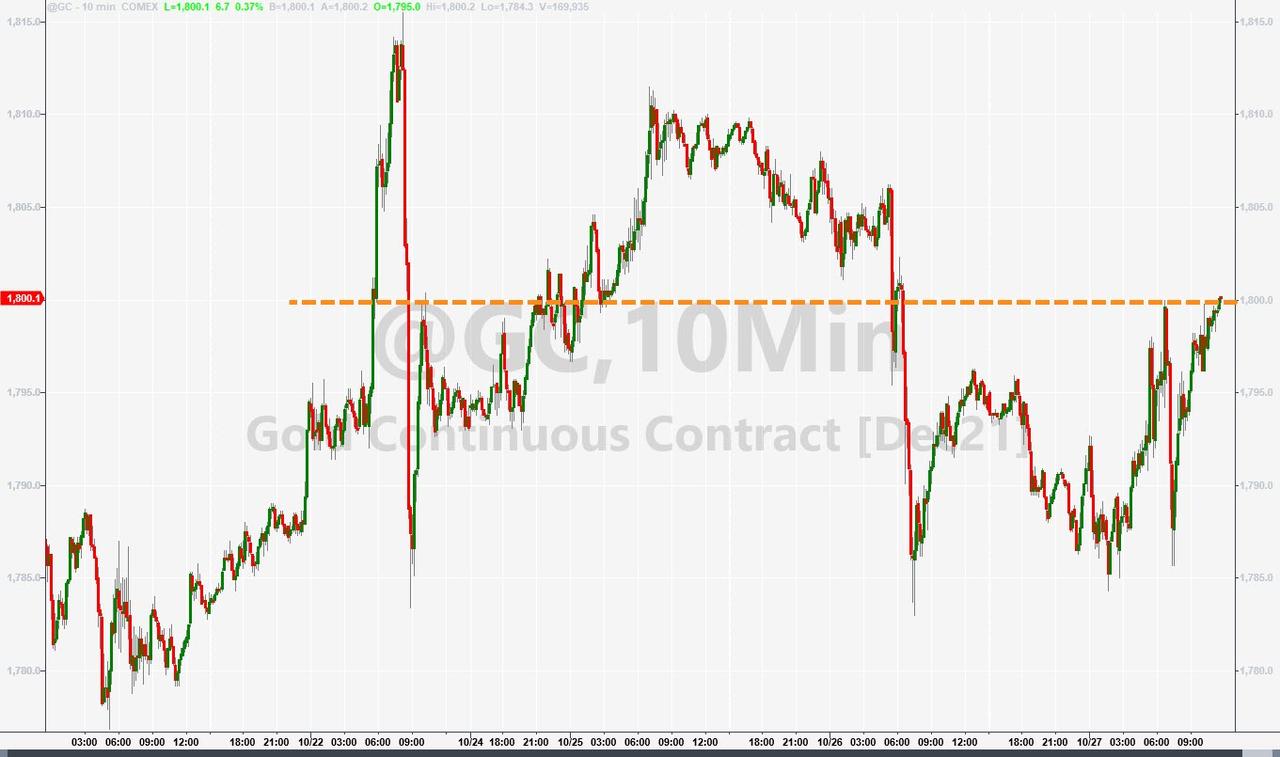
As a result, Gold found some momentum and headed higher yet was unable to reclaim its $1,800 level, which has been a glass ceiling for a while. However, given the inflationary undertones, I anticipate this ceiling to be shattered soon.
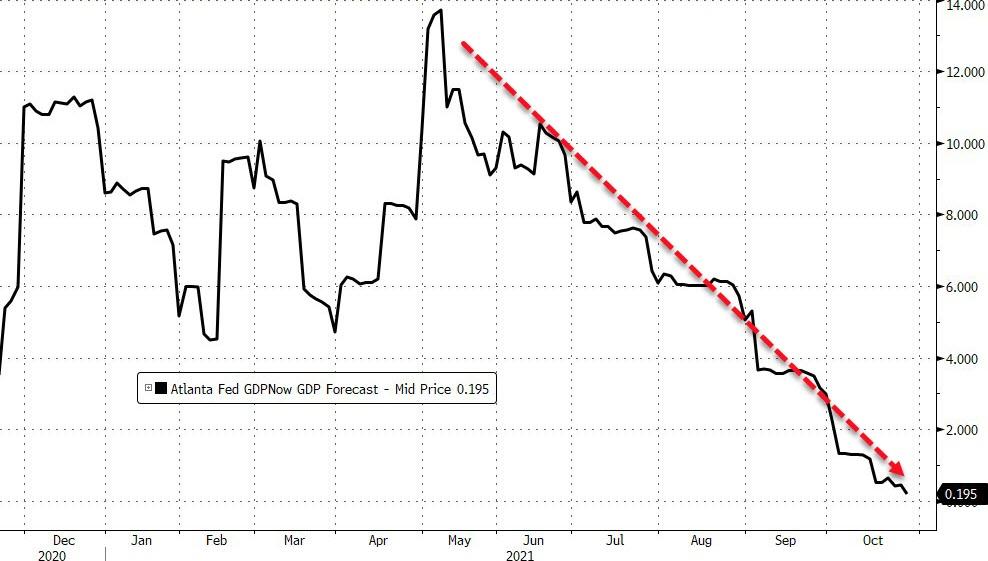
US economic growth expectation have plummeted, according to the Atlanta Fed, which indicates that we are getting close to contraction. The dreaded “S” word, as in stagflation, has been pulled onto the front burner making me ponder: “How can equities continue to go up when growth is stalling?”
Hmmm…
2. ETFs in the Spotlight
In case you missed the announcement and description of this section, you can read it here again.
It features some of the 10 broadly diversified domestic and sector ETFs from my HighVolume list as posted every Saturday. Furthermore, they are screened for the lowest MaxDD% number meaning they have been showing better resistance to temporary sell offs than all others over the past year.
The below table simply demonstrates the magnitude with which these ETFs are fluctuating above or below their respective individual trend lines (%+/-M/A). A break below, represented by a negative number, shows weakness, while a break above, represented by a positive percentage, shows strength.
For hundreds of ETF choices, be sure to reference Thursday’s StatSheet.
For this current domestic “Buy” cycle, here’s how some our candidates have fared:

Click image to enlarge.
Again, the %+/-M/A column above shows the position of the various ETFs in relation to their respective long-term trend lines, while the trailing sell stops are being tracked in the “Off High” column. The “Action” column will signal a “Sell” once the -8% point has been taken out in the “Off High” column. For more volatile sector ETFs, the trigger point is -10%.
3. Trend Tracking Indexes (TTIs)
Our TTIs pulled back as the markets dove into the close.
This is how we closed 10/27/2021:
Domestic TTI: +6.22% above its M/A (prior close +7.65%)—Buy signal effective 07/22/2020.
International TTI: +3.89% above its M/A (prior close +4.72%)—Buy signal effective 07/22/2020.
Disclosure: I am obliged to inform you that I, as well as my advisory clients, own some of the ETFs listed in the above table. Furthermore, they do not represent a specific investment
recommendation for you, they merely show which ETFs from the universe I track are falling within the specified guidelines.
All linked charts above are courtesy of Bloomberg via ZeroHedge.
Contact Ulli