
- Moving the markets
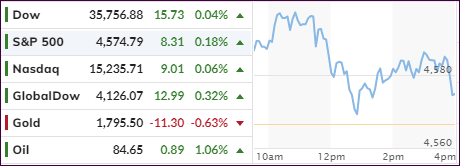
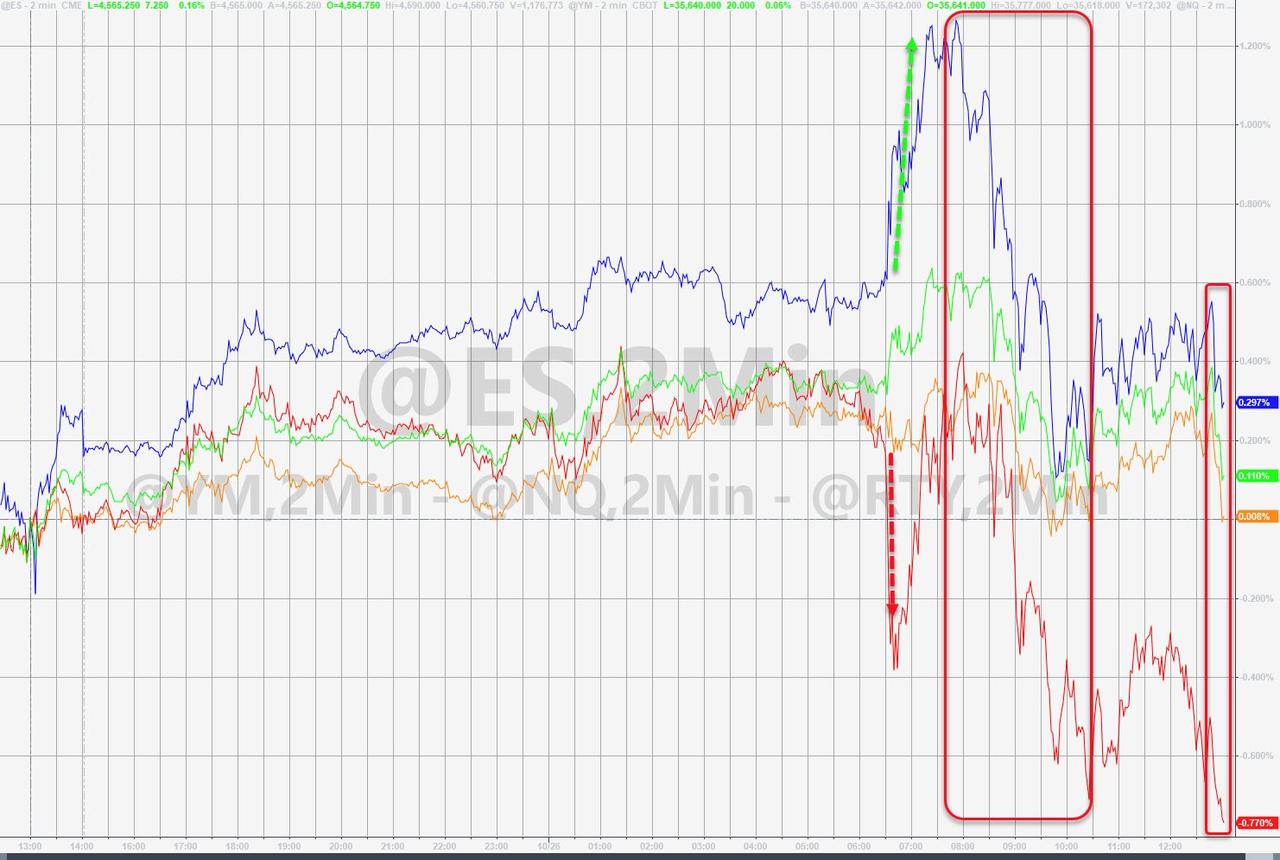
Earnings were the driver that elevated the major indexes to another green close, despite the whipsaws we saw throughout the session. A selloff during the last 30 minutes cut down the unrealized gains but kept the Dow’s record setting 3-day run intact.
Volatility was part of today’s sentiment with MarketWatch describing it this way:
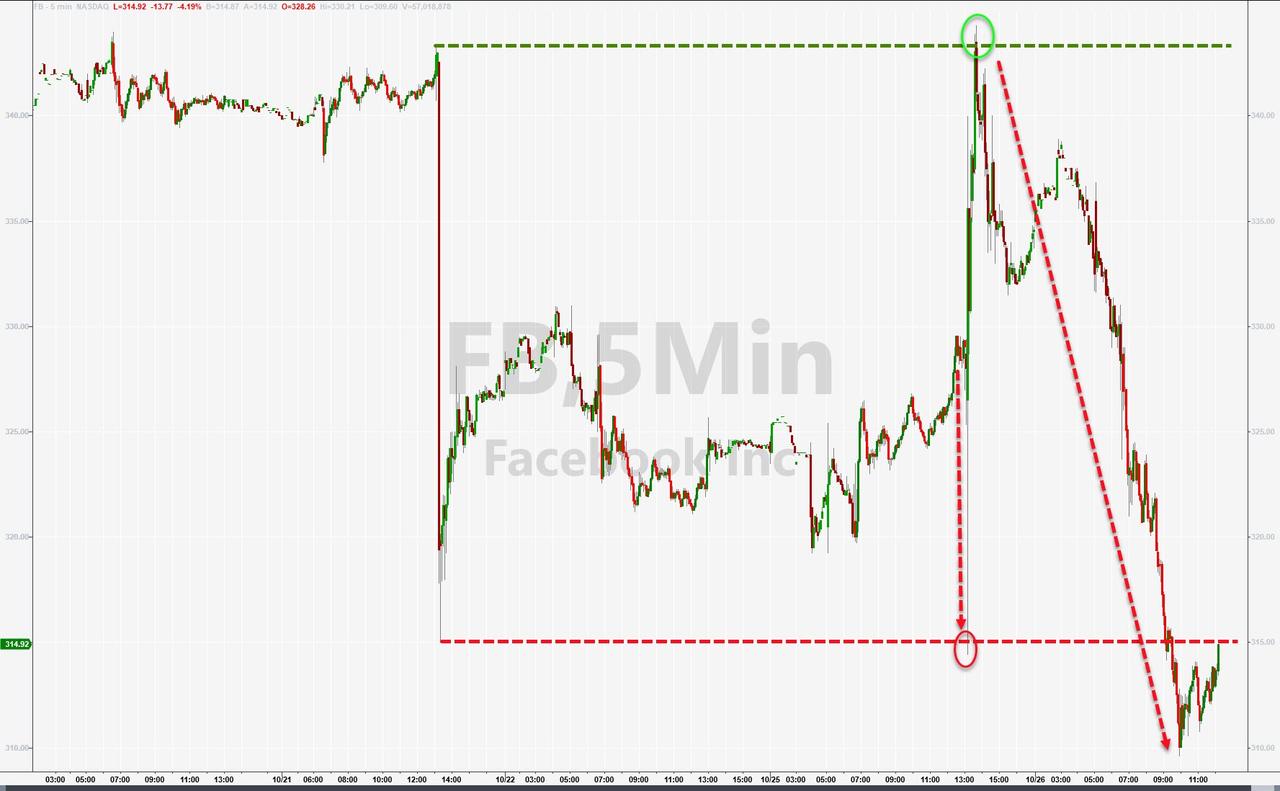
An intraday reversal in shares of Facebook weighed on major averages at midday. After trading flat to higher to start the session Facebook shares dropped more than 5%. The company topped analysts’ earnings expectations but missed estimates for revenue and monthly active users.
A host of companies, among them UPS, GE, showed improved earnings and guidance, which helped their shares jump, while Tesla, on no news, first added another 5%, then gave it up. However, after rocketing 12% in the previous session, it solidified its market cap over $1 trillion.
On deck, after the close today, are tech heavyweights Alphabet and Microsoft, which ramped higher into the close on high expectations of their reports. Analysts are pondering whether the big names will be able to step up and continue this great start to this earnings season.
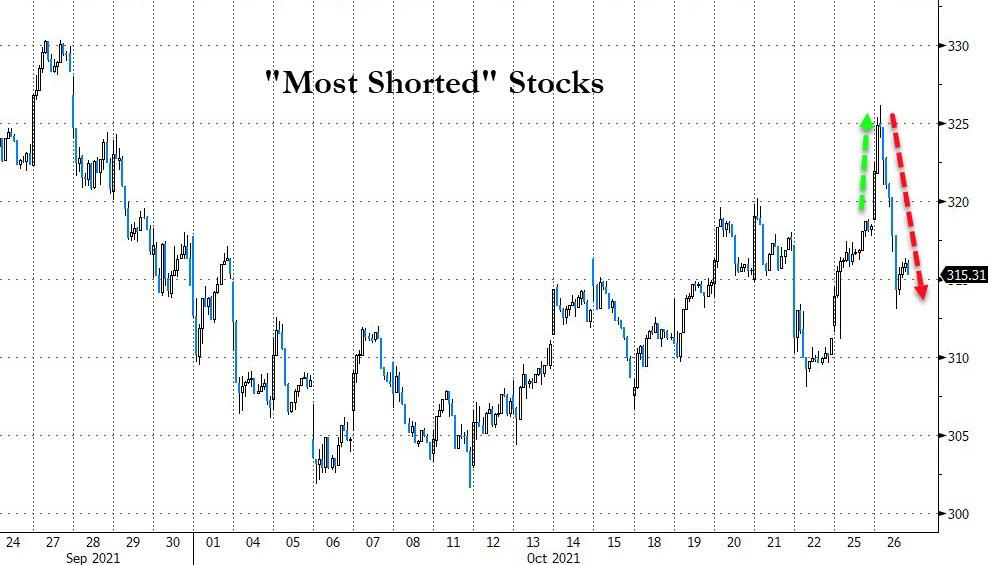
Today’s roller coaster ride was widely spread with Facebook doing a faceplant, following the China Index, which lost 4% today, and the most shorted stocks which, after an early bounce simply did what shorted stocks are supposed to do, namely go down.
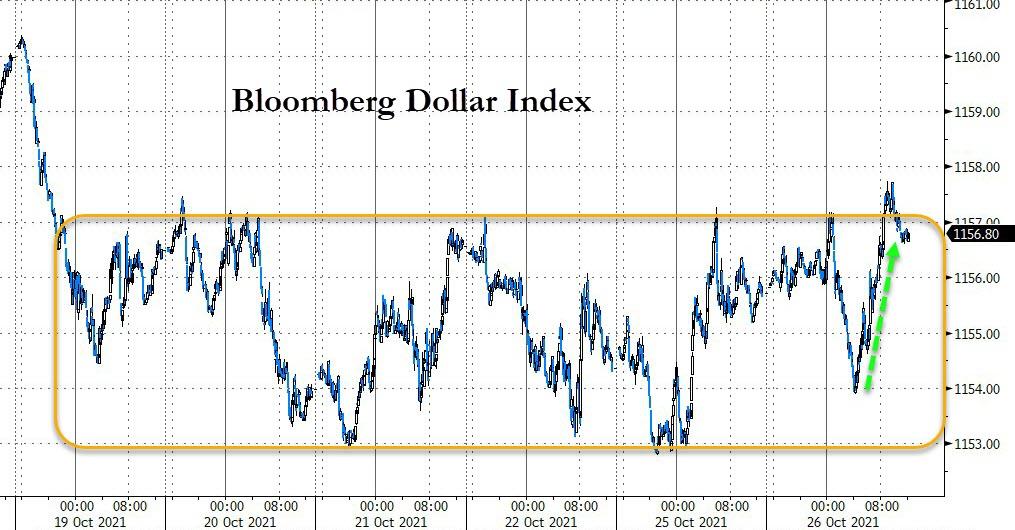
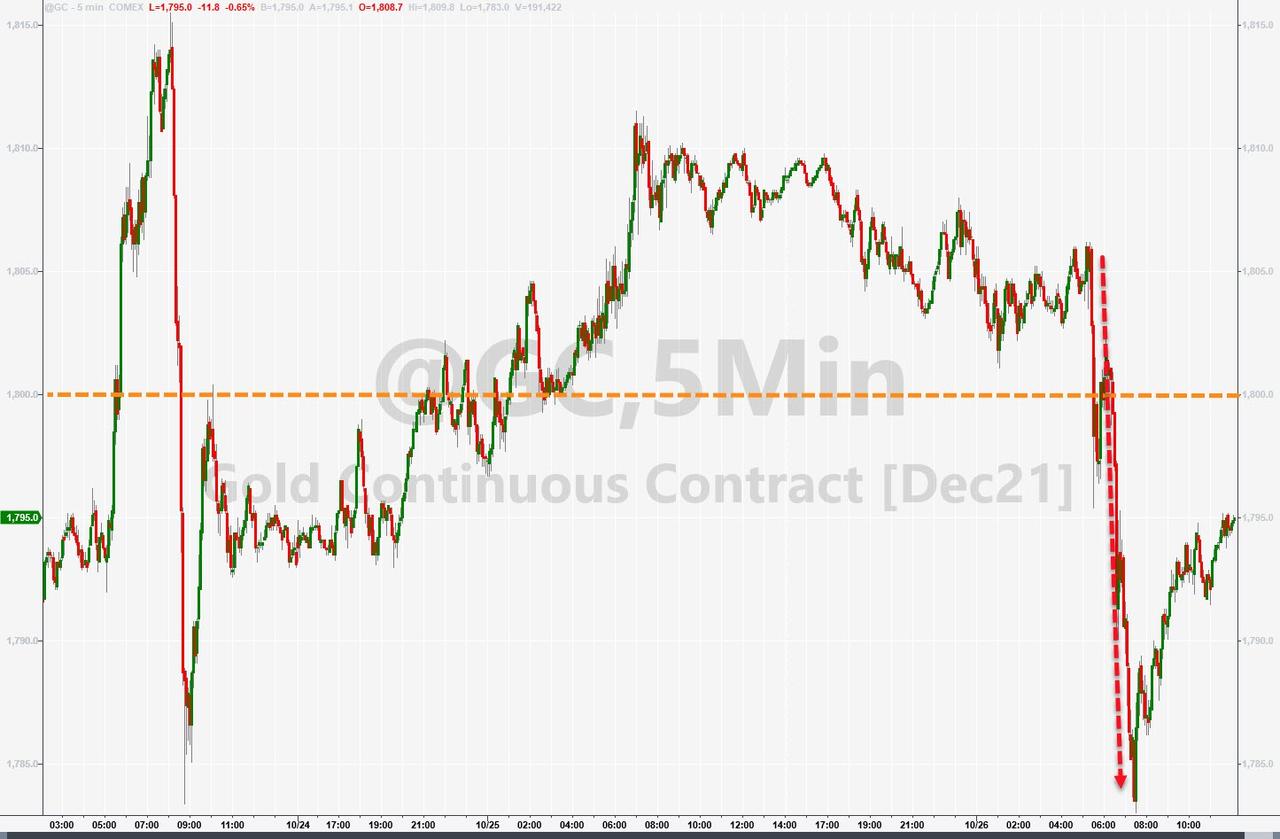
Not to be outdone, the US Dollar dumped and pumped and ended marginally higher, but stayed in its week-long trading range. Gold was not able to withstand all that volatility and gave up its hard-fought gains and its $1,800 level, despite slipping bond yields.
It looked to have been a shakeout kind of session, which is a common theme considering the major indexes are nibbling at their all-time highs.
2. ETFs in the Spotlight
In case you missed the announcement and description of this section, you can read it here again.
It features some of the 10 broadly diversified domestic and sector ETFs from my HighVolume list as posted every Saturday. Furthermore, they are screened for the lowest MaxDD% number meaning they have been showing better resistance to temporary sell offs than all others over the past year.
The below table simply demonstrates the magnitude with which these ETFs are fluctuating above or below their respective individual trend lines (%+/-M/A). A break below, represented by a negative number, shows weakness, while a break above, represented by a positive percentage, shows strength.
For hundreds of ETF choices, be sure to reference Thursday’s StatSheet.
For this current domestic “Buy” cycle, here’s how some our candidates have fared:
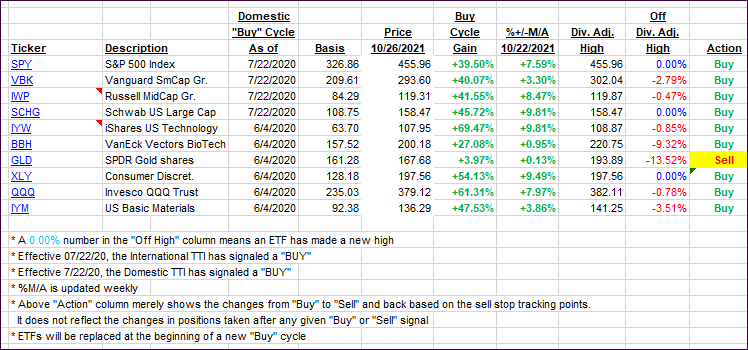
Click image to enlarge.
Again, the %+/-M/A column above shows the position of the various ETFs in relation to their respective long-term trend lines, while the trailing sell stops are being tracked in the “Off High” column. The “Action” column will signal a “Sell” once the -8% point has been taken out in the “Off High” column. For more volatile sector ETFs, the trigger point is -10%.
3. Trend Tracking Indexes (TTIs)
Our TTIs showed mixed results with the Domestic one retreating, even though the International one gained.
This is how we closed 10/26/2021:
Domestic TTI: +7.65% above its M/A (prior close +7.86%)—Buy signal effective 07/22/2020.
International TTI: +4.72% above its M/A (prior close +4.38%)—Buy signal effective 07/22/2020.
Disclosure: I am obliged to inform you that I, as well as my advisory clients, own some of the ETFs listed in the above table. Furthermore, they do not represent a specific investment
recommendation for you, they merely show which ETFs from the universe I track are falling within the specified guidelines.
All linked charts above are courtesy of Bloomberg via ZeroHedge.
Contact Ulli