Another Wild Ride On A Bucking Bronco

Ulli Market Commentary Contact

[Chart courtesy of MarketWatch.com]

  1. Moving the markets

Sometimes you just simply must step back and watch in awe how current markets trade like a penny stock when it comes to volatility.

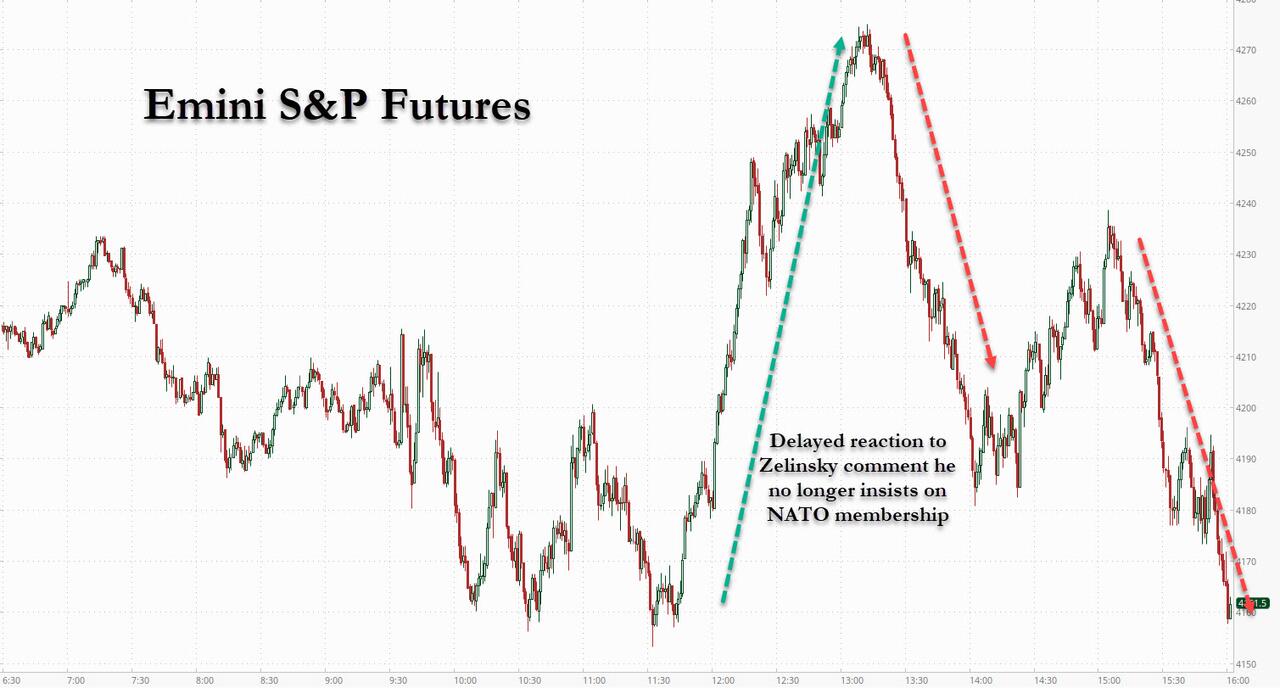
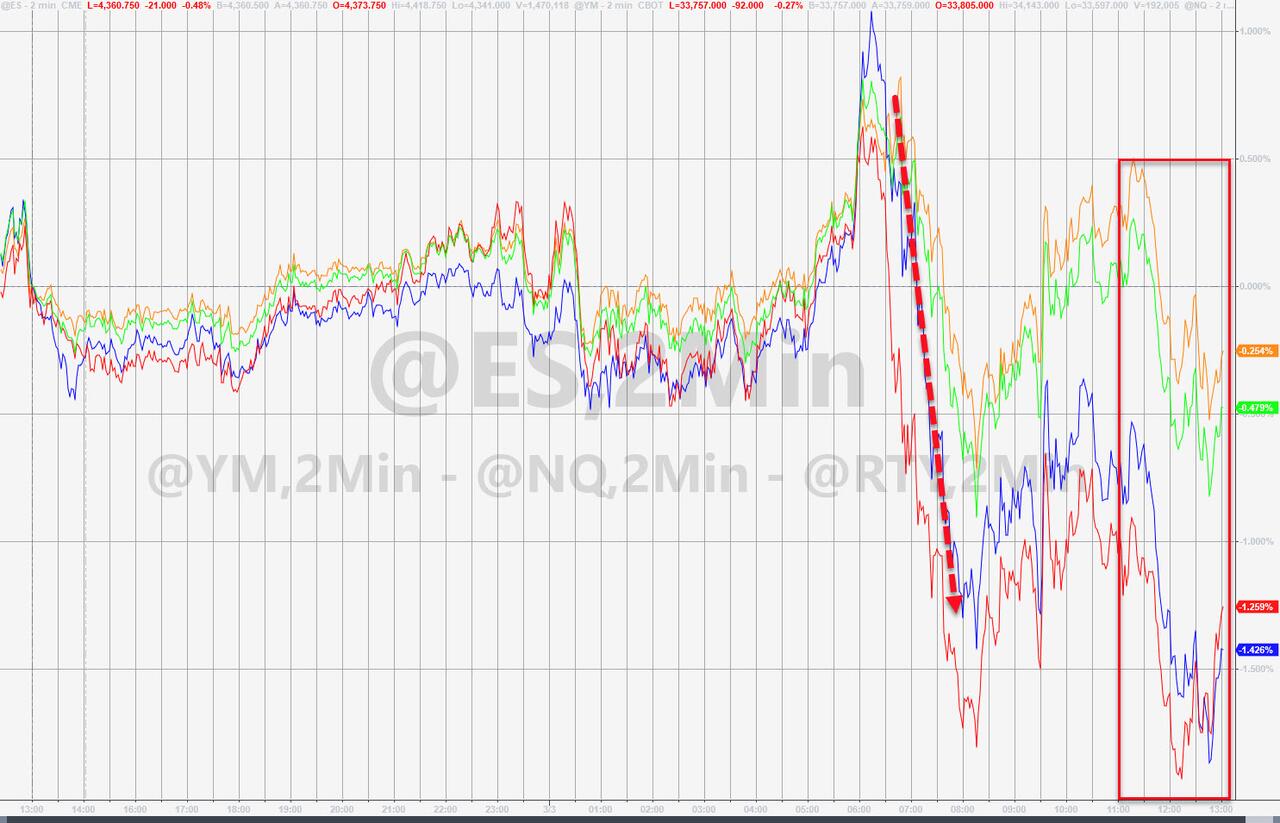
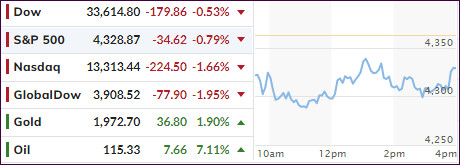
Yesterday, equities were simply spanked all day, which continued this morning as the Dow sank some 200 points and bounced around below its unchanged line. A sudden burst of buying pulled the indexes out of their slump, and the Dow soared into the plus by almost 600 points.

The bulls were cheering but were quickly disappointed as this surge got wiped out within 30 minutes, after which another rebound failed assuring a red close for the major indexes. Riding a bucking bronco might provide more directional certainty than current market behavior.

To me, this type of volatility seems to occur mainly at major inflection points meaning once a bearish trend turns bullish and vice versa. Year-to-date, we have seen nothing but aimless meandering, with the bearish theme being confirmed after our Domestic Sell signal became effective on 2/24/22.

ZeroHedge summed up today’s craziness like this:

But while everyone has an opinion about what comes next, the truth is that nobody knows what’s really going on as JJ Kinahan, chief market strategist at TD Ameritrade said: “I don’t think the market’s ignoring anything at the moment, to be honest with you. In fact, everything is hyper-sensitive as to what may happen. It’s so fluid and we will see what happens. It’s really tough to predict day-to-day.”

That said, broken markets continue, and the biggest shock overnight was the continued short squeeze in Nickel, which exploded to over $100,000, up more than 250% on the day, before being halted by the LME amid a relentless margin call frenzy which left at least one Chinese tycoon billions poorer.

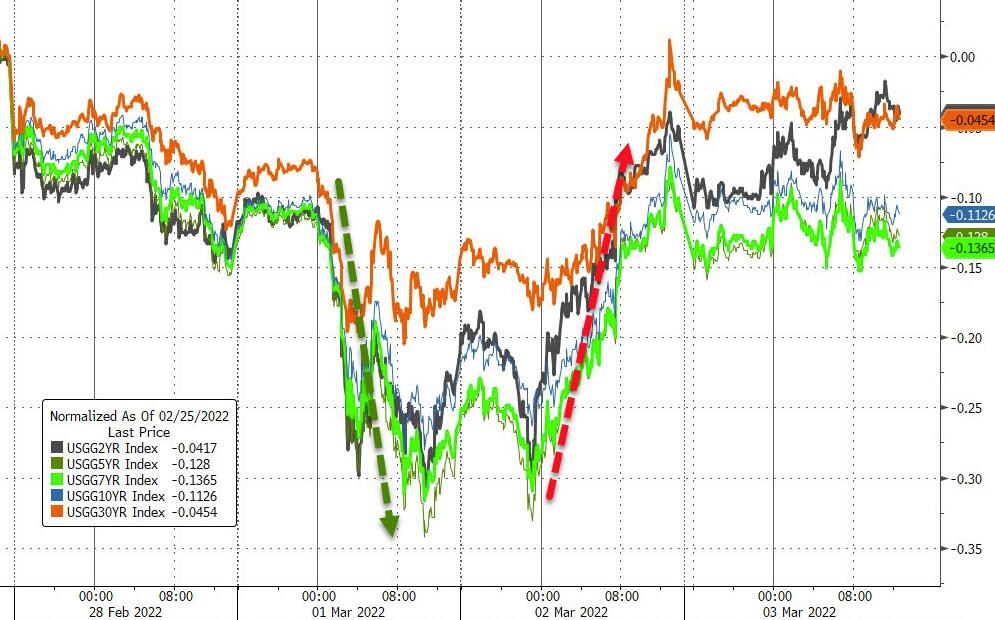
The flight to safety was on with the main beneficiary being gold, as the precious metal added another +3.04% to close at $2,056. You might have expected to see lower bond yields during these times of stress, but that did happen because yields rallied with the 10-year closing at 1.85%.  

Again, this is the time to be exposed to selected sector funds, especially those that take advantage of the current global economic dysfunction.

Read More
Bubble Meets Trouble

Ulli Market Commentary Contact

[Chart courtesy of MarketWatch.com]

  1. Moving the markets

I noted my surprise on Friday that equities had not been more negatively affected by the geopolitical events, but that notion seemed to have changed today.

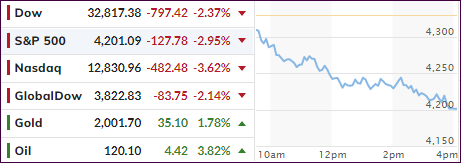
One look at the S&P 500 chart above tells the story that the bears ruled supreme and, at least for the time being, won the tug-of-war against the bulls by severely spanking the major indexes.

The decline was broad, except for certain sectors that were rewarding to be invested in. You can view some of those candidates in my latest Thursday StatSheet.

The actors participating in today’s market smacking were the same from last week, ranging from geopolitical events to inflation fears, GDP heading towards zero and supply chain issues, especially in the energy sector. The realization has now set in that the dreaded “S” word, as in Stagflation, can now no longer be ignored, as the economy appears to be in the process of rolling over.

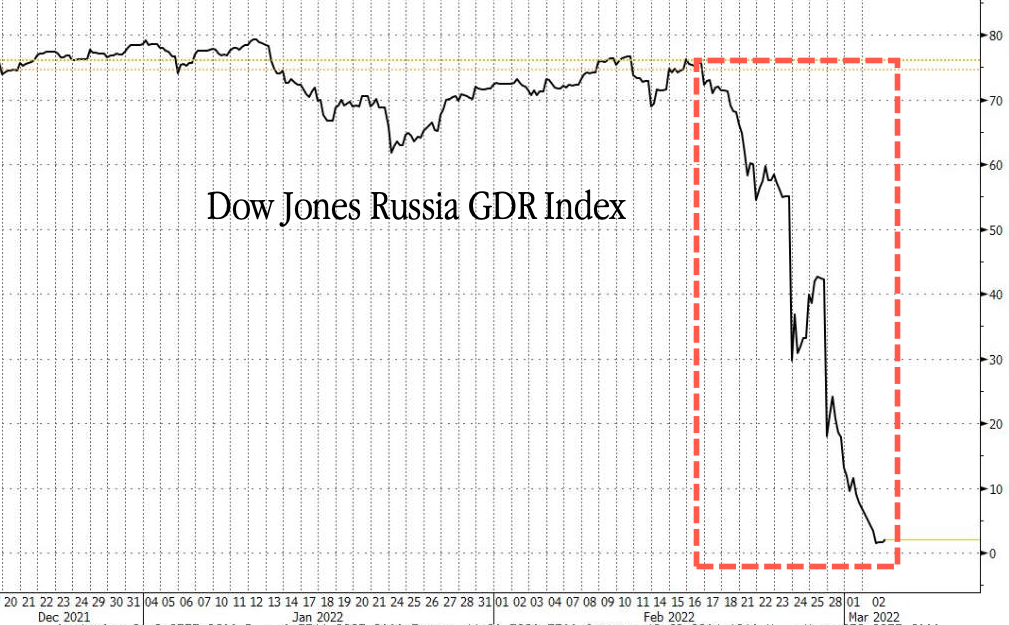
Some traders called the current market to be dysfunctional, while being concerned that credit default swaps may not pay out in case of a default. As ZH noted, part of the reason is that Russian equites have fallen by an absurd amount with one index (GDR) plunging a mind-boggling 97% in just a few days while wiping out some $572 billion. For sure, there will be fallout effects around the world.

Added ZH:

There is no other way to describe today’s market carnage than a market in turmoil where things are rapidly breaking as commodity collateral is suddenly sparking contagion and liquidations.

Then this:

The Nasdaq tumbled 3.6% with the help of Facebook and Moderna both of which have wiped out more than 50% of their value from all-time highs and is now down more than 20% from its all-time high, closing in a bear market, where it joins the Russell, which is now also down more than 20% from ATH.

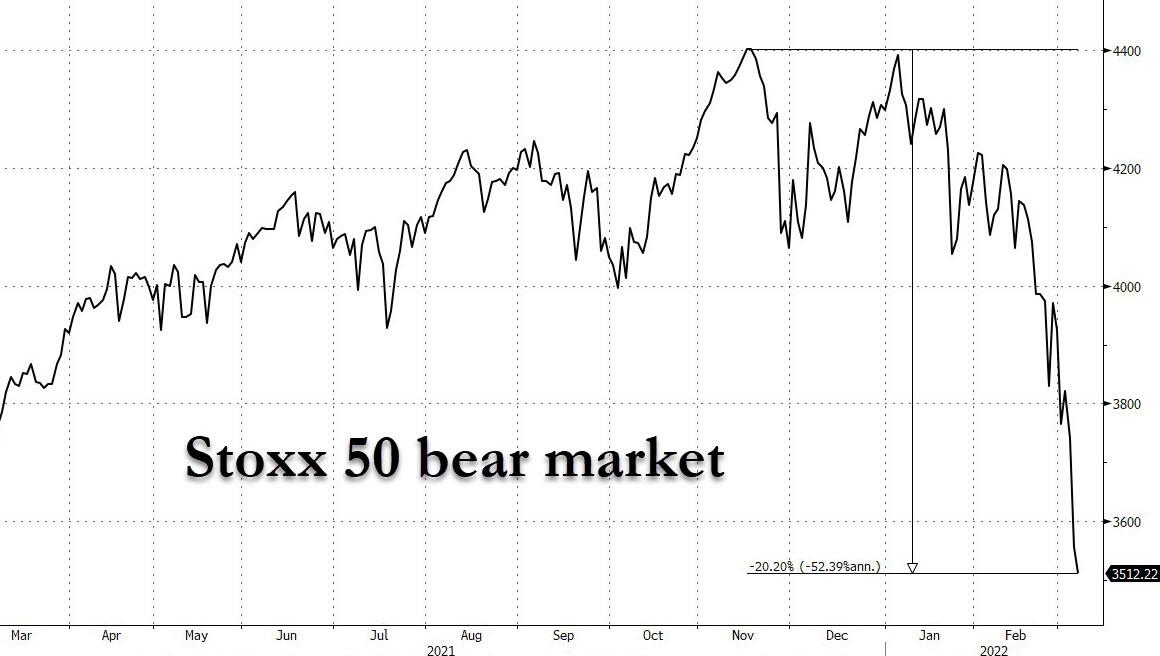
Europe performed even worse with the well-known Stoxx index now in bear market territory and having reached its lowest level since November 2020. Ouch!

Bucking the trend were gold, energy, and commodities, which appear to provide some stability in an increasingly unstable world, the latter of which was even admitted by the White House:

  • WHITE HOUSE SAYS U.S. NEEDS TO BE PREPARED FOR LONG, DIFFICULT ROAD AHEAD
Read More

ETFs On The Cutline – Updated Through 03/04/2022

Ulli ETFs on the Cutline Contact

Below, please find the latest High-Volume ETF Cutline report, which shows how far above or below their respective long-term trend lines (39-week SMA) my currently tracked ETFs are positioned.

This report covers the HV ETF Master List from Thursday’s StatSheet and includes 312 High Volume ETFs, defined as those with an average daily volume of more than $5 million, of which currently 78 (last week 88) are hovering in bullish territory. The yellow line separates those ETFs that are positioned above their trend line (%M/A) from those that have dropped below it.

Take a look:                                                                   

The HV ETF Master Cutline Report

In case you are not familiar with some of the terminology used in the reports, please read the Glossary of Terms. If you missed the original post about the Cutline approach, you can read it here.

ETF Tracker Newsletter For March 4, 2022

Ulli ETF Tracker Contact

ETF Tracker StatSheet          

You can view the latest version here.

FADING INTO THE WEEKEND

[Chart courtesy of MarketWatch.com]

  1. Moving the markets

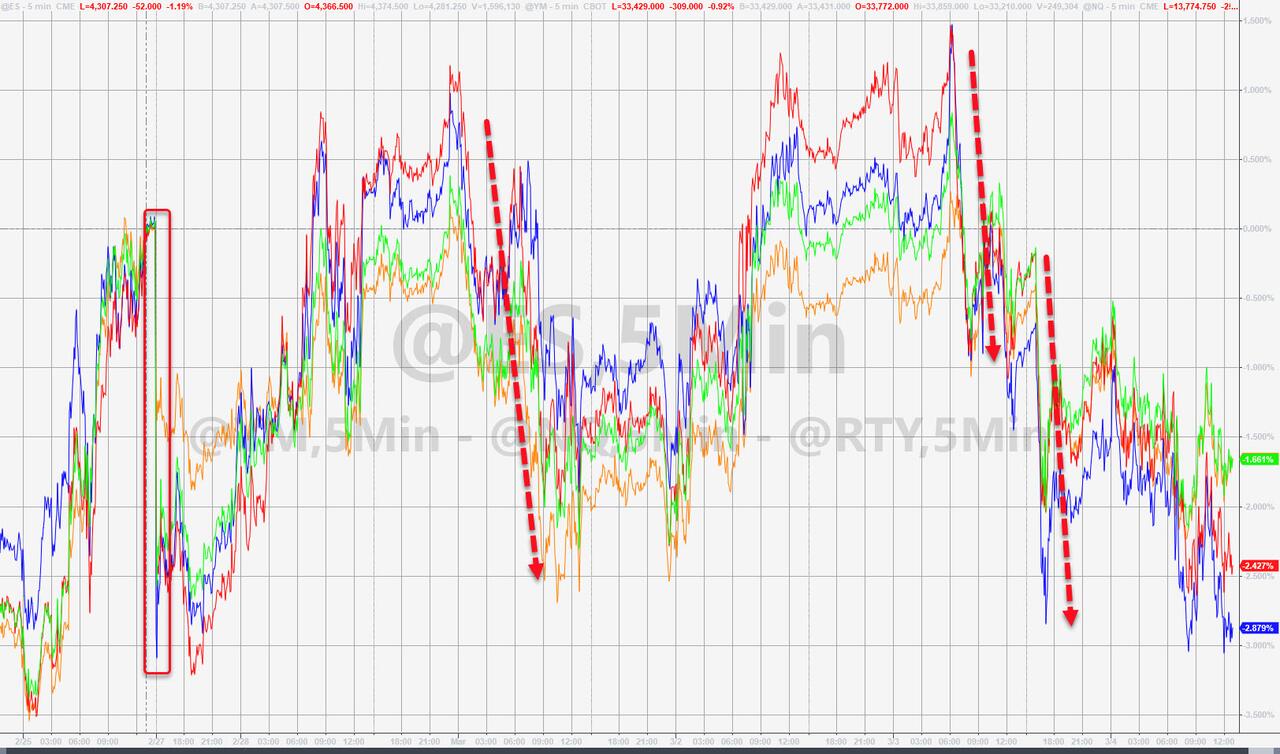
Even a better-than-expected jobs report (678k gained vs. expectations of 423k) was not enough to compete with the negative overhang of the geopolitical environment, as the Russia-Ukraine skirmish continued unabated, despite encouraging attempts on both sides to schedule meetings.

It’s not my job to discuss the Ukraine media headline euphoria but focus on the market fallout. While the initial losses, showing the Dow down 500 points, were sharply reduced by the time the closing bell rang, the outcome was still bearish with the Dow now having scored its fourth straight losing week.

MSM will now try to blame the domestic and global economic conditions on the Ukraine crisis, but keep in mind that slow growth, rising prices, and supply chain issues have plagued us long before said crisis came into the picture. However, negative supply shocks will take things to a new level and move us into uncharted territory.

MN Gordon from the EconomicPrism.com summed up like this:

There are not only oil supply shocks to contend with.  There are also food supply shocks…and broken supply chains.

He also succinctly pointed out Fed head Powell’s dilemma:

For Powell, the task at hand this week was twofold.  First, demonstrate the central bank would be taking measures to control inflation.  Second, show Wall Street the Fed still has its back.

Thus, Powell went middle of the road.  He’ll be proposing a 25-basis point rate hike at the upcoming FOMC meeting.

“We’re going to use our tools, and we’re going to get this done,” said Powell to the Senate Banking Committee.

In other words, he’s effectively doing nothing to fight inflation.

What gives?  Is this some kind of joke?  How’s a 25-basis point rate hike supposed to rein in inflation that’s officially raging at 7.5 percent?

Clearly, Powell’s pivot is a pivot to nowhere.  High consumer price inflation is here to stay.

This accurately assesses the current situation with the open-ended question being: Can markets really see this as a bullish environment long term?

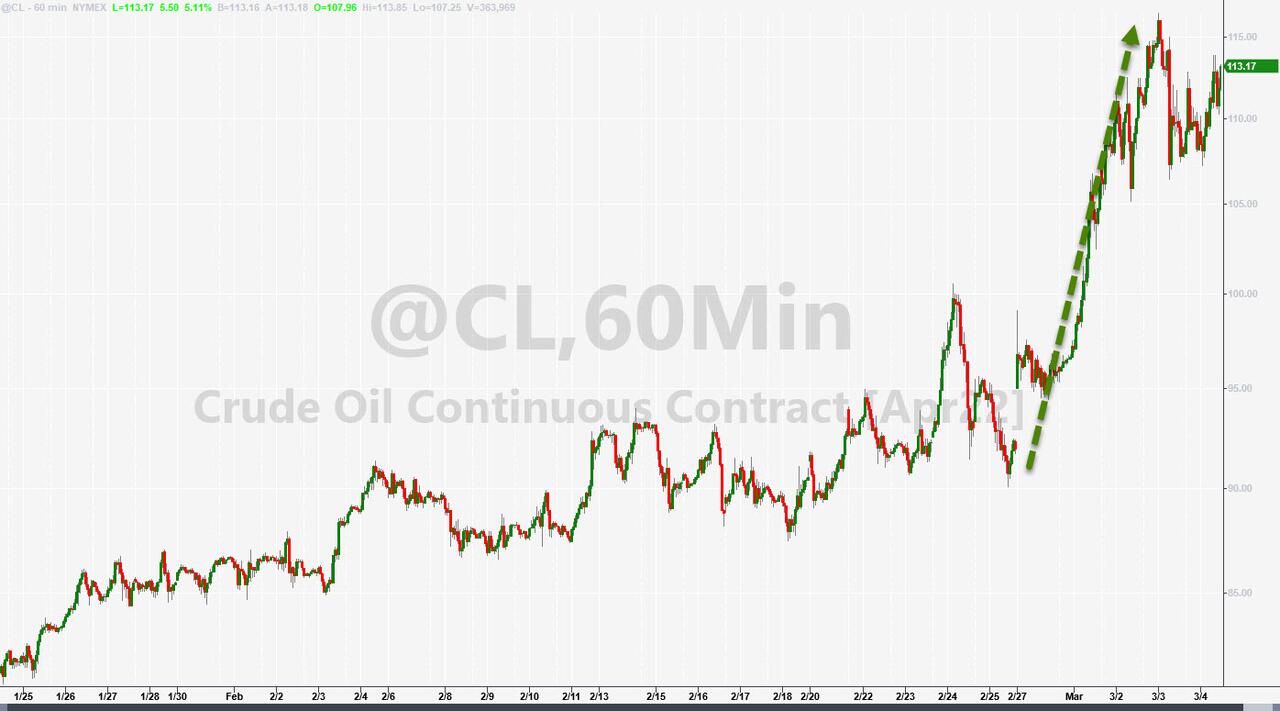
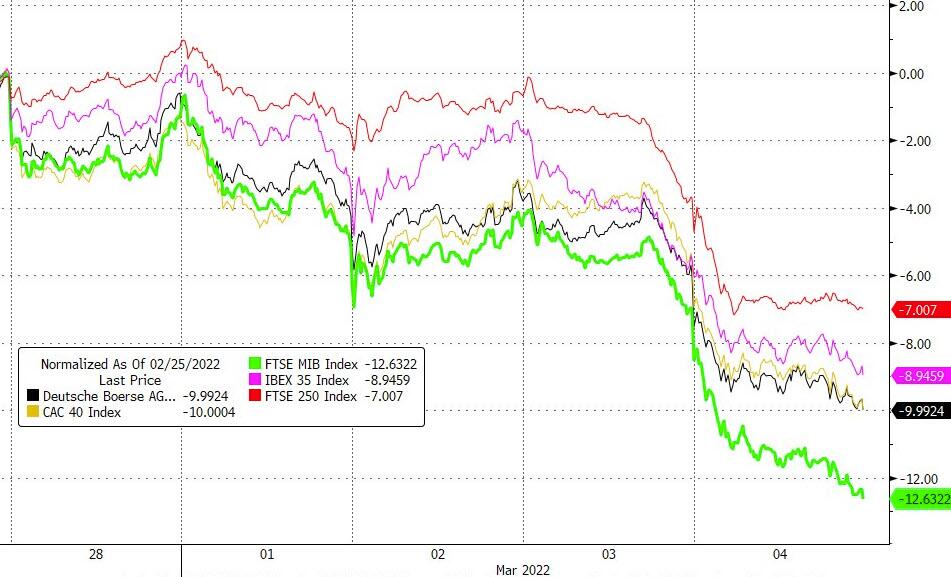
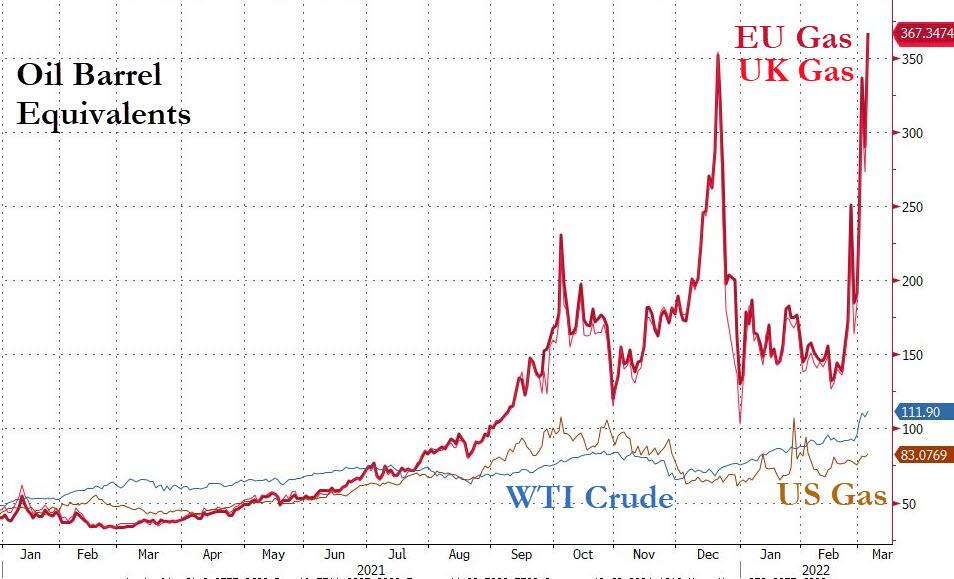
Crude oil continued its march higher by gaining 6.58% on the session to close a shade under $115. Europe not only fared the worst in the equity department with their indexes scoring the worst week since March 2020, but their energy costs exploded to a record high.

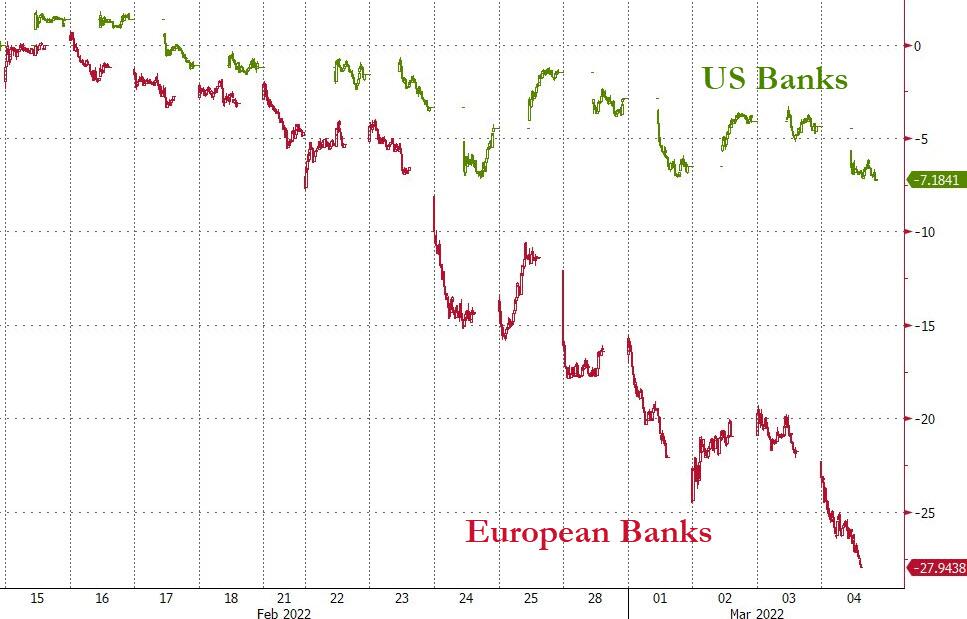
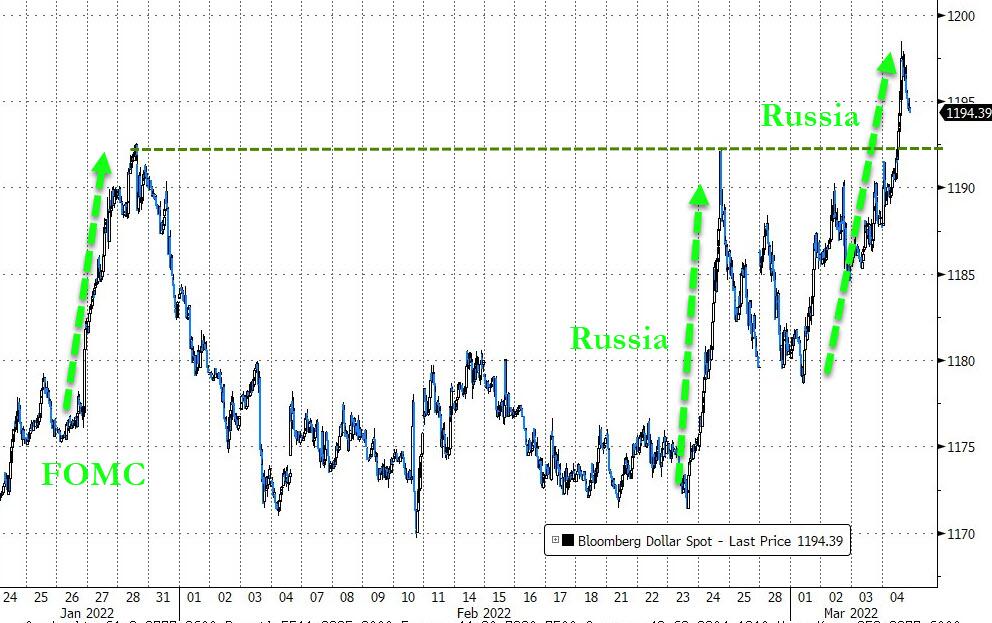
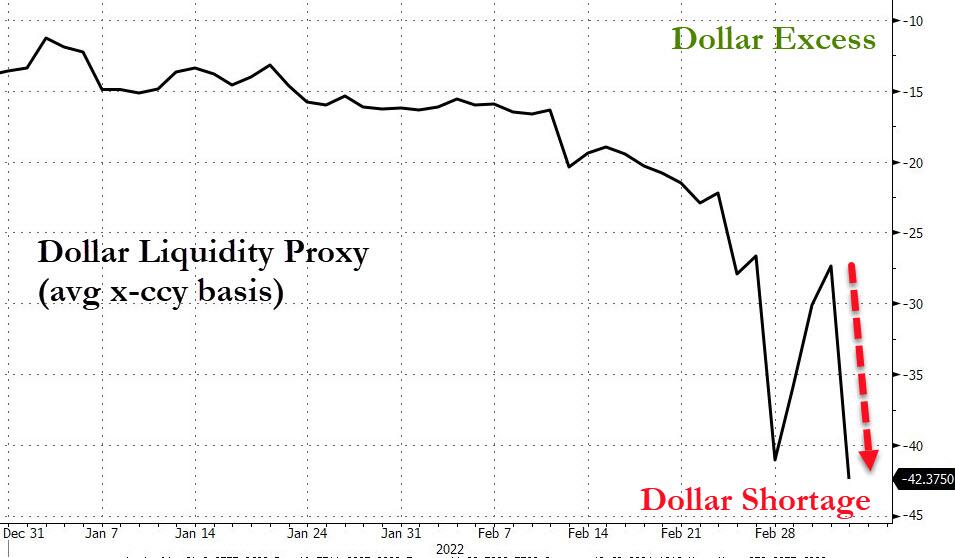
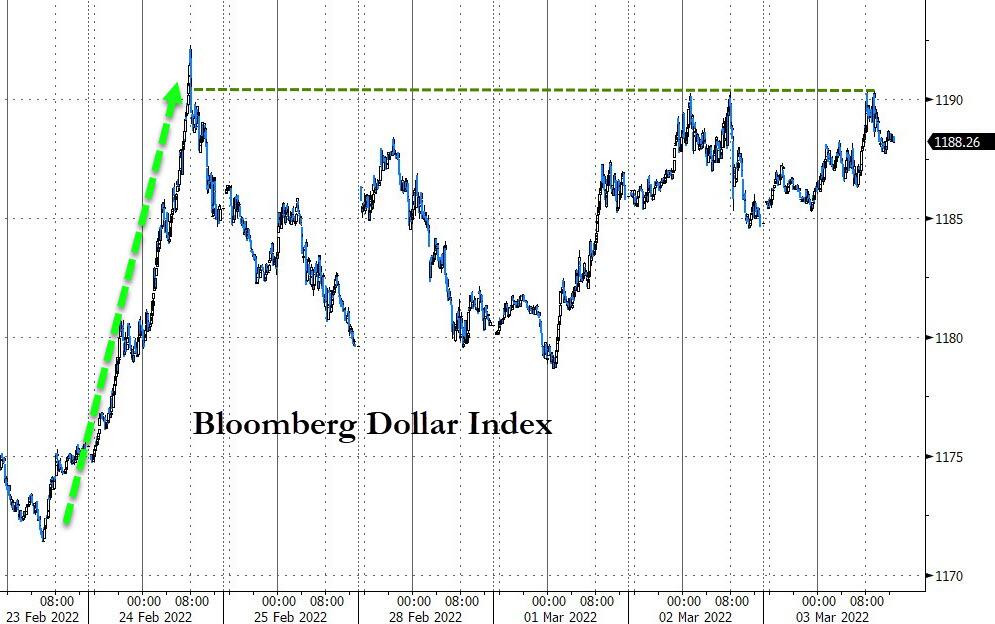
And it did not end there. While US Banks showed weakness, it was nothing compared to their European cousins, which imitated a swan dive. The US Dollar benefited by being perceived as a haven of safety, as dollar liquidity problems ran rampant.   

Helping my favorite commodity ETF to add an astounding 4.21% on the day was the fact that Bloomberg’s Spot commodity index saw not only its biggest jump since September 1974 but also closing at a record new high.

Gold followed suit and added another 1.93% to close at $1,973.

There is chaos in all markets, and I am surprised how well domestic equities have held up—so far.

Read More

Weekly StatSheet For The ETF Tracker Newsletter – Updated Through 03/03/2022

Ulli ETF StatSheet Contact

ETF Data updated through Thursday, March 3, 2022

Methodology/Use of this StatSheet:

1. From the universe of over 1,800 ETFs, I have selected only those with a trading volume of over $5 million per day (HV ETFs), so that liquidity and a small bid/ask spread are assured.

2. Trend Tracking Indexes (TTIs)

Buy or Sell decisions for Domestic and International ETFs (section 1 and 2), are made based on the respective TTI and its position either above or below its long-term M/A (Moving Average). A crossing of the trend line from below accompanied by some staying power above constitutes a “Buy” signal. Conversely, a clear break below the line constitutes a “Sell” signal. Additionally, I use an 12% trailing stop loss on all positions in these categories to control downside risk.

3. All other investment arenas do not have a TTI and should be traded based on the position of the individual ETF relative to its own respective trend line (%M/A). That’s why those signals are referred to as a “Selective Buy.” In other words, if an ETF crosses its own trendline to the upside, a “Buy” signal is generated. Here too, I recommend trailing sell stop of 12%, or less, depending on your risk tolerance.

If you are unfamiliar with some of the terminology, please see Glossary of Terms and new subscriber information in section 9.     

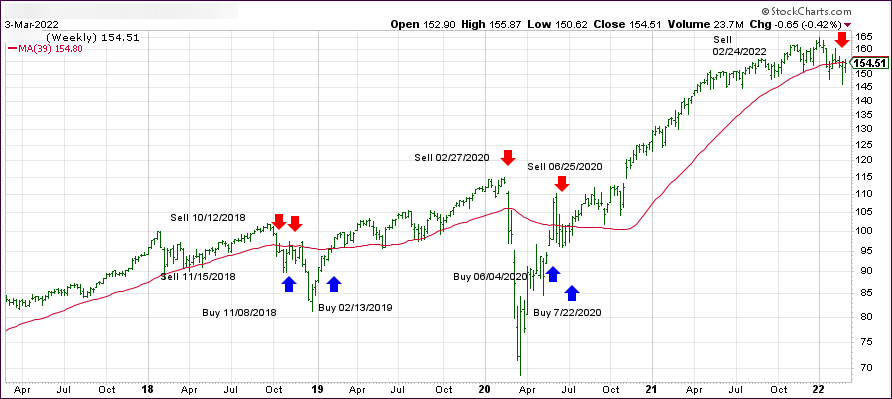
1. DOMESTIC EQUITY ETFs: SELL — since 02/24/2020

Click on chart to enlarge

Our main directional indicator, the Domestic Trend Tracking Index (TTI-green line in the above chart) has broken below its long-term trend line (red) by -0.13% and is now in the “Sell” mode.

Read More

Popping And Dropping

Ulli Market Commentary Contact

[Chart courtesy of MarketWatch.com]

  1. Moving the markets

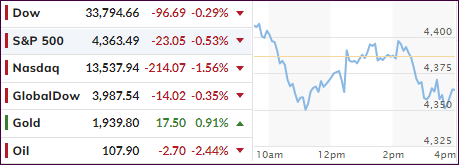
Chopping around their respective unchanged lines appeared to be the mantra for the major indexes, after an early pop ran out of steam and gave way to weakness, as bullish sentiment fell by the wayside.

The Nasdaq fared the worst with a 1.56% loss, though the Dow and S&P 500 retreated only moderately. The Ukraine situation remains unstable, but some Wall Street optimists are arguing that “the market is close or has already found its bottom for the year.” Yeah right.

My view aligns more with the realistic assessment from economic advisor Mohamed El-Erian, who sees it this way:

“Markets have been resilient. How long will that last? It’s getting weaker and it’s getting weaker because the Fed is not injecting liquidity starting from this month. So, I expect the strong technicals that have seen us through one shock after the other will get a lot weaker this year, and that means more volatile markets and that also means there’s going to be more pressure on markets.”

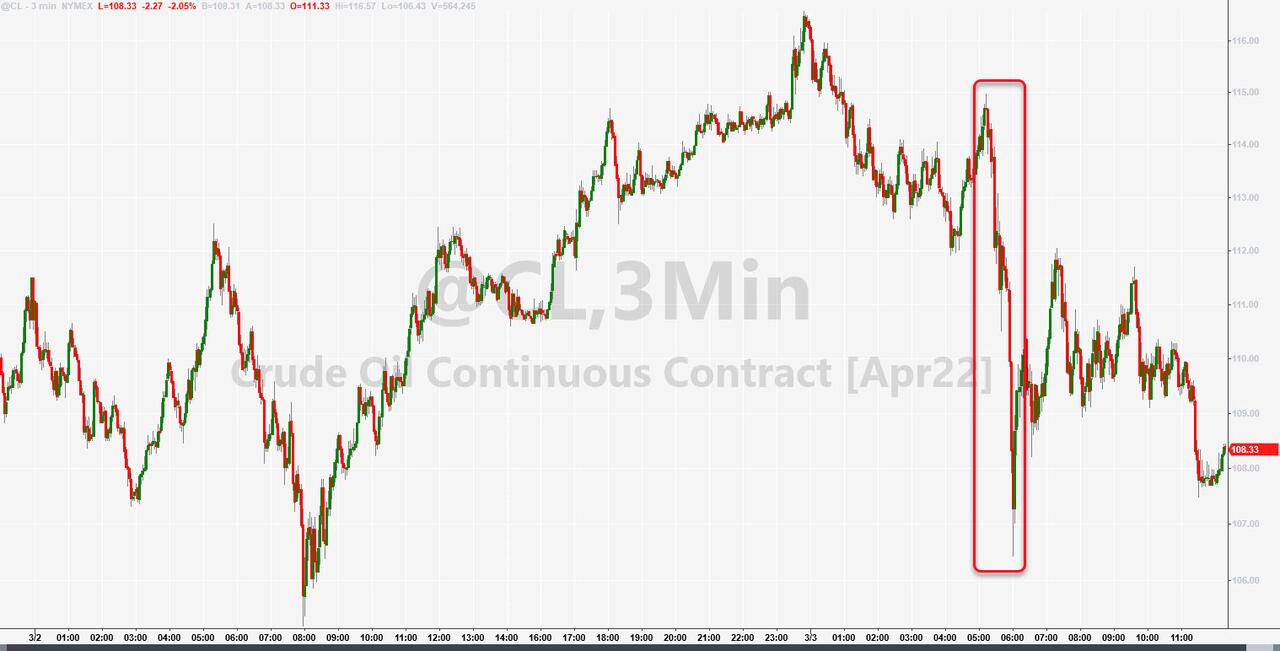
Despite ongoing geopolitical tensions oil prices pulled back some 2%, as rumors of an imminent Iran deal made the rounds, but that could turn on a dime.

I have brought up the “Stagflation” scenario on several occasions and today, analyst Jim Bianco pointed towards the dreaded “R” word:

Not every recession is led by a 50% rise in crude.

But every 50% rise in crude has led a recession.

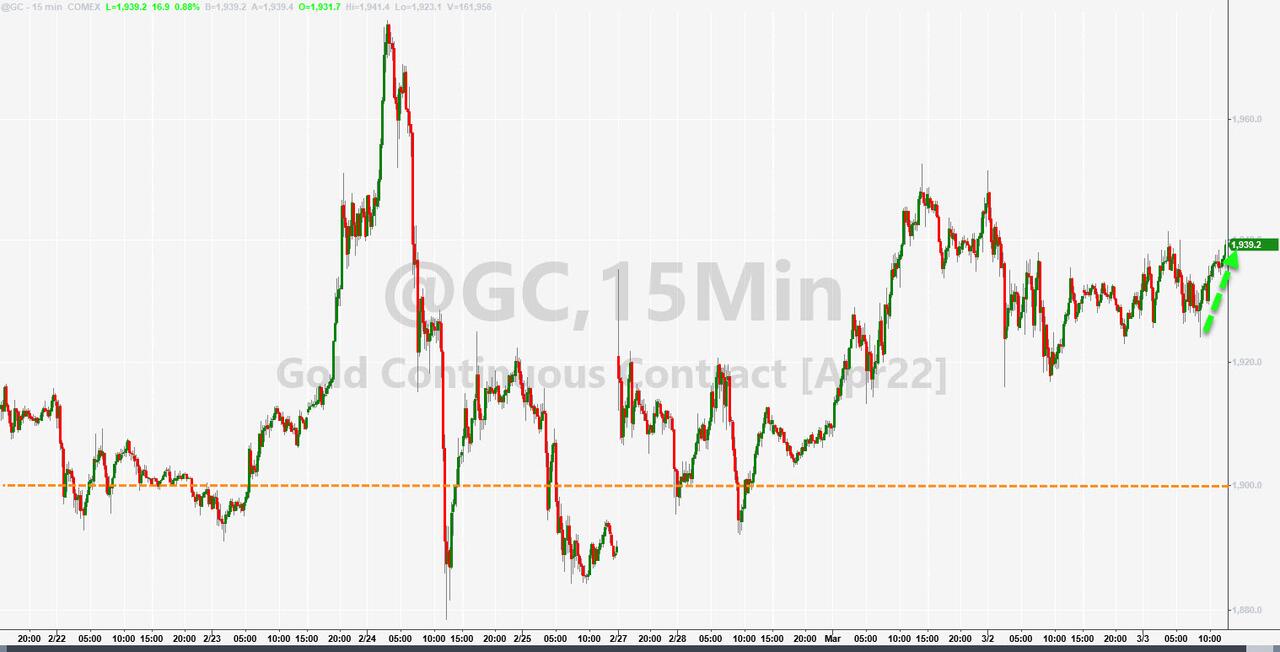
Bond yields were mixed, the US Dollar rallied moderately, while gold acted as a safe haven by rising +0.86% and settling at $1,939. The commodity index DBC continued to pump and added +1.09% for the session.      

Read More