
- Moving the markets
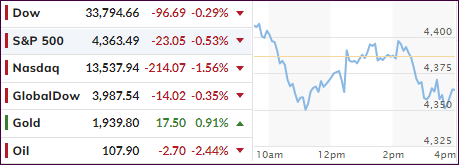
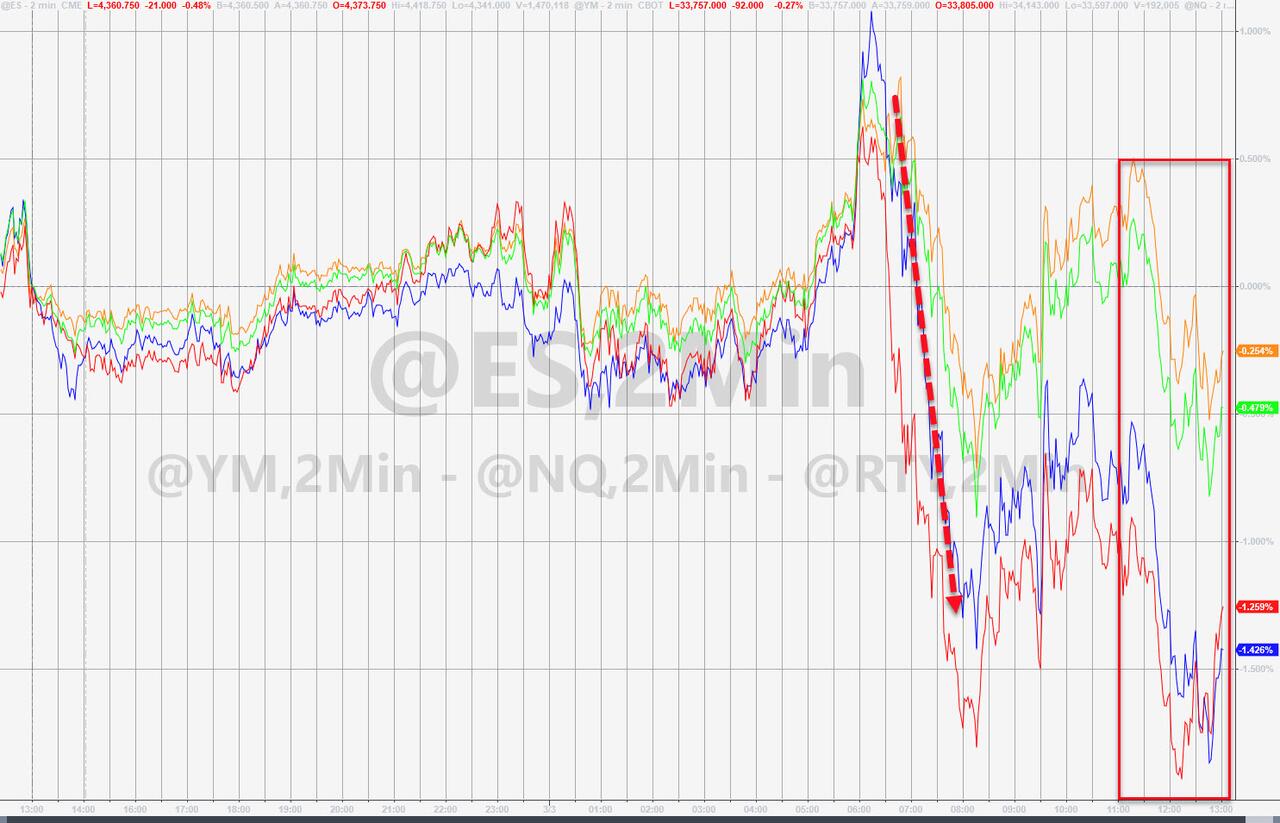
Chopping around their respective unchanged lines appeared to be the mantra for the major indexes, after an early pop ran out of steam and gave way to weakness, as bullish sentiment fell by the wayside.
The Nasdaq fared the worst with a 1.56% loss, though the Dow and S&P 500 retreated only moderately. The Ukraine situation remains unstable, but some Wall Street optimists are arguing that “the market is close or has already found its bottom for the year.” Yeah right.
My view aligns more with the realistic assessment from economic advisor Mohamed El-Erian, who sees it this way:
“Markets have been resilient. How long will that last? It’s getting weaker and it’s getting weaker because the Fed is not injecting liquidity starting from this month. So, I expect the strong technicals that have seen us through one shock after the other will get a lot weaker this year, and that means more volatile markets and that also means there’s going to be more pressure on markets.”
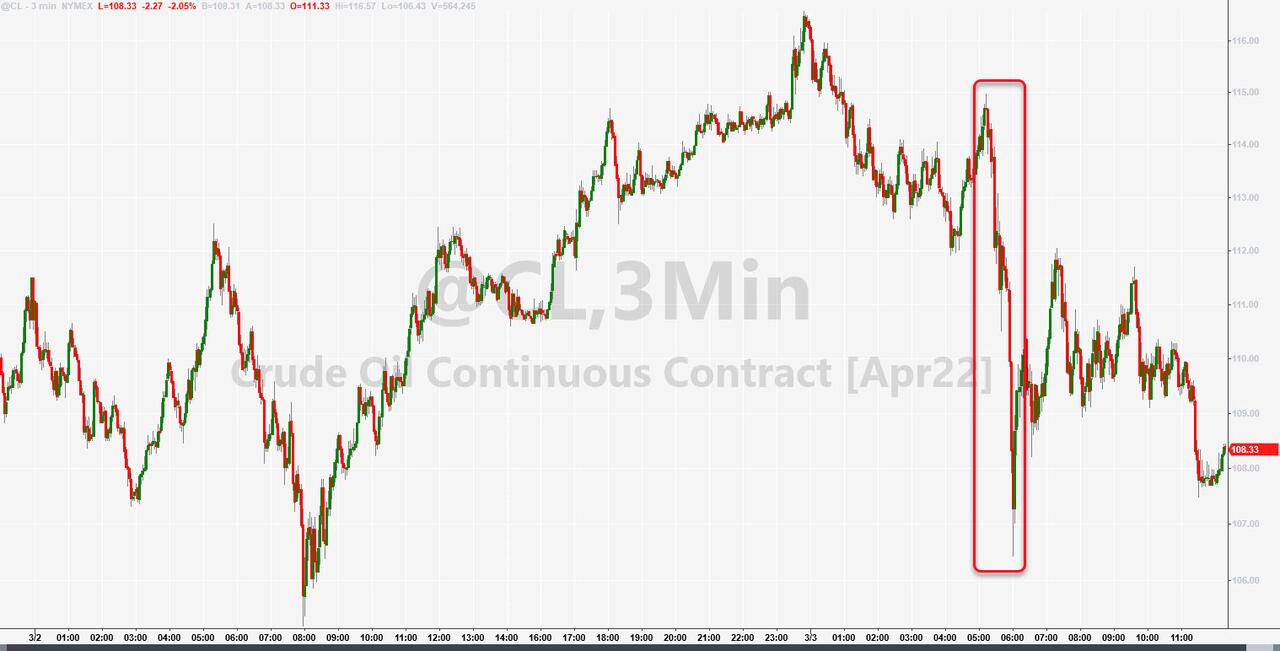
Despite ongoing geopolitical tensions oil prices pulled back some 2%, as rumors of an imminent Iran deal made the rounds, but that could turn on a dime.
I have brought up the “Stagflation” scenario on several occasions and today, analyst Jim Bianco pointed towards the dreaded “R” word:
Not every recession is led by a 50% rise in crude.
But every 50% rise in crude has led a recession.
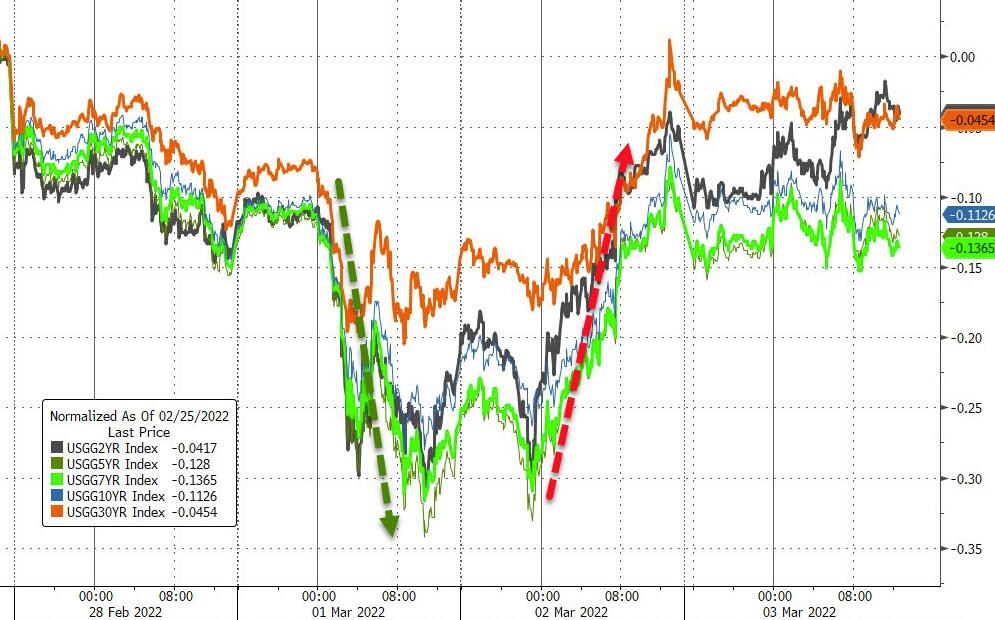
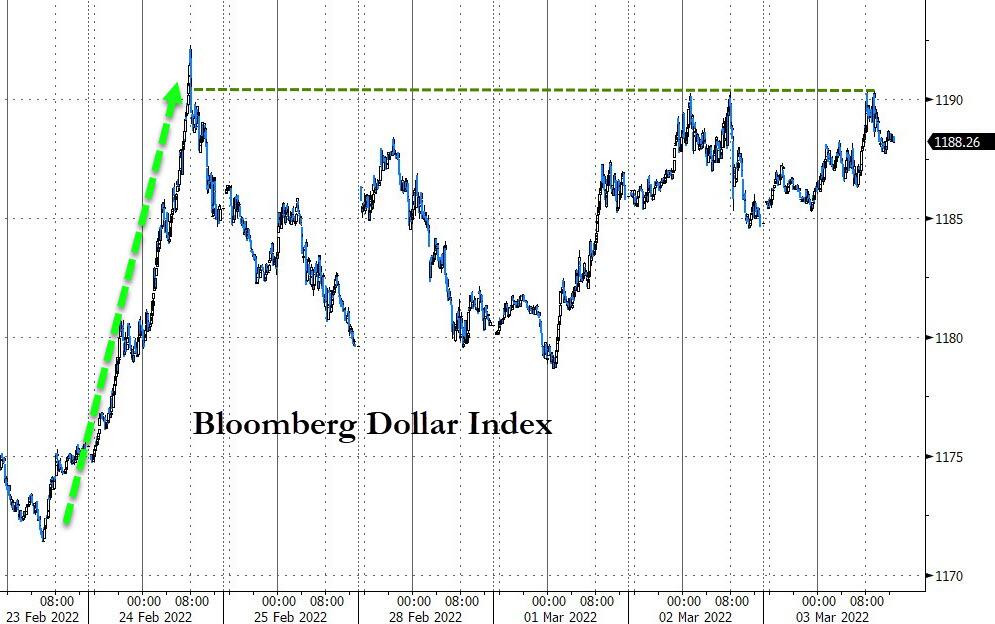
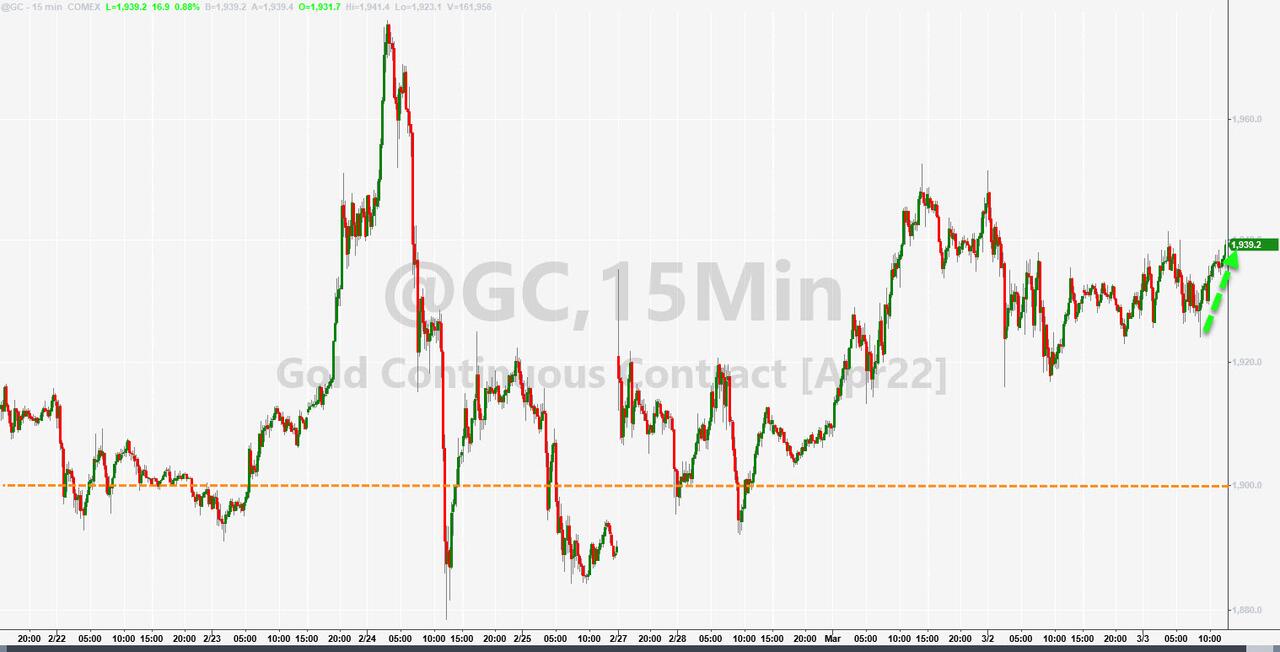
Bond yields were mixed, the US Dollar rallied moderately, while gold acted as a safe haven by rising +0.86% and settling at $1,939. The commodity index DBC continued to pump and added +1.09% for the session.
2. ETFs in the Spotlight
In case you missed the announcement and description of this section, you can read it here again.
It features some of the 10 broadly diversified domestic and sector ETFs from my HighVolume list as posted every Saturday. Furthermore, they are screened for the lowest MaxDD% number meaning they have been showing better resistance to temporary sell offs than all others over the past year.
The below table simply demonstrates the magnitude with which these ETFs are fluctuating above or below their respective individual trend lines (%+/-M/A). A break below, represented by a negative number, shows weakness, while a break above, represented by a positive percentage, shows strength.
For hundreds of ETF choices, be sure to reference Thursday’s StatSheet.
For this just closed-out domestic “Buy” cycle, here’s how some of our candidates have fared:
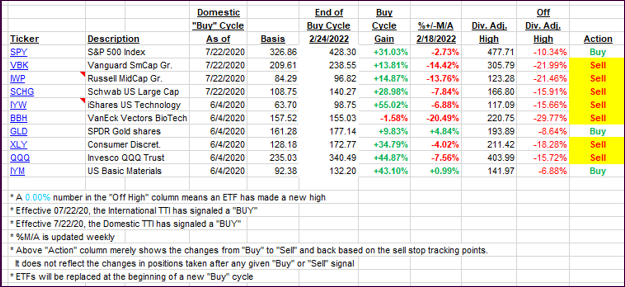
Click image to enlarge.
Again, the %+/-M/A column above shows the position of the various ETFs in relation to their respective long-term trend lines, while the trailing sell stops are being tracked in the “Off High” column. The “Action” column will signal a “Sell” once the -12% point has been taken out in the “Off High” column, which has replaced the prior -8% to -10% limits.
3. Trend Tracking Indexes (TTIs)
The Domestic trend line dance continued with the TTI now having slipped back into bearish territory.
This is how we closed 03/03/2022:
Domestic TTI: -0.13% below its M/A (prior close +0.08%)—Sell signal effective 02/24/2022.
International TTI: -2.01% below its M/A (prior close -1.46%)—Buy signal effective 07/22/2020.
Disclosure: I am obliged to inform you that I, as well as my advisory clients, own some of the ETFs listed in the above table. Furthermore, they do not represent a specific investment recommendation for you, they merely show which ETFs from the universe I track are falling within the specified guidelines.
All linked charts above are courtesy of Bloomberg via ZeroHedge.
Contact Ulli