
- Moving the markets
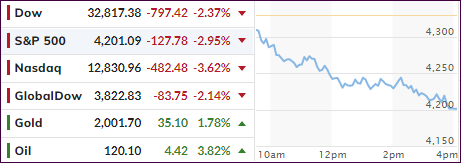
I noted my surprise on Friday that equities had not been more negatively affected by the geopolitical events, but that notion seemed to have changed today.
One look at the S&P 500 chart above tells the story that the bears ruled supreme and, at least for the time being, won the tug-of-war against the bulls by severely spanking the major indexes.
The decline was broad, except for certain sectors that were rewarding to be invested in. You can view some of those candidates in my latest Thursday StatSheet.
The actors participating in today’s market smacking were the same from last week, ranging from geopolitical events to inflation fears, GDP heading towards zero and supply chain issues, especially in the energy sector. The realization has now set in that the dreaded “S” word, as in Stagflation, can now no longer be ignored, as the economy appears to be in the process of rolling over.
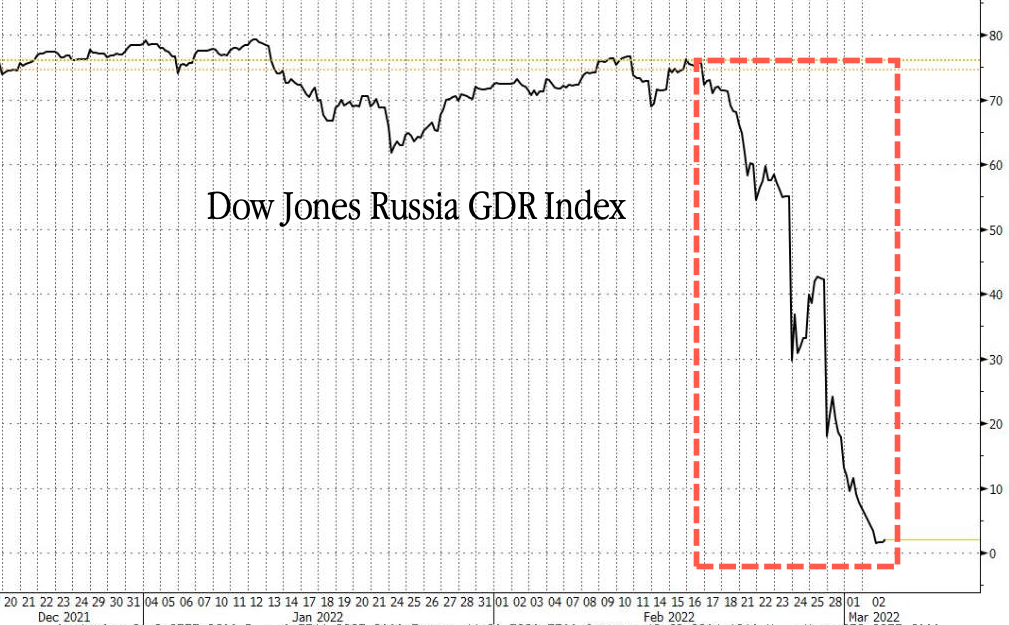
Some traders called the current market to be dysfunctional, while being concerned that credit default swaps may not pay out in case of a default. As ZH noted, part of the reason is that Russian equites have fallen by an absurd amount with one index (GDR) plunging a mind-boggling 97% in just a few days while wiping out some $572 billion. For sure, there will be fallout effects around the world.
Added ZH:
There is no other way to describe today’s market carnage than a market in turmoil where things are rapidly breaking as commodity collateral is suddenly sparking contagion and liquidations.
Then this:
The Nasdaq tumbled 3.6% with the help of Facebook and Moderna both of which have wiped out more than 50% of their value from all-time highs and is now down more than 20% from its all-time high, closing in a bear market, where it joins the Russell, which is now also down more than 20% from ATH.
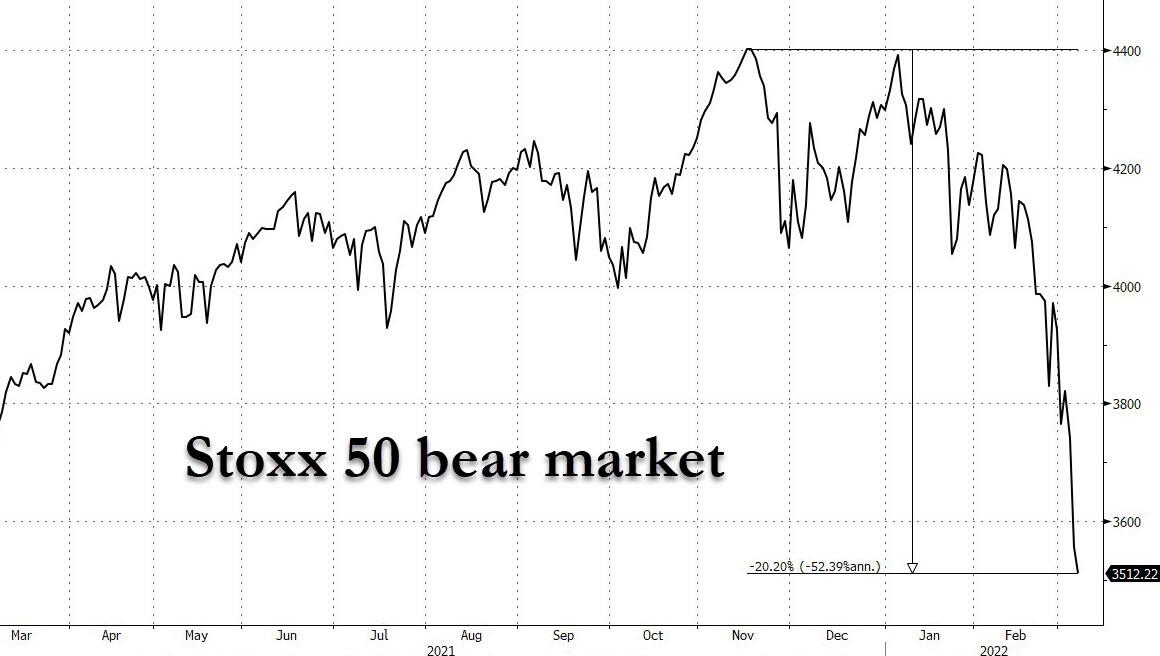
Europe performed even worse with the well-known Stoxx index now in bear market territory and having reached its lowest level since November 2020. Ouch!
Bucking the trend were gold, energy, and commodities, which appear to provide some stability in an increasingly unstable world, the latter of which was even admitted by the White House:
- WHITE HOUSE SAYS U.S. NEEDS TO BE PREPARED FOR LONG, DIFFICULT ROAD AHEAD
2. ETFs in the Spotlight
In case you missed the announcement and description of this section, you can read it here again.
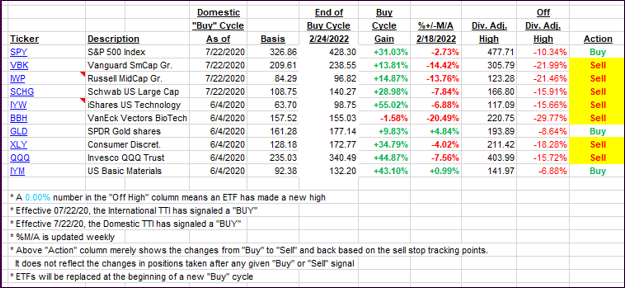
It features some of the 10 broadly diversified domestic and sector ETFs from my HighVolume list as posted every Saturday. Furthermore, they are screened for the lowest MaxDD% number meaning they have been showing better resistance to temporary sell offs than all others over the past year.
The below table simply demonstrates the magnitude with which these ETFs are fluctuating above or below their respective individual trend lines (%+/-M/A). A break below, represented by a negative number, shows weakness, while a break above, represented by a positive percentage, shows strength.
For hundreds of ETF choices, be sure to reference Thursday’s StatSheet.
For this just closed-out domestic “Buy” cycle, here’s how some of our candidates have fared:
Click image to enlarge.
Again, the %+/-M/A column above shows the position of the various ETFs in relation to their respective long-term trend lines, while the trailing sell stops are being tracked in the “Off High” column. The “Action” column will signal a “Sell” once the -12% point has been taken out in the “Off High” column, which has replaced the prior -8% to -10% limits.
3. Trend Tracking Indexes (TTIs)
Our TTIs took a dive, confirming my bearish view, with the International one showing extreme weakness and generating a “Sell” signal for that arena. For tracking purposes, the effective date will be tomorrow, March 8, 2022.
This is how we closed 03/07/2022:
Domestic TTI: -3.52% below its M/A (prior close -0.78%)—Sell signal effective 02/24/2022.
International TTI: -5.95% below its M/A (prior close -3.84%)—Sell signal effective 03/08/2022.
Disclosure: I am obliged to inform you that I, as well as my advisory clients, own some of the ETFs listed in the above table. Furthermore, they do not represent a specific investment recommendation for you, they merely show which ETFs from the universe I track are falling within the specified guidelines.
All linked charts above are courtesy of Bloomberg via ZeroHedge.
Contact Ulli