
ETF Tracker StatSheet
You can view the latest version here.
FADING INTO THE WEEKEND
- Moving the markets
Even a better-than-expected jobs report (678k gained vs. expectations of 423k) was not enough to compete with the negative overhang of the geopolitical environment, as the Russia-Ukraine skirmish continued unabated, despite encouraging attempts on both sides to schedule meetings.
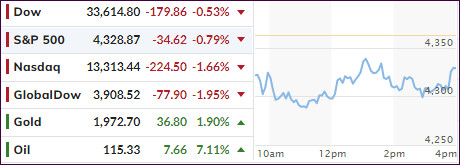
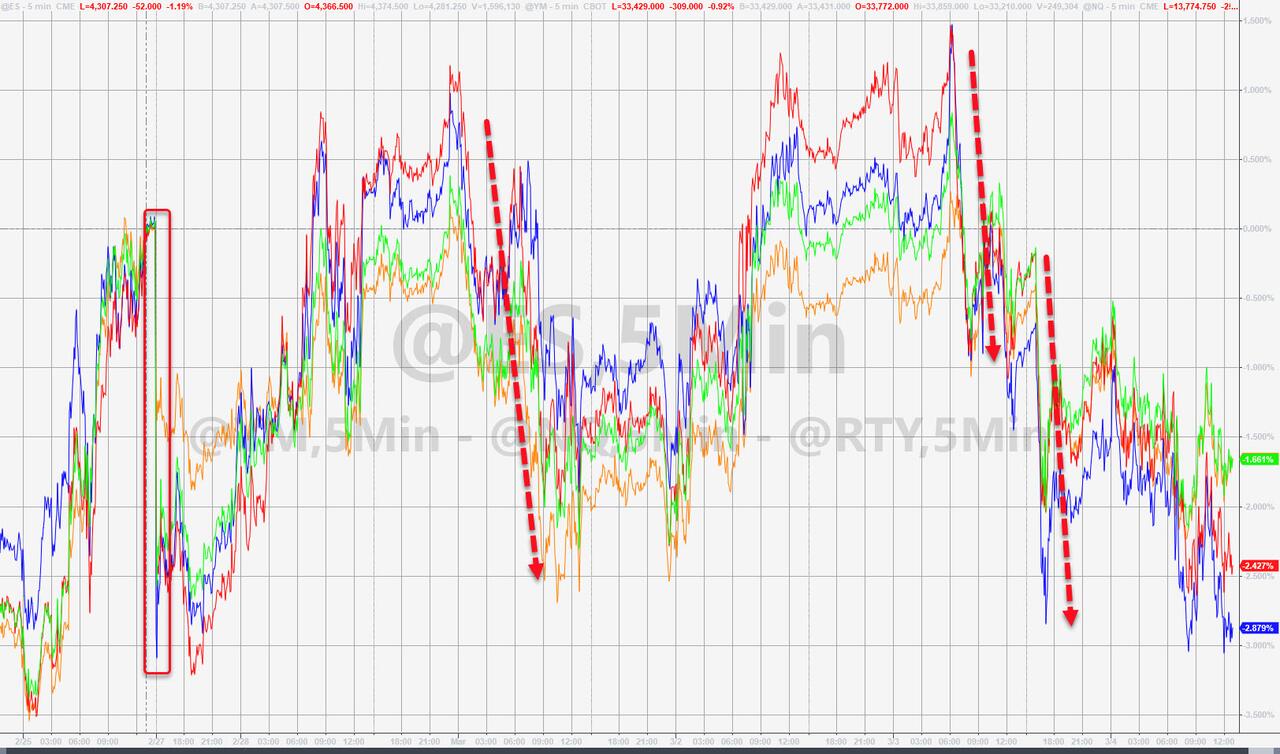
It’s not my job to discuss the Ukraine media headline euphoria but focus on the market fallout. While the initial losses, showing the Dow down 500 points, were sharply reduced by the time the closing bell rang, the outcome was still bearish with the Dow now having scored its fourth straight losing week.
MSM will now try to blame the domestic and global economic conditions on the Ukraine crisis, but keep in mind that slow growth, rising prices, and supply chain issues have plagued us long before said crisis came into the picture. However, negative supply shocks will take things to a new level and move us into uncharted territory.
MN Gordon from the EconomicPrism.com summed up like this:
There are not only oil supply shocks to contend with. There are also food supply shocks…and broken supply chains.
He also succinctly pointed out Fed head Powell’s dilemma:
For Powell, the task at hand this week was twofold. First, demonstrate the central bank would be taking measures to control inflation. Second, show Wall Street the Fed still has its back.
Thus, Powell went middle of the road. He’ll be proposing a 25-basis point rate hike at the upcoming FOMC meeting.
“We’re going to use our tools, and we’re going to get this done,” said Powell to the Senate Banking Committee.
In other words, he’s effectively doing nothing to fight inflation.
What gives? Is this some kind of joke? How’s a 25-basis point rate hike supposed to rein in inflation that’s officially raging at 7.5 percent?
Clearly, Powell’s pivot is a pivot to nowhere. High consumer price inflation is here to stay.
This accurately assesses the current situation with the open-ended question being: Can markets really see this as a bullish environment long term?
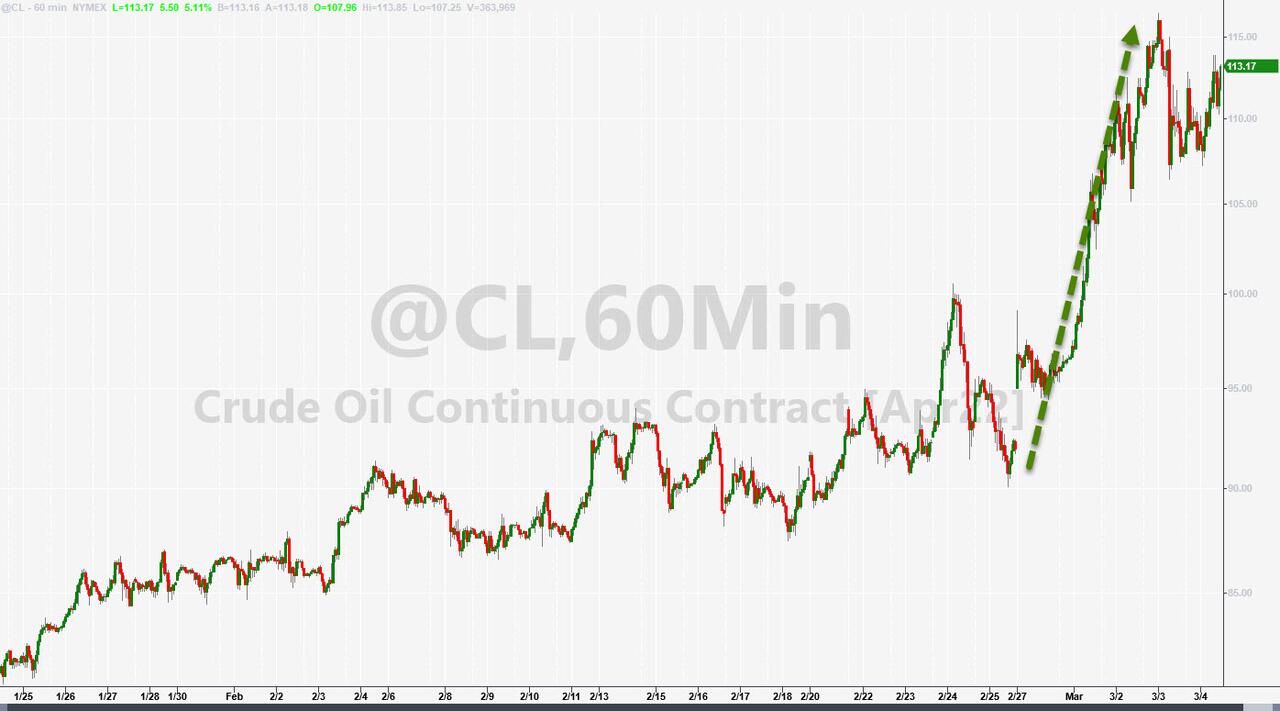
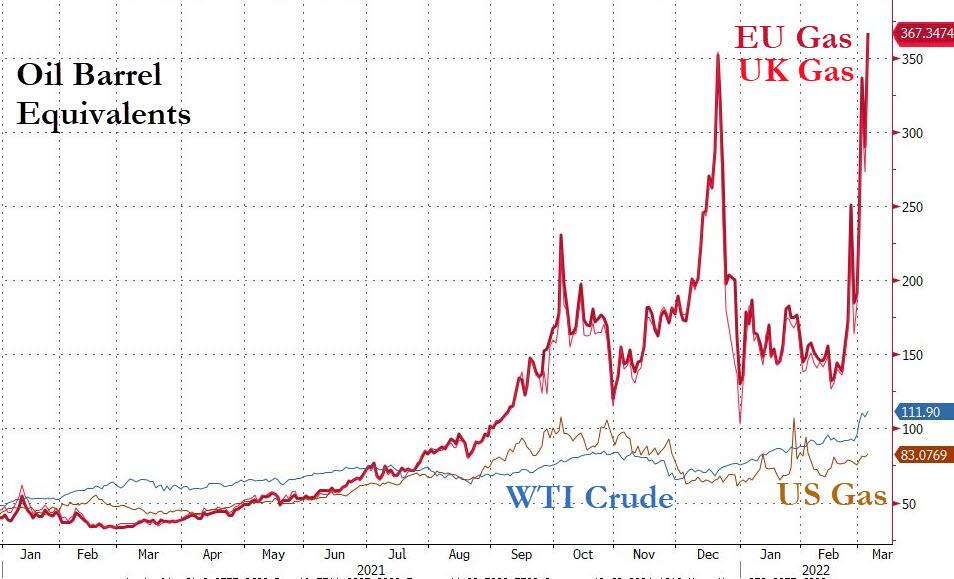
Crude oil continued its march higher by gaining 6.58% on the session to close a shade under $115. Europe not only fared the worst in the equity department with their indexes scoring the worst week since March 2020, but their energy costs exploded to a record high.
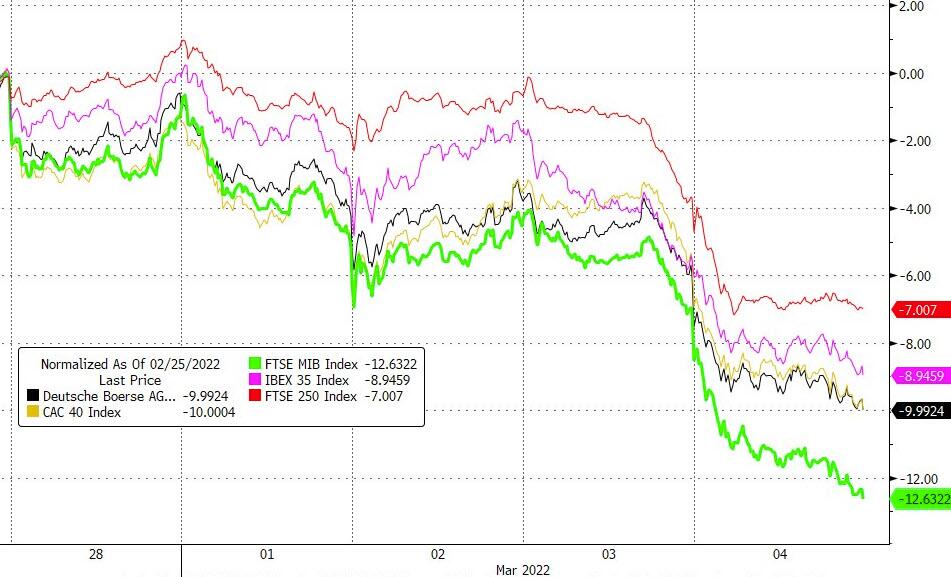
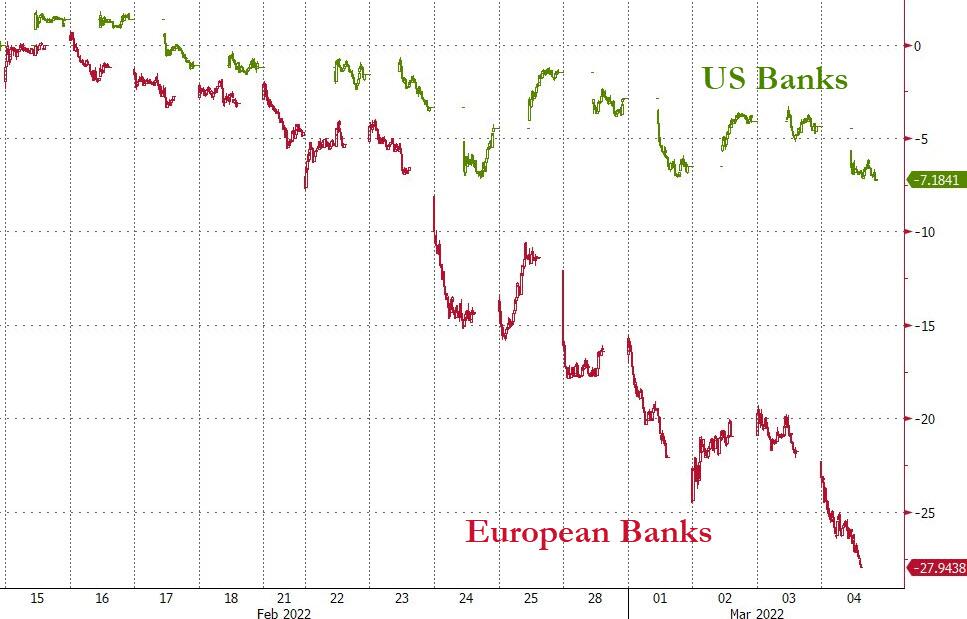
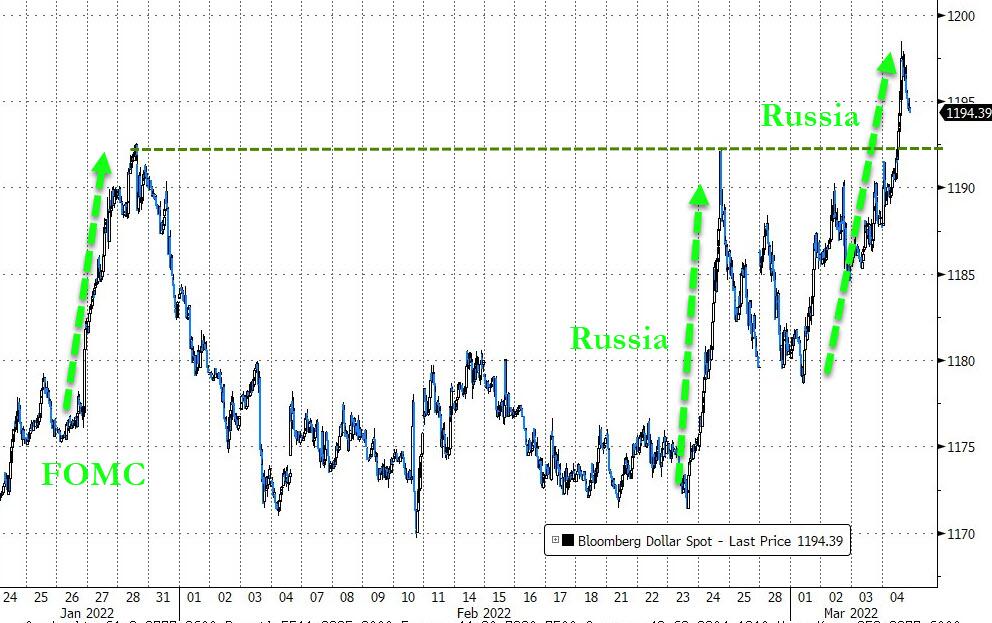
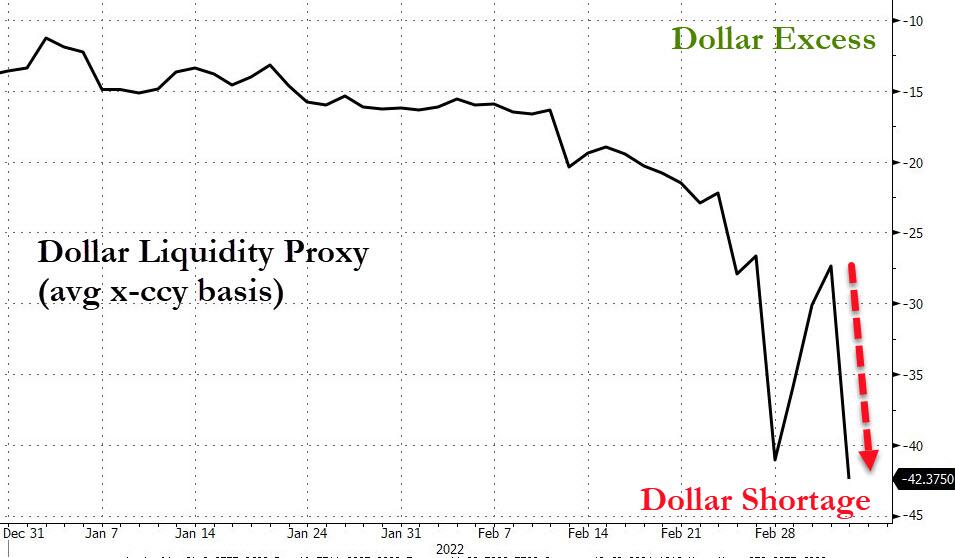
And it did not end there. While US Banks showed weakness, it was nothing compared to their European cousins, which imitated a swan dive. The US Dollar benefited by being perceived as a haven of safety, as dollar liquidity problems ran rampant.
Helping my favorite commodity ETF to add an astounding 4.21% on the day was the fact that Bloomberg’s Spot commodity index saw not only its biggest jump since September 1974 but also closing at a record new high.
Gold followed suit and added another 1.93% to close at $1,973.
There is chaos in all markets, and I am surprised how well domestic equities have held up—so far.
2. ETFs in the Spotlight
In case you missed the announcement and description of this section, you can read it here again.
It features some of the 10 broadly diversified domestic and sector ETFs from my HighVolume list as posted every Saturday. Furthermore, they are screened for the lowest MaxDD% number meaning they have been showing better resistance to temporary sell offs than all others over the past year.
The below table simply demonstrates the magnitude with which these ETFs are fluctuating above or below their respective individual trend lines (%+/-M/A). A break below, represented by a negative number, shows weakness, while a break above, represented by a positive percentage, shows strength.
For hundreds of ETF choices, be sure to reference Thursday’s StatSheet.
For this just closed-out domestic “Buy” cycle, here’s how some of our candidates have fared:

Click image to enlarge.
Again, the %+/-M/A column above shows the position of the various ETFs in relation to their respective long-term trend lines, while the trailing sell stops are being tracked in the “Off High” column. The “Action” column will signal a “Sell” once the -12% point has been taken out in the “Off High” column, which has replaced the prior -8% to -10% limits.
3. Trend Tracking Indexes (TTIs)
Our TTIs slipped again, with the Domestic one currently holding up better than the International one.
This is how we closed 03/04/2022:
Domestic TTI: -0.78% below its M/A (prior close -0.13%)—Sell signal effective 02/24/2022.
International TTI: -3.84% below its M/A (prior close -2.01%)—Buy signal effective 07/22/2020.
Disclosure: I am obliged to inform you that I, as well as my advisory clients, own some of the ETFs listed in the above table. Furthermore, they do not represent a specific investment recommendation for you, they merely show which ETFs from the universe I track are falling within the specified guidelines.
All linked charts above are courtesy of Bloomberg via ZeroHedge.
———————————————————-
WOULD YOU LIKE TO HAVE YOUR INVESTMENTS PROFESSIONALLY MANAGED?
Do you have the time to follow our investment plans yourself? If you are a busy professional who would like to have his portfolio managed using our methodology, please contact me directly or get more details.
Contact Ulli