

- Moving the markets
Sometimes you just simply must step back and watch in awe how current markets trade like a penny stock when it comes to volatility.
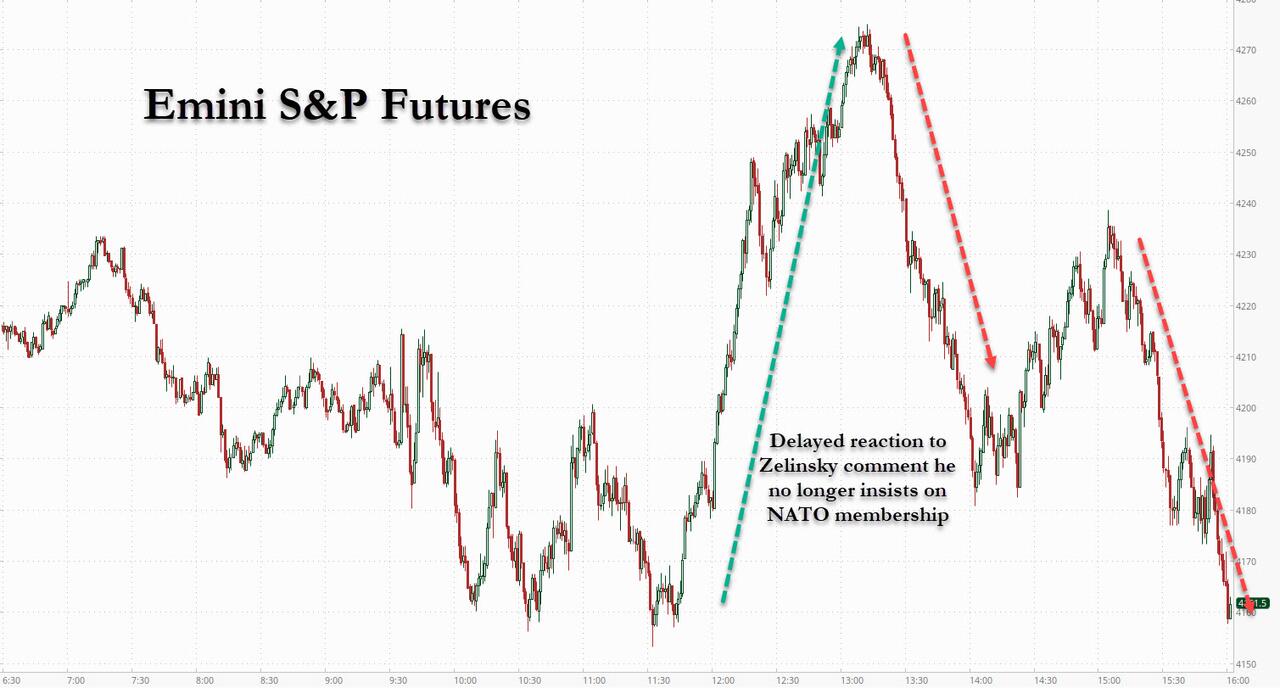
Yesterday, equities were simply spanked all day, which continued this morning as the Dow sank some 200 points and bounced around below its unchanged line. A sudden burst of buying pulled the indexes out of their slump, and the Dow soared into the plus by almost 600 points.
The bulls were cheering but were quickly disappointed as this surge got wiped out within 30 minutes, after which another rebound failed assuring a red close for the major indexes. Riding a bucking bronco might provide more directional certainty than current market behavior.
To me, this type of volatility seems to occur mainly at major inflection points meaning once a bearish trend turns bullish and vice versa. Year-to-date, we have seen nothing but aimless meandering, with the bearish theme being confirmed after our Domestic Sell signal became effective on 2/24/22.
ZeroHedge summed up today’s craziness like this:
But while everyone has an opinion about what comes next, the truth is that nobody knows what’s really going on as JJ Kinahan, chief market strategist at TD Ameritrade said: “I don’t think the market’s ignoring anything at the moment, to be honest with you. In fact, everything is hyper-sensitive as to what may happen. It’s so fluid and we will see what happens. It’s really tough to predict day-to-day.”
That said, broken markets continue, and the biggest shock overnight was the continued short squeeze in Nickel, which exploded to over $100,000, up more than 250% on the day, before being halted by the LME amid a relentless margin call frenzy which left at least one Chinese tycoon billions poorer.
The flight to safety was on with the main beneficiary being gold, as the precious metal added another +3.04% to close at $2,056. You might have expected to see lower bond yields during these times of stress, but that did happen because yields rallied with the 10-year closing at 1.85%.
Again, this is the time to be exposed to selected sector funds, especially those that take advantage of the current global economic dysfunction.
2. ETFs in the Spotlight
In case you missed the announcement and description of this section, you can read it here again.
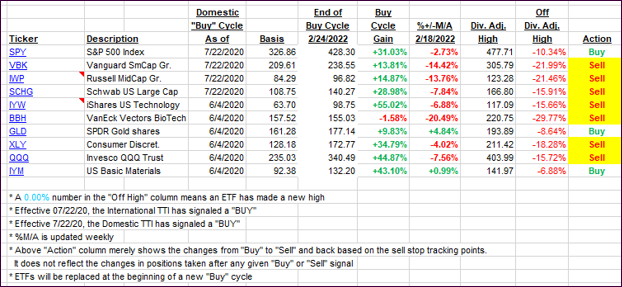
It features some of the 10 broadly diversified domestic and sector ETFs from my HighVolume list as posted every Saturday. Furthermore, they are screened for the lowest MaxDD% number meaning they have been showing better resistance to temporary sell offs than all others over the past year.
The below table simply demonstrates the magnitude with which these ETFs are fluctuating above or below their respective individual trend lines (%+/-M/A). A break below, represented by a negative number, shows weakness, while a break above, represented by a positive percentage, shows strength.
For hundreds of ETF choices, be sure to reference Thursday’s StatSheet.
For this just closed-out domestic “Buy” cycle, here’s how some of our candidates have fared:
Click image to enlarge.
Again, the %+/-M/A column above shows the position of the various ETFs in relation to their respective long-term trend lines, while the trailing sell stops are being tracked in the “Off High” column. The “Action” column will signal a “Sell” once the -12% point has been taken out in the “Off High” column, which has replaced the prior -8% to -10% limits.
3. Trend Tracking Indexes (TTIs)
Our TTIs followed the bearish theme and closed lower.
This is how we closed 03/08/2022:
Domestic TTI: -4.21% below its M/A (prior close -3.52%)—Sell signal effective 02/24/2022.
International TTI: -6.13% below its M/A (prior close -5.95%)—Sell signal effective 03/08/2022.
Disclosure: I am obliged to inform you that I, as well as my advisory clients, own some of the ETFs listed in the above table. Furthermore, they do not represent a specific investment recommendation for you, they merely show which ETFs from the universe I track are falling within the specified guidelines.
All linked charts above are courtesy of Bloomberg via ZeroHedge.
Contact Ulli