Another “Hope” Rally Bites The Dust

Ulli Market Commentary Contact

[Chart courtesy of MarketWatch.com]

  1. Moving the markets

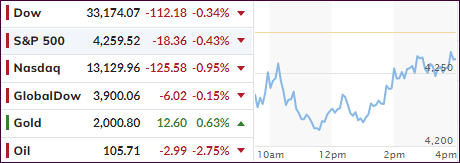
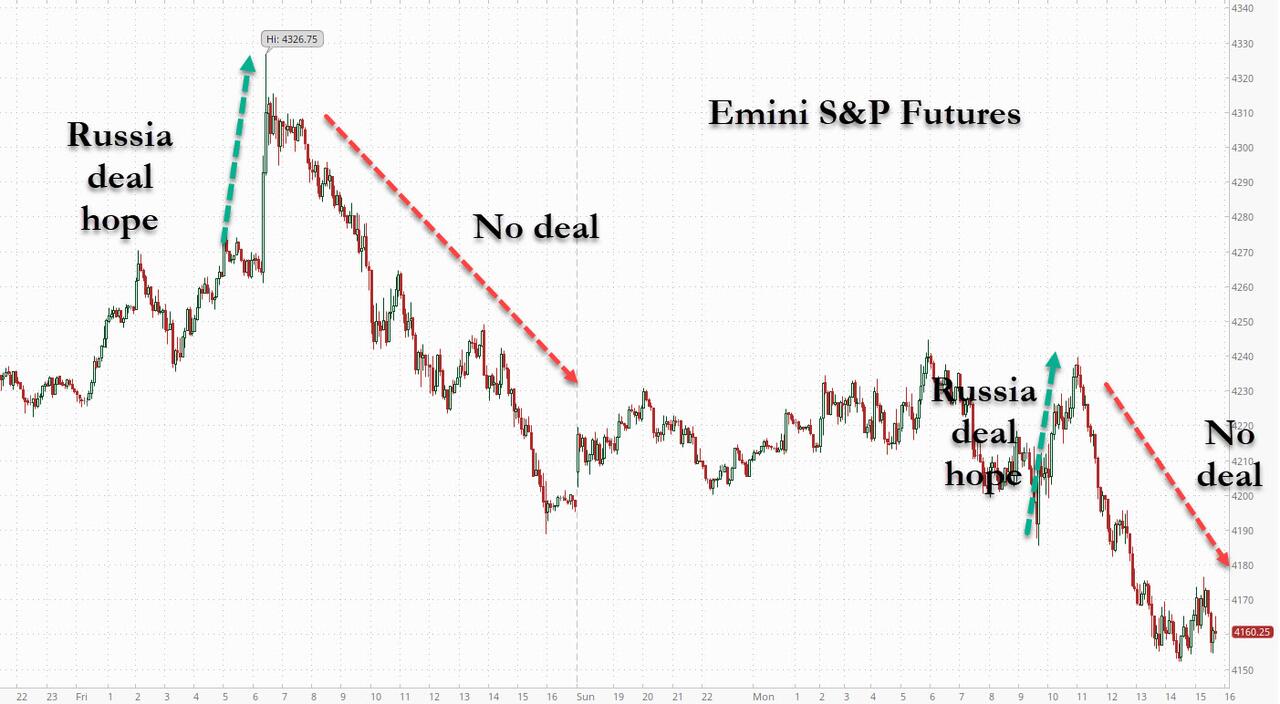
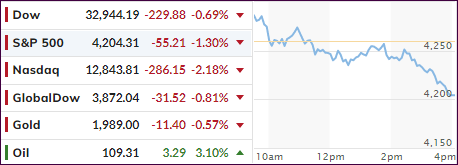
As we’ve seen recently with almost regular frequency, early rallies suddenly reversed, got wiped out and turned into losses. Today was no exception when a 300-point surge in the Dow hit the skids, and south we went. The Nasdaq took the biggest hit with a -2.04% loss.

Oil, commodities, and gold gave back recent gains even as uncertainty reigned yet hope of a possible oil trading arrangement by an American company with Venezuela (yes, that sanctioned Venezuela) was said to potentially provide relief.

Be that as it may, markets overall continued to be in disarray with a crazy week on deck, as ZeroHedge pointed out:

A Fed rate hike, a Russian default, a meeting between the US and China, even more sanctions against Russia, the first double-digit (10%) PPI print in decades, a big drop in retail sales, a freak surge in covid across China, oh and a $3.3 trillion notional option expiration on Friday and all happening with liquidity at record lows. Yes, this week will be insane.

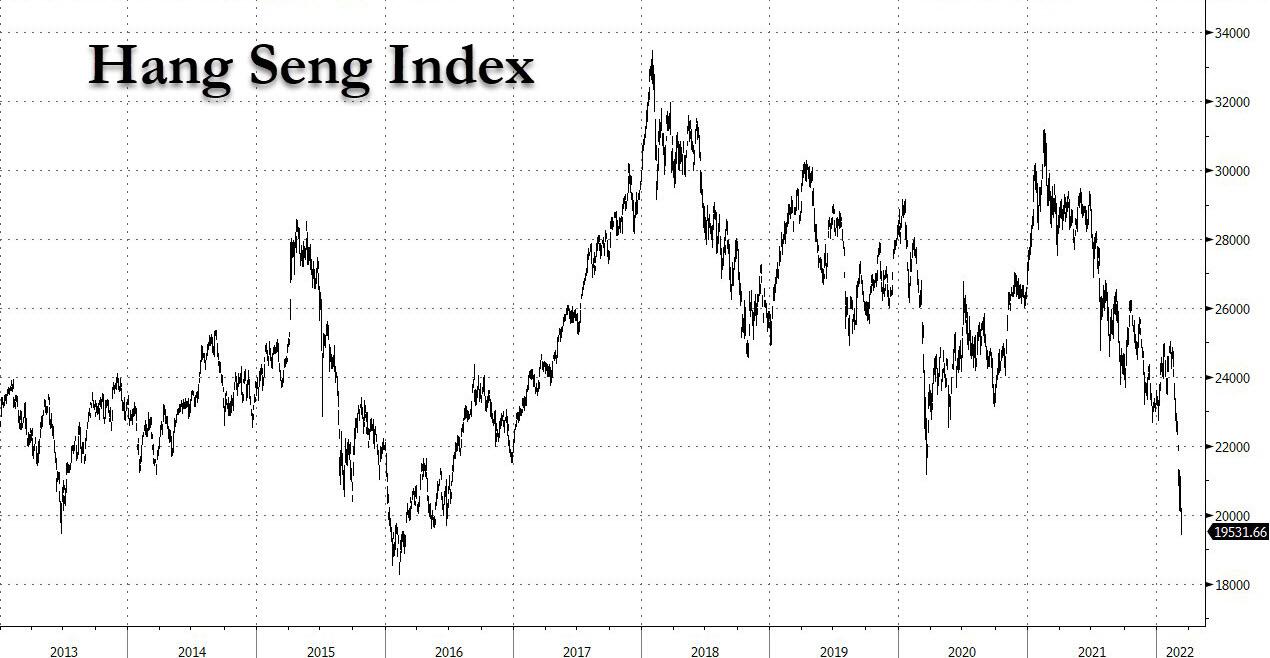
China’s stock market had its worst day in 6 years, in part due to its chummy relationship with Russia, a surge in Covid cases, including a lockdown, and regulatory issues.

Apple took a hit and dropped below its 200-day M/A, as traders worried about the shutdown of the Shenzhen Foxconn factory, which could lead to another supply chain shock for the world’s largest company.

For sure, gold turned out not to be a “safe haven”, at least not for today, as the precious metal got spanked and lost -1.5%.

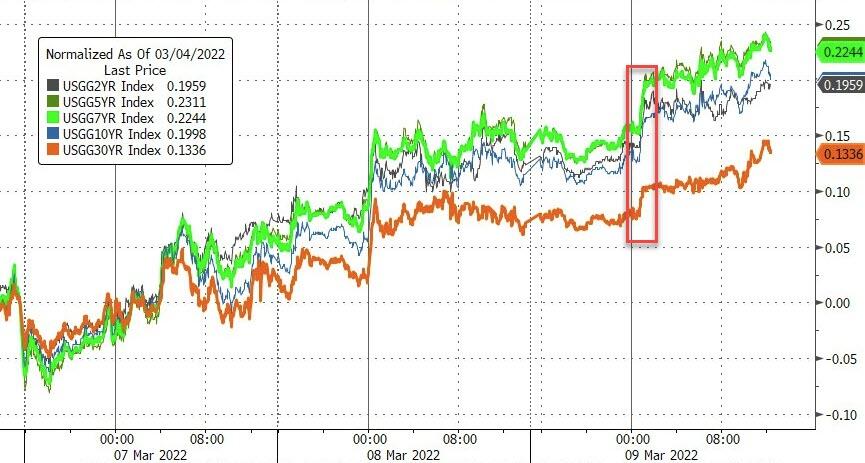
Bond yields soared, as prices crashed, with the 10-year rallying over 14 bps to close at 2.14%, ahead of the Fed meeting in 2 days. The markets are now expecting 7 rate hikes, due to the inflation tsunami which, if implemented, will translate into enormous distress for stocks going forward.  

Read More
ETFs On The Cutline – Updated Through 03/11/2022

Ulli ETFs on the Cutline Contact

Below, please find the latest High-Volume ETF Cutline report, which shows how far above or below their respective long-term trend lines (39-week SMA) my currently tracked ETFs are positioned.

This report covers the HV ETF Master List from Thursday’s StatSheet and includes 312 High Volume ETFs, defined as those with an average daily volume of more than $5 million, of which currently 64 (last week 78) are hovering in bullish territory. The yellow line separates those ETFs that are positioned above their trend line (%M/A) from those that have dropped below it.

Take a look:                                                                   

The HV ETF Master Cutline Report

In case you are not familiar with some of the terminology used in the reports, please read the Glossary of Terms. If you missed the original post about the Cutline approach, you can read it here.

ETF Tracker Newsletter For March 11, 2022

Ulli Market Commentary Contact

ETF Tracker StatSheet          

You can view the latest version here.

REALITY DOMINATES OPTIMISM

[Chart courtesy of MarketWatch.com]

  1. Moving the markets

Optimistic traders, who followed the latest firehose of news headlines and pushed the major indexes higher at the opening, had to face reality eventually, because actual happenings erased the early enthusiasm.

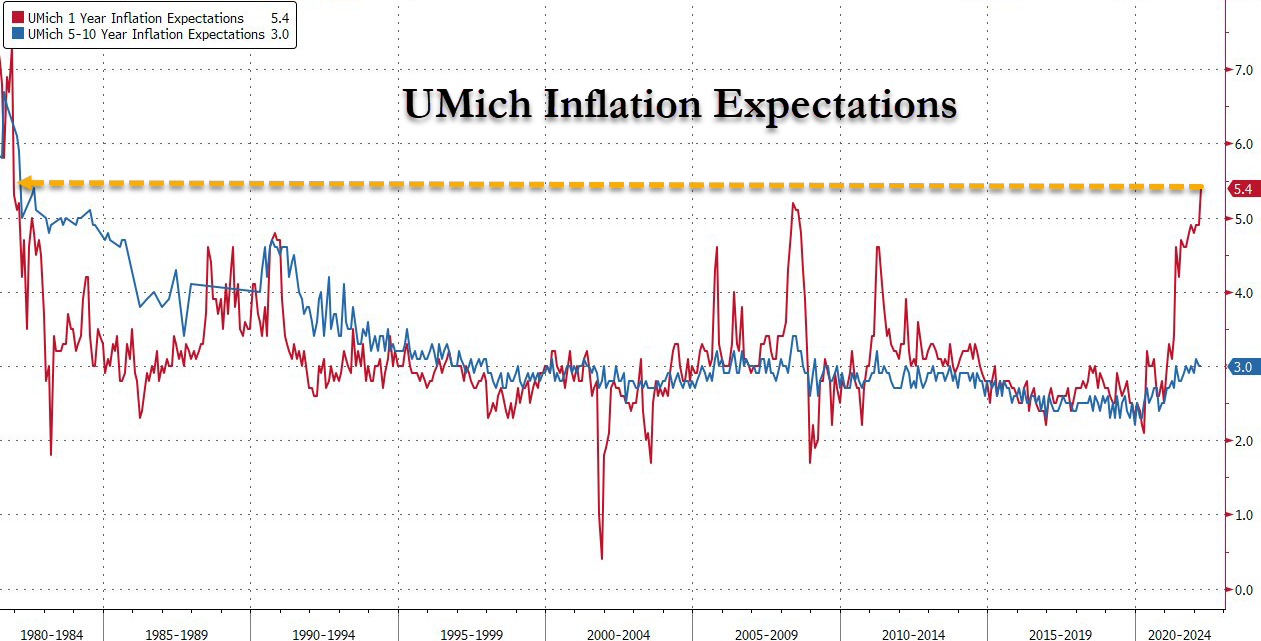
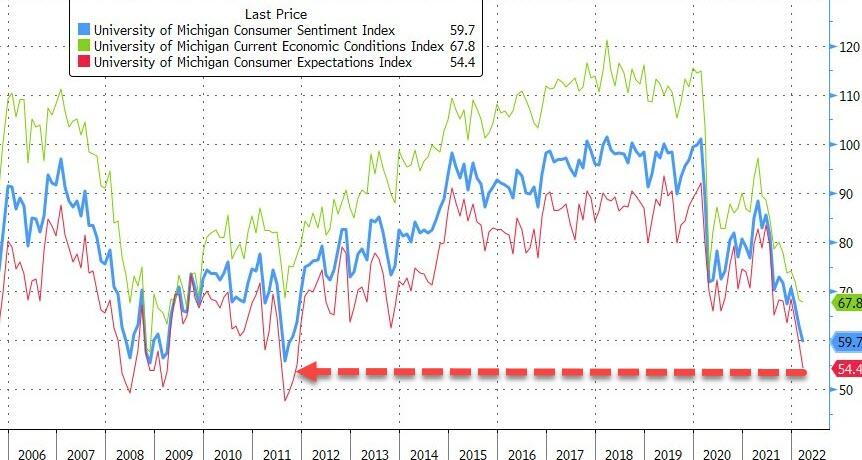
Not helping matters was the fact that the number of unhappy Americans had increased, as measured by the US Sentiment index. Joined by current economic conditions and inflation expectations, the numbers dropped to lows last seen in 2011, as this chart by Bloomberg shows.

That translated into another early rally biting the dust with the Dow notching its 5th straight week of losses due to the Russia-Ukraine war uncertainties keeping the bears in charge.

Added MarketWatch:

Russian President Vladimir Putin said Friday “certain positive shifts” have occurred in the talks between the Kremlin and Ukraine, however, a ceasefire has not been negotiated. Meanwhile, President Volodymyr Zelenskyy reportedly said Ukraine has reached a “strategic turning point” in its war with Russia.

In other words, nothing has been resolved and the adage that “hope is not an investment strategy” was validated again. For the week, the Dow lost 2%, the S&P 500 dropped 2.9%, and the Nasdaq fared the worst by giving back 3.5%.

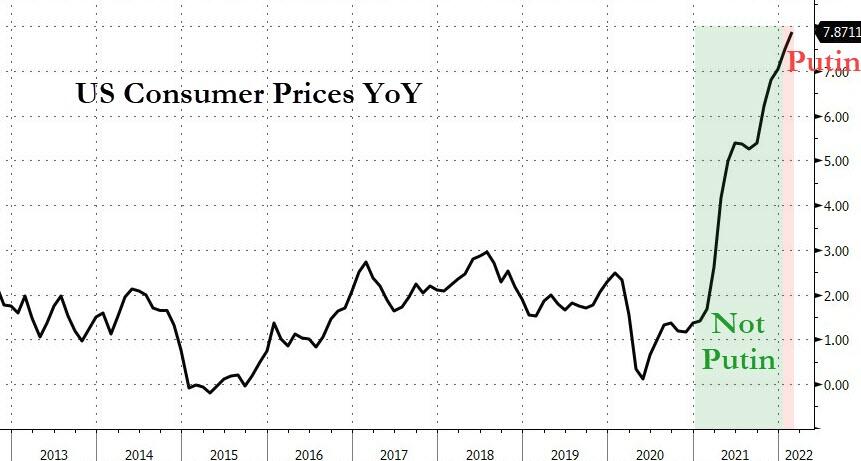
Some biased news reports are now pushing the narrative that YoY consumer price increases were Putin’s fault, a notion that was quickly dismissed and supported by this chart.

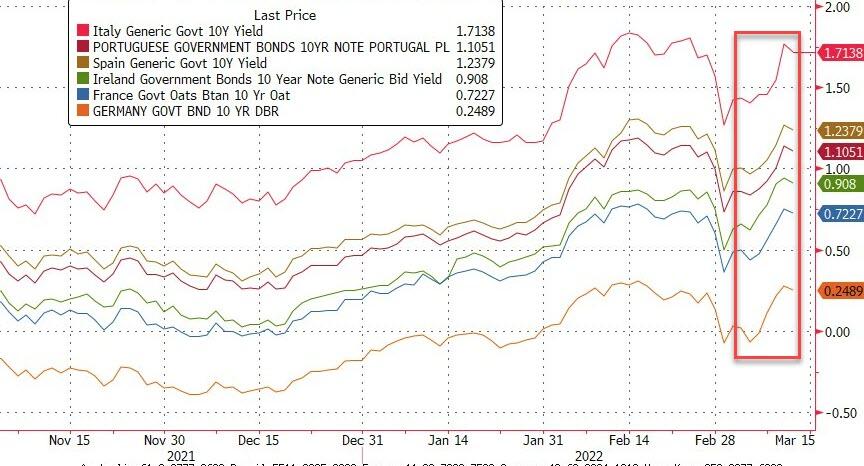
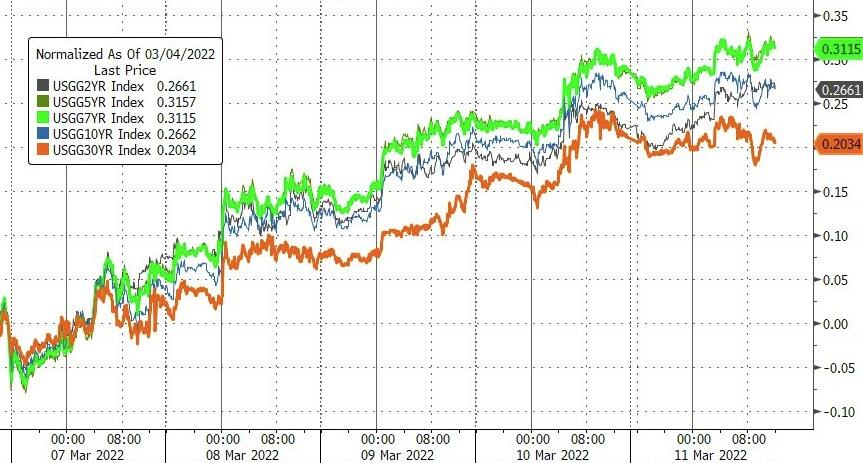
While bond yields soared in Europe all week, the situation was not much better here in the US, where yields as well spiked higher thereby causing bond prices to crumble. This turned into a nightmare for those holding bonds to offset equity weakness, a theory that has bit the dust on many occasions in the recent past.

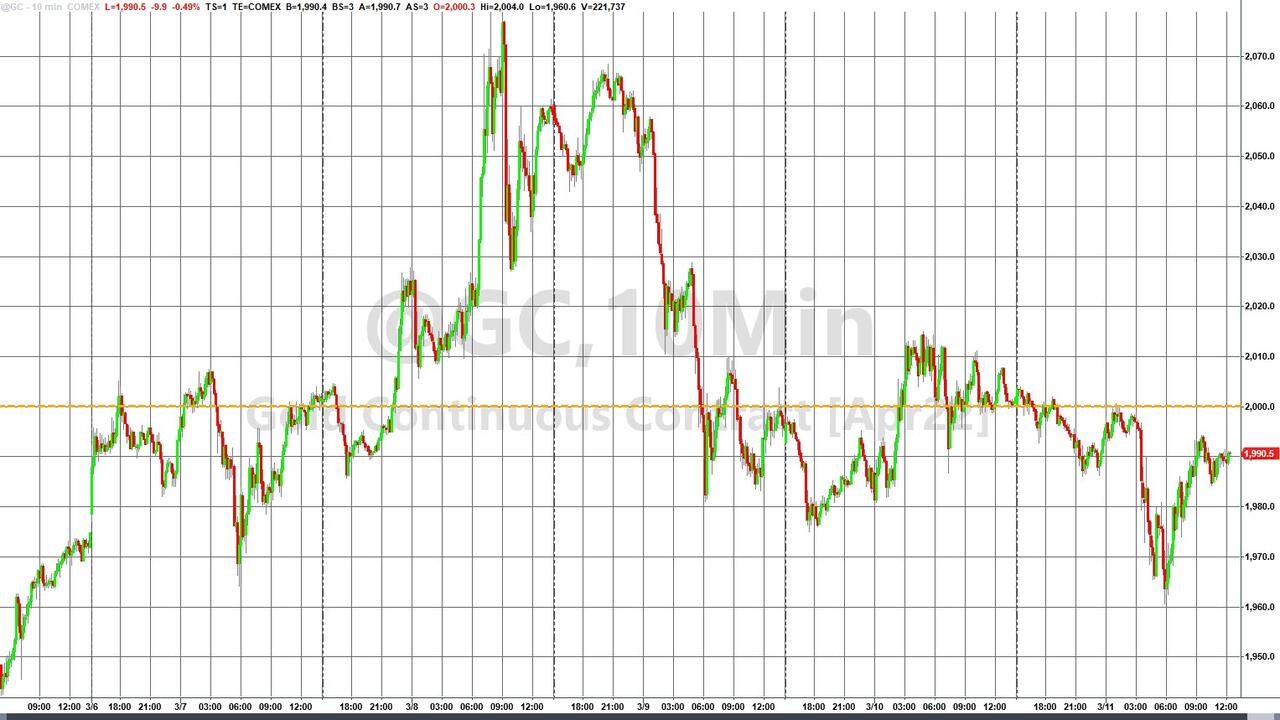
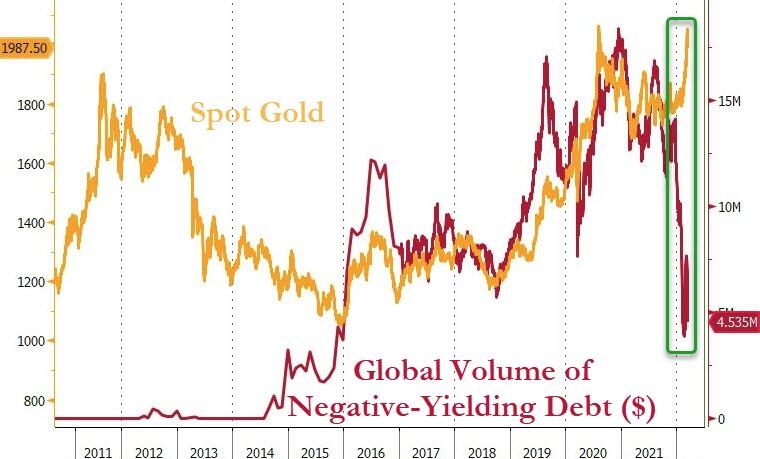
Gold slipped early on, rebounded but still lost its $2k level by a small margin, but it remains the real “safe haven” once again, as negative yielding debt worldwide is simply not the place to be.

After all, would you loan someone $100, with him promising to pay you back $98? That’s what negative yielding debt translates into.      

Read More

Weekly StatSheet For The ETF Tracker Newsletter – Updated Through 03/10/2022

Ulli ETF StatSheet Contact

ETF Data updated through Thursday, March 10, 2022

Methodology/Use of this StatSheet:

1. From the universe of over 1,800 ETFs, I have selected only those with a trading volume of over $5 million per day (HV ETFs), so that liquidity and a small bid/ask spread are assured.

2. Trend Tracking Indexes (TTIs)

Buy or Sell decisions for Domestic and International ETFs (section 1 and 2), are made based on the respective TTI and its position either above or below its long-term M/A (Moving Average). A crossing of the trend line from below accompanied by some staying power above constitutes a “Buy” signal. Conversely, a clear break below the line constitutes a “Sell” signal. Additionally, I use an 12% trailing stop loss on all positions in these categories to control downside risk.

3. All other investment arenas do not have a TTI and should be traded based on the position of the individual ETF relative to its own respective trend line (%M/A). That’s why those signals are referred to as a “Selective Buy.” In other words, if an ETF crosses its own trendline to the upside, a “Buy” signal is generated. Here too, I recommend trailing sell stop of 12%, or less, depending on your risk tolerance.

If you are unfamiliar with some of the terminology, please see Glossary of Terms and new subscriber information in section 9.     

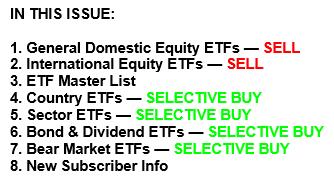
1. DOMESTIC EQUITY ETFs: SELL — since 02/24/2022

Click on chart to enlarge

Our main directional indicator, the Domestic Trend Tracking Index (TTI-green line in the above chart) has broken below its long-term trend line (red) by -2.37% and is now in the “SELL” mode.

Read More

Swinging Wildly

Ulli Market Commentary Contact

[Chart courtesy of MarketWatch.com]

  1. Moving the markets

Another crazy day on Wall Street had equities swinging wildly, although with reduced magnitude. In the end, the major indexes crawled back but failed to reach their respective unchanged lines.

Every directional turn appears to be headline driven, as the bulls and bears continue to slug it out. Failed peace talks between Russia and the Ukraine caused the potential global economic fallout to move to front and center again thereby putting a damper on the bullish meme.

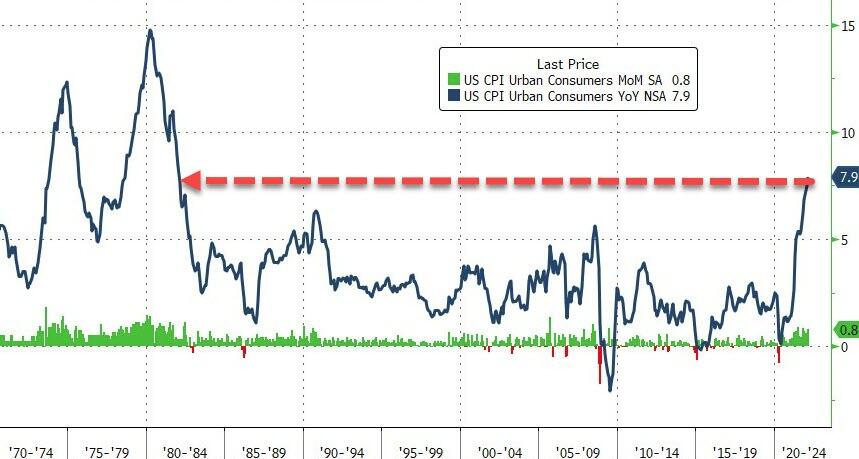
Consumer prices rose at their fastest pace in over 40 years, as ZH reported, with the headline print coming in at the expected +7.9% YoY. That is the highest reading since January 1982 and is also the 21st straight month of increases in consumer prices. So much for inflation being transitory.

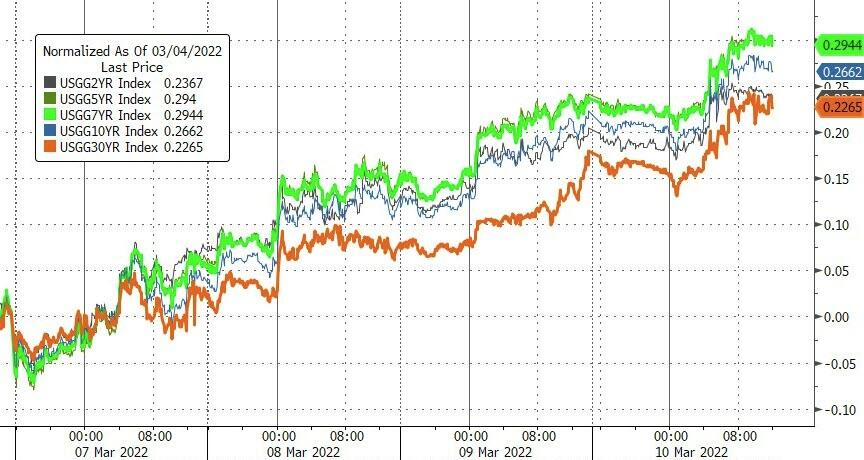
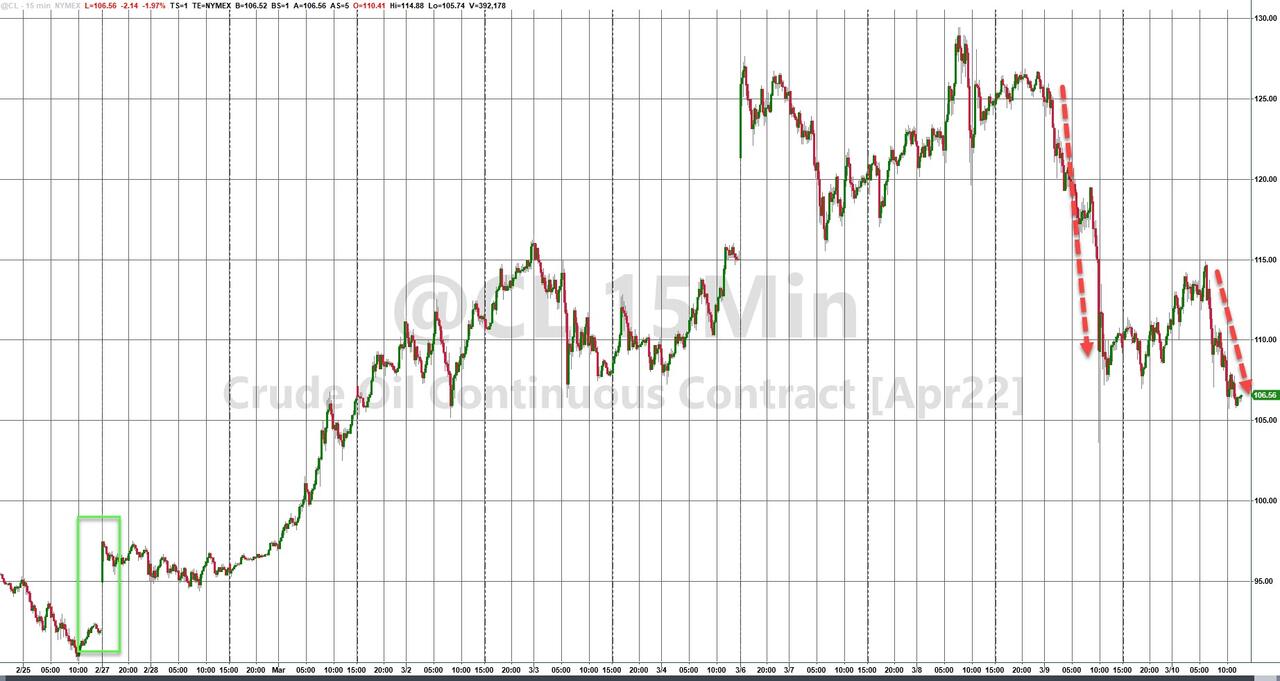
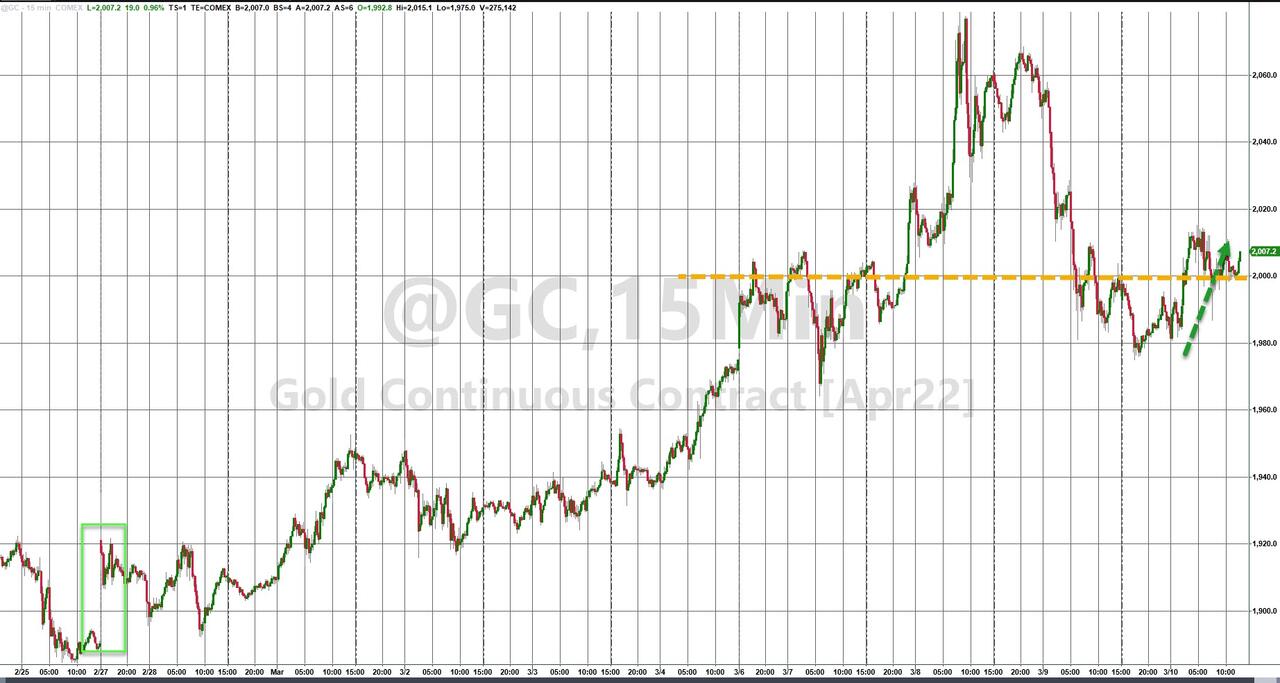
Bonds extended their losses, as yields spiked, with the 10-year again approaching the 2% level. The US Dollar went sideways but surged into the close, Crude Oil slipped for the second day, but gold found some footing to recapture the $2k price level.   

Volatility is here to stay, which means wild rides on Wall Street may become the standard rather than the exception.

Read More

Equities Thrive—Oil And Commodities Dive

Ulli Market Commentary Contact

[Chart courtesy of MarketWatch.com]

  1. Moving the markets

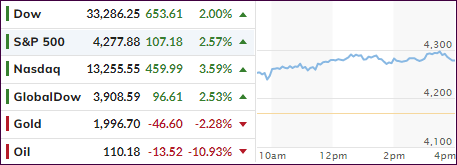
It had to happen eventually, and today was the day. After 4 days of taking a beating, equities finally found a reason to rally, as questionable as it may turn out to be.

One analyst linked it to the adage “buy the rumor, sell the fact,” but in this case it turned into “buy the Ukraine speculation, sell the lack of follow through,” however, we will have to wait and see if the latter part materializes.

Headlines went into overdrive with Bloomberg reporting this:

*AIDE TO ZELENSKIY SAYS UKRAINE READY FOR DIPLOMATIC SOLUTION

That was followed by some dampening of the initial euphoria:

*UKRAINE’S ZHOVKVA: WON’T TRADE `SINGLE INCH’ OF TERRITORIES

And finally, as ZH pointed out:

*UKRAINIAN AIDE: SEEK CLEAR RESPONSE TO EU APPLICATION

Which also seems like a dead end, because as JPMorgan said last night, “Ukraine is no longer insisting on NATO membership, though EU membership would give similar protections.”

Nevertheless, it was a session during which, no matter what happened, the bulls remained oblivious to anything bearish and made up for lost ground by recouping some of this week’s damages.

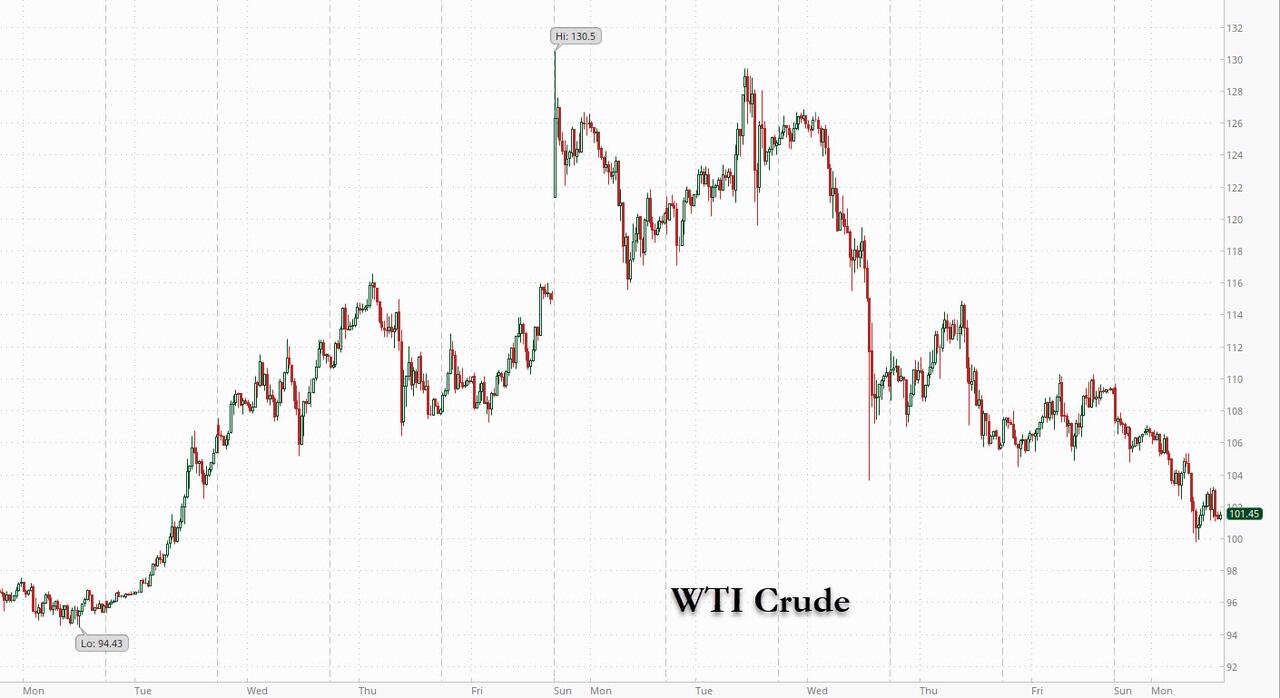
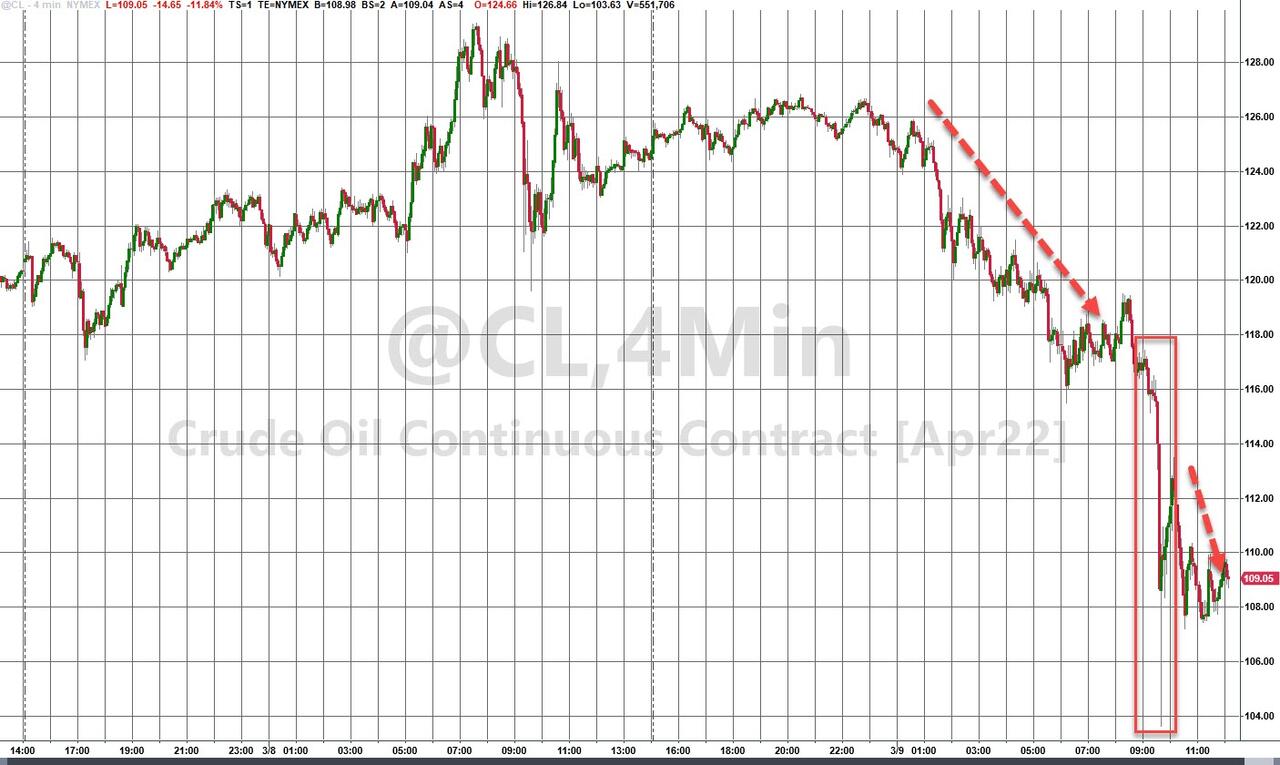
It was another wild ride, during which energy and commodities were hammered, after their recent bullish run, but both came off their intra-day lows by a strong margin. With higher oil prices and continued inflation, I expect this spanking to be a correction rather than a major directional trend change.

The dreaded “S” word, which I have repeatedly mentioned, remains in play with one hedge fund giant seeing it this way:

The way things are going now, $200 per barrel is a clear possibility, according to Jeffrey Gundlach from investment firm DoubleLine. Speaking to TIFIN, Gundlach said that oil is on its way to $200, and the Fed may be pressed to raise rates while the country is going into a recession, which, he noted, had never been done before. Gundlach also said it was time to admit the U.S. was going into stagflation, and the latest increase in gas prices was only the beginning of the pain.

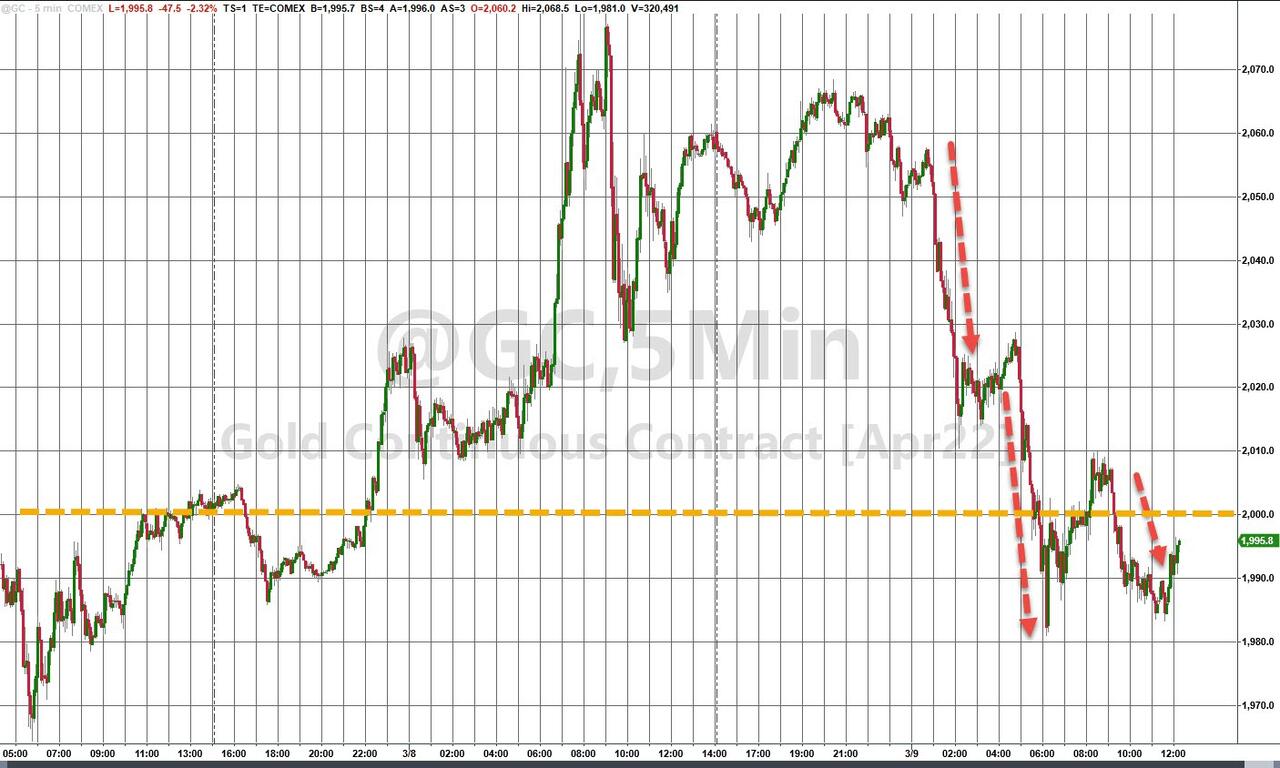
Safe havens like bonds were losers today, as yields spiked, while the recent performance hero, namely gold, was taken out to the barn and spanked, in process losing its $2k handle.  

The madness on Wall Street continues. The Fed will try to manage a soft economic landing, the chances of which are just as great as their past announcement that inflation is “transitory.”

Read More