
- Moving the markets
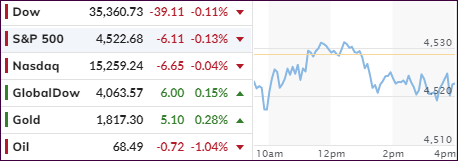
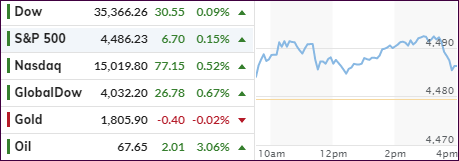
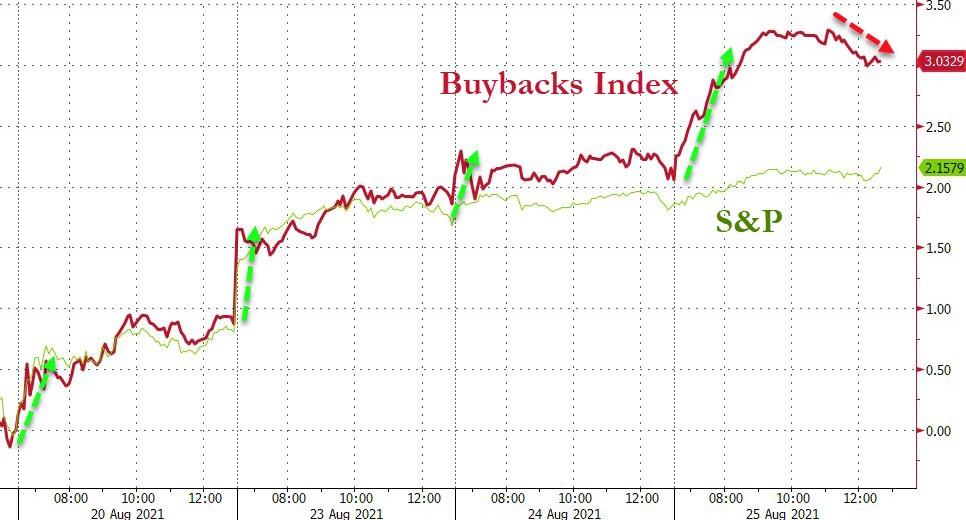
The major indexes managed to close the notoriously slow month of August on a whimper, but unscathed and with bullish momentum intact. It was a day of churning with the S&P 500 touching a new intraday high but then fading below its unchanged line.
For the month, all three of them came out ahead, led by the Nasdaq with a 4% gain, while the S&P 500 and Dow ended up with advances of 3% and 1.3% respectively.
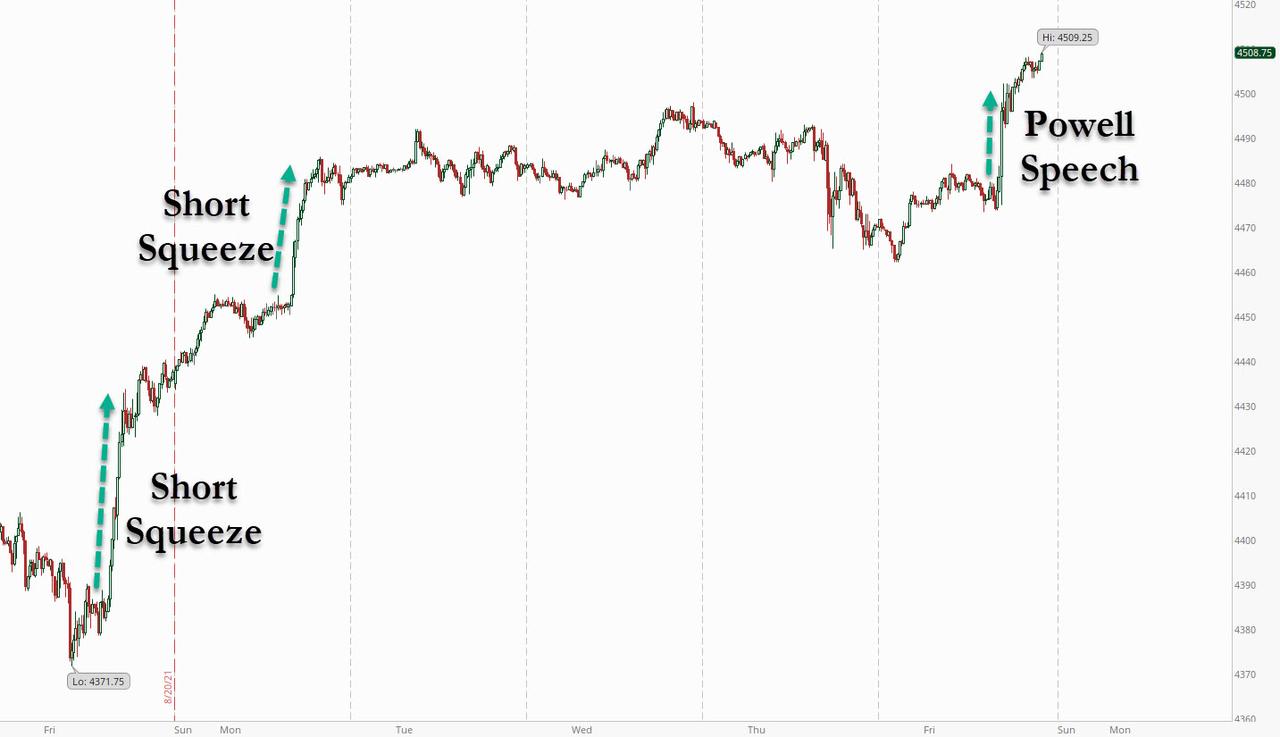
Earnings growth contributed to the bullish meme, assisted by continued loose Fed monetary policies, which were the main contributor to the S&P 500 scoring its 9th positive month in the last 10. The index also achieved its 53rd record close of 2021 just yesterday.
All this occurred in the face of oncoming headwinds in form of the Delta variant of Covid 19, which at times managed to cast doubt on the economic recovery. However, in the end, the Fed and its lack of serious taper talk and definitive action, as well as soothing words about the “transitory” effect of inflation, won out and kept the upward trend alive.
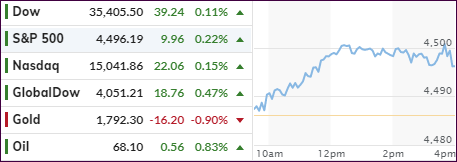
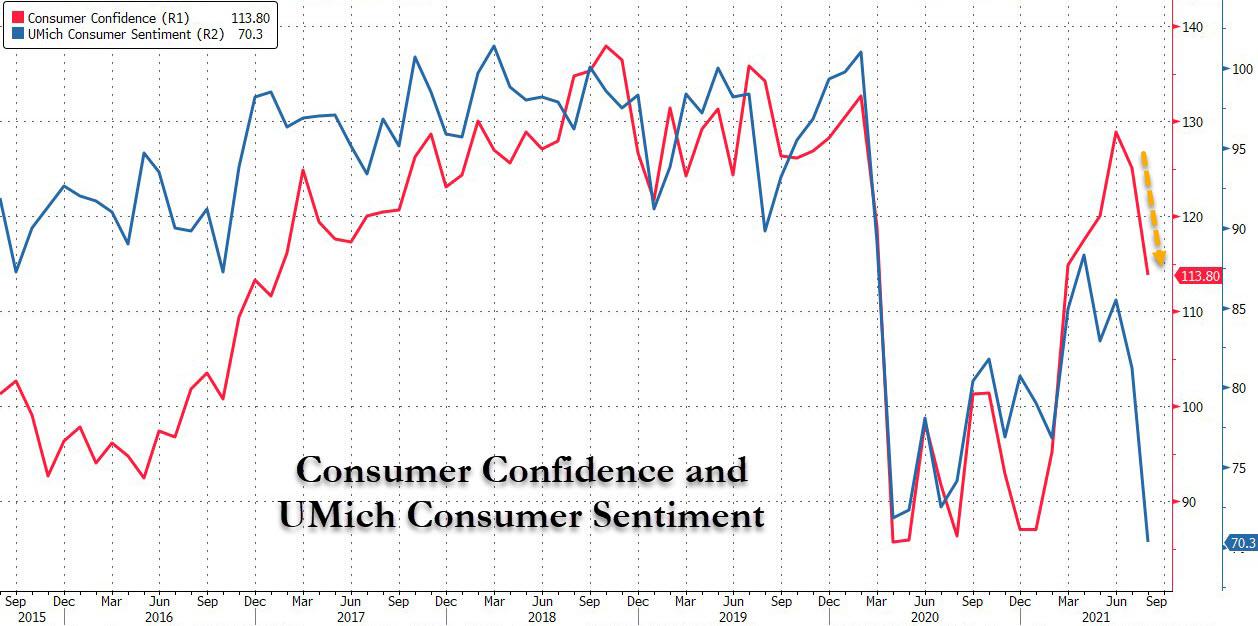
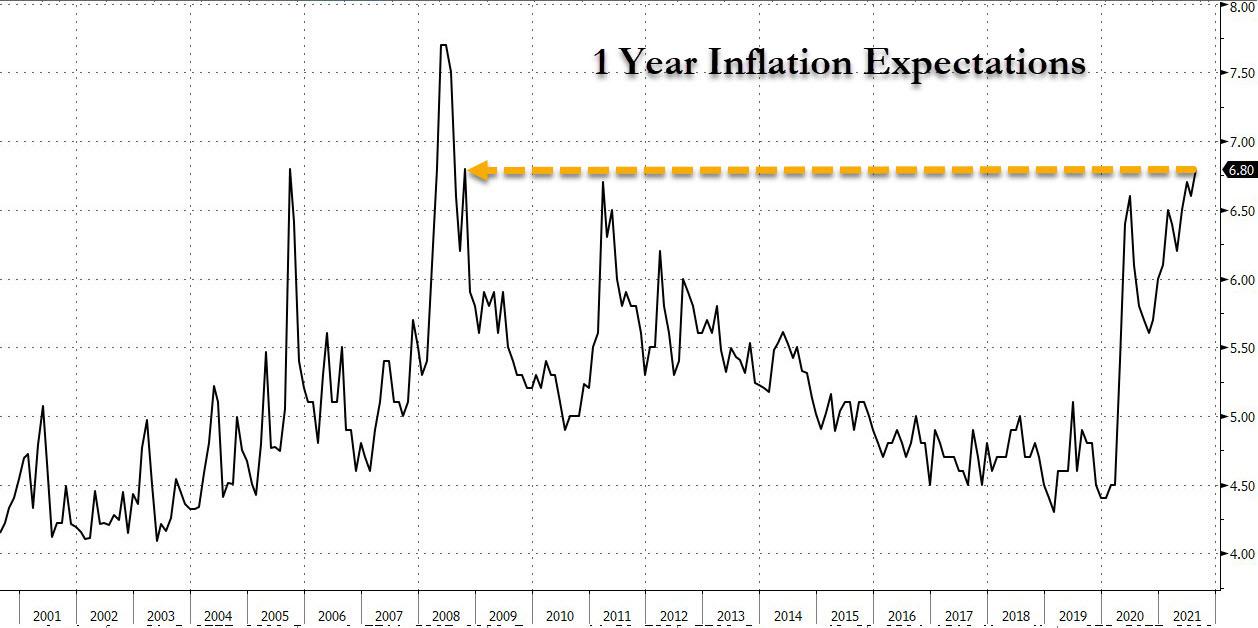
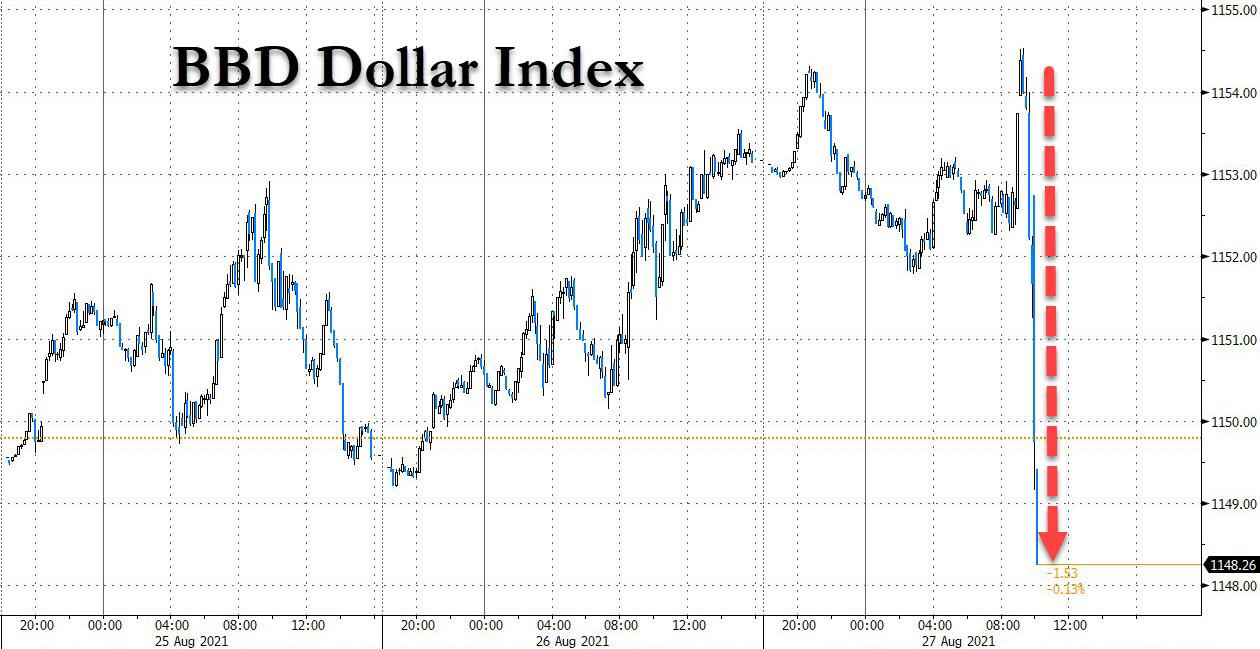
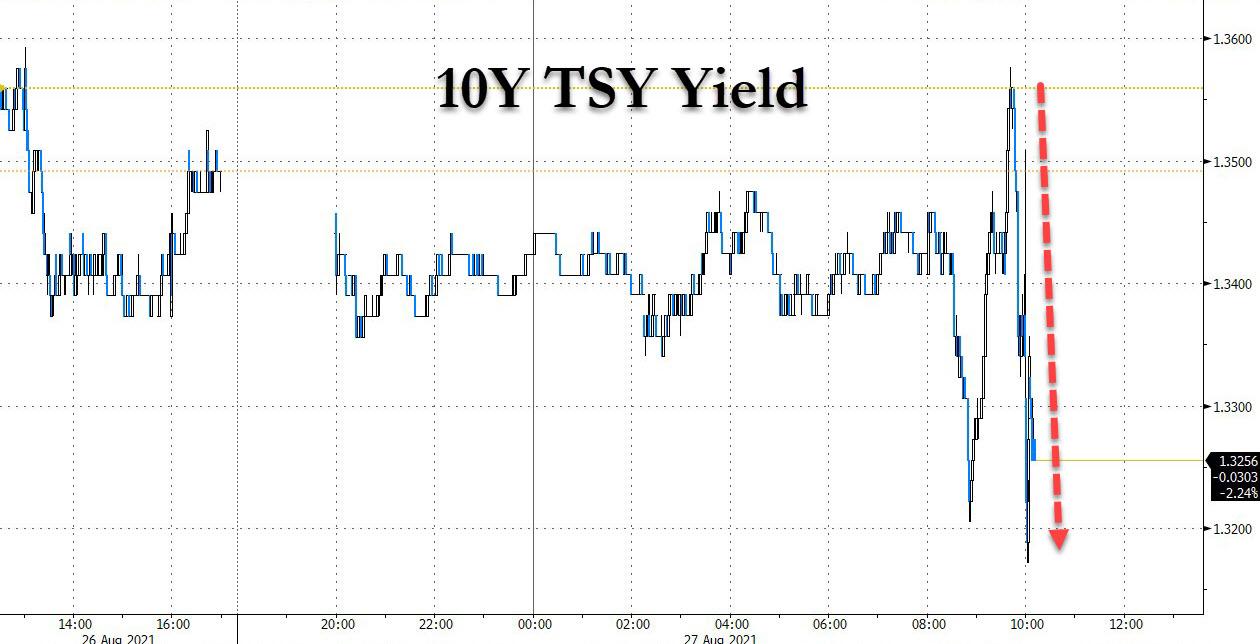
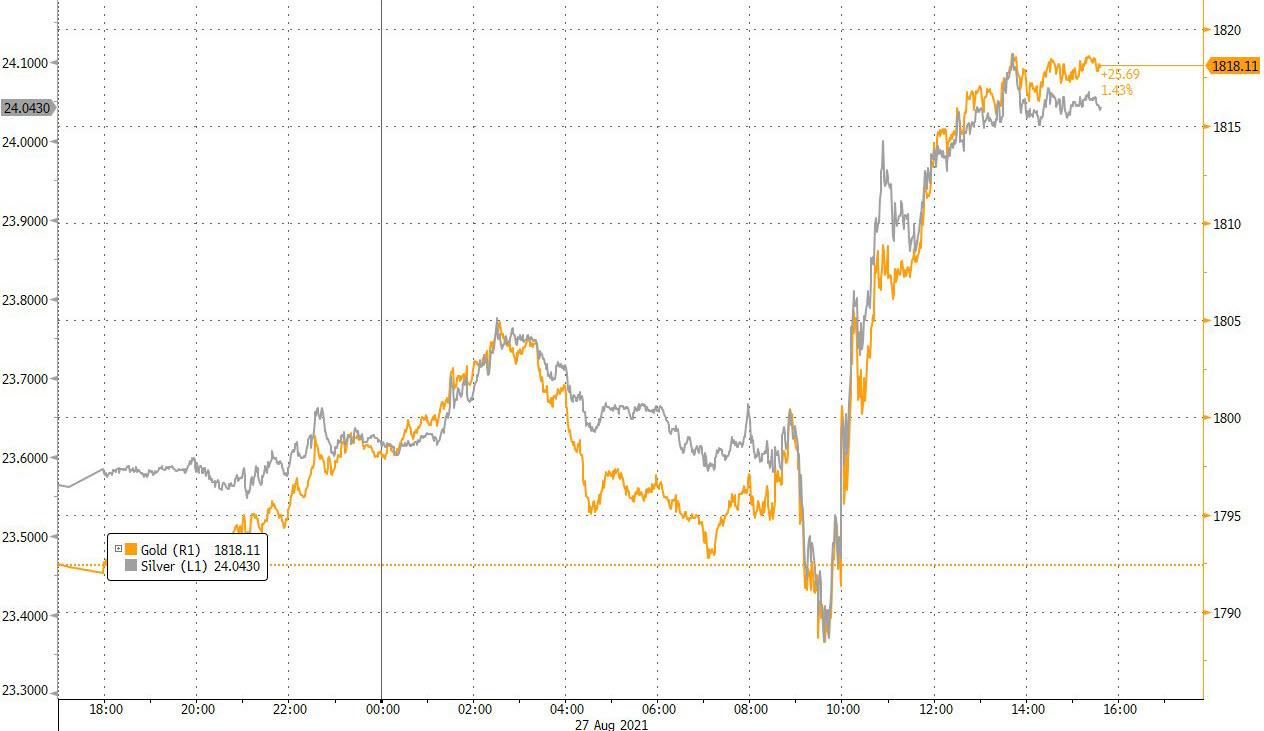
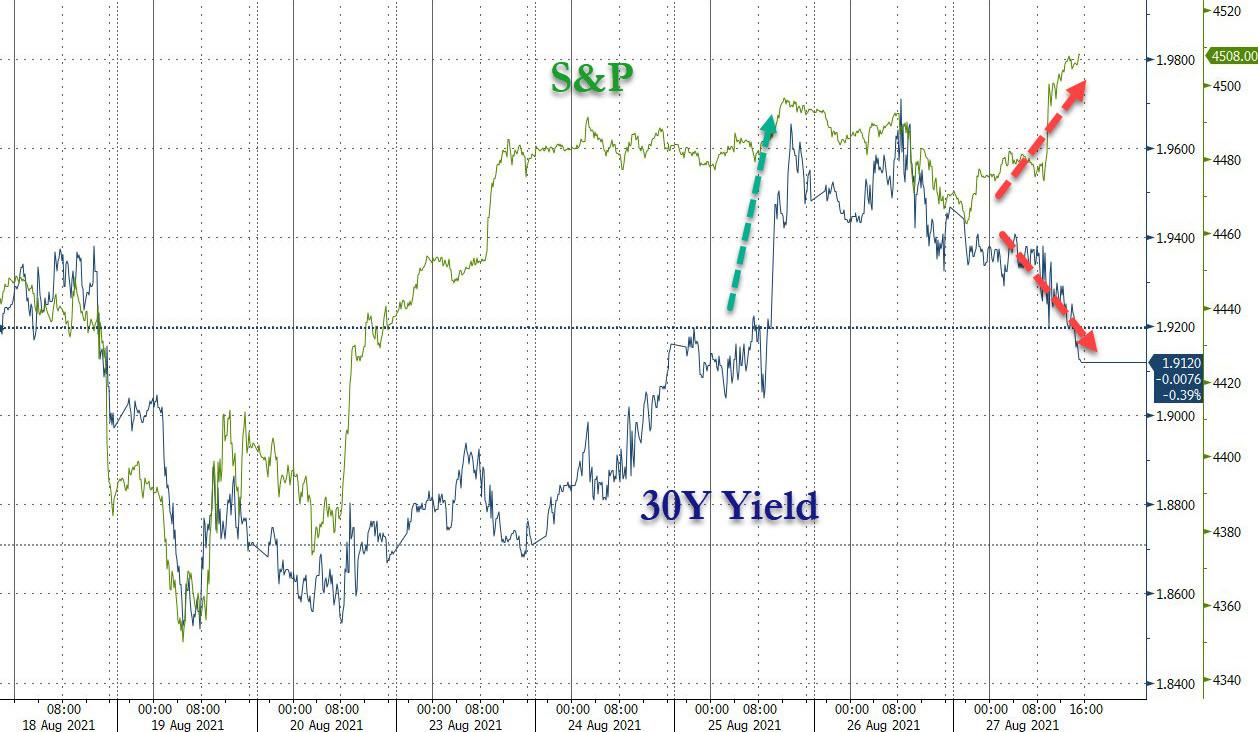
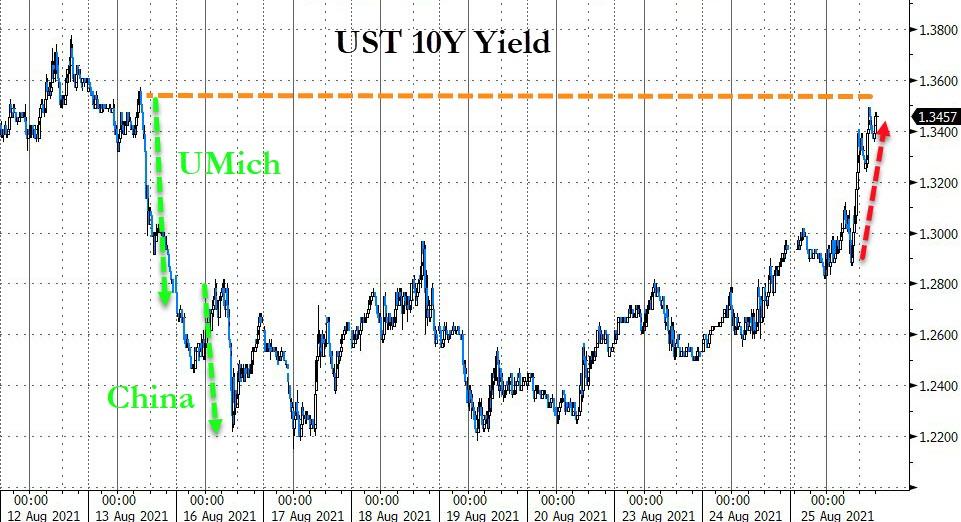
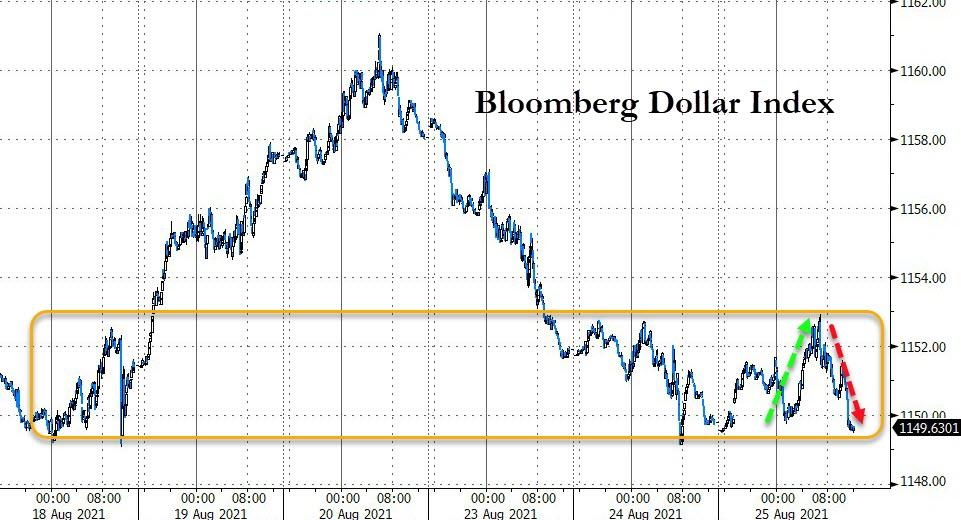
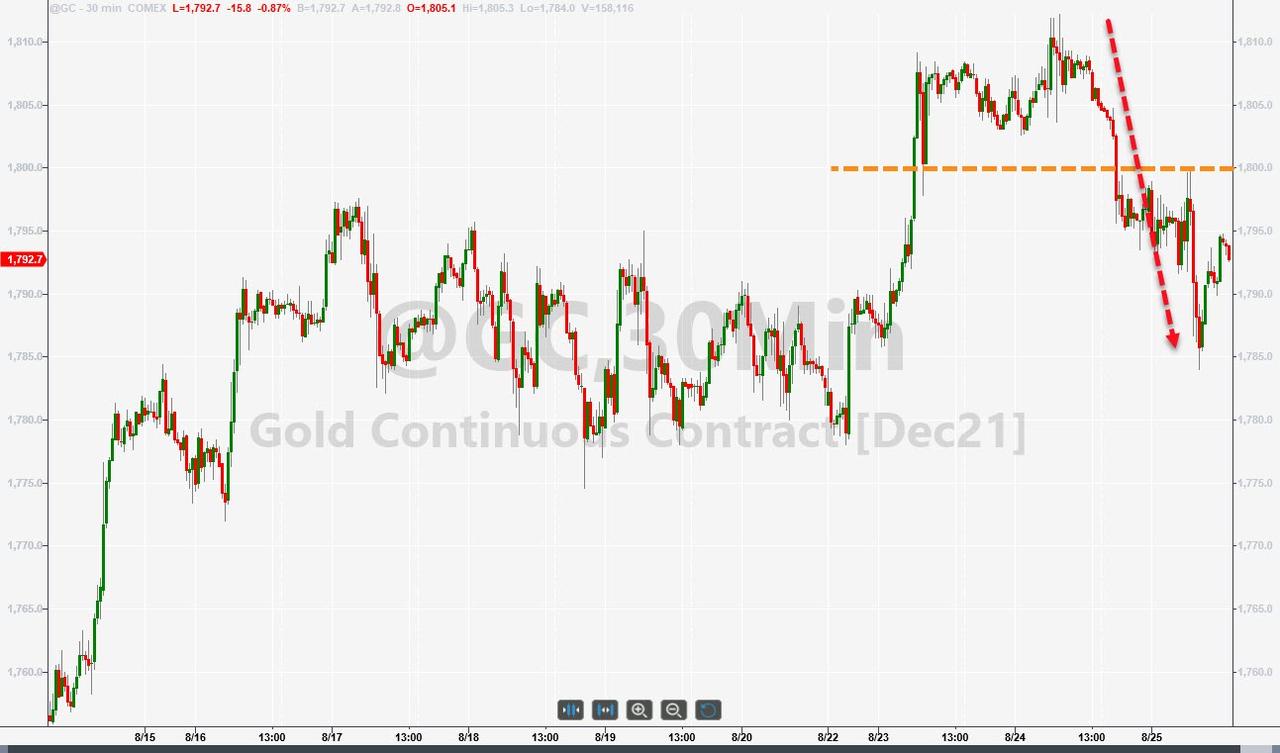
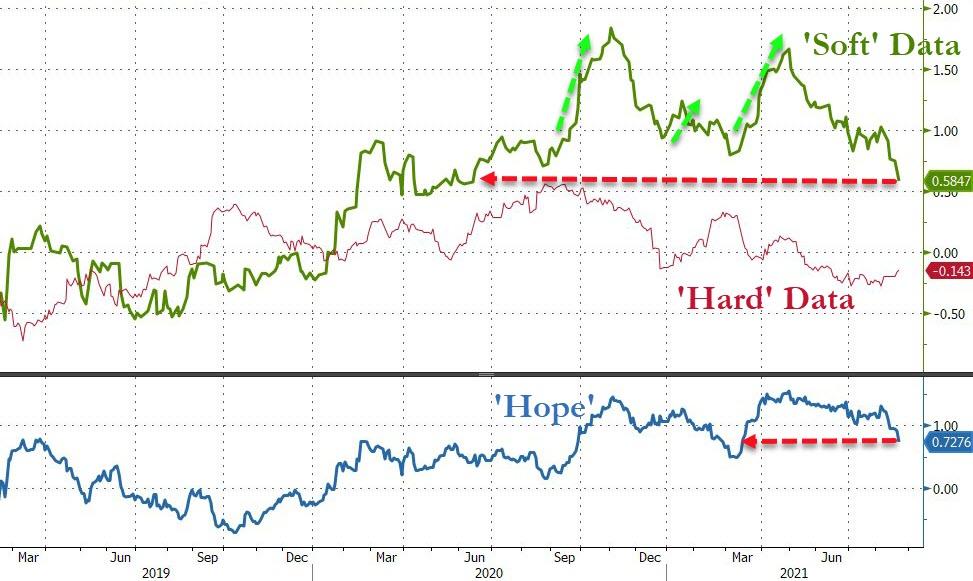
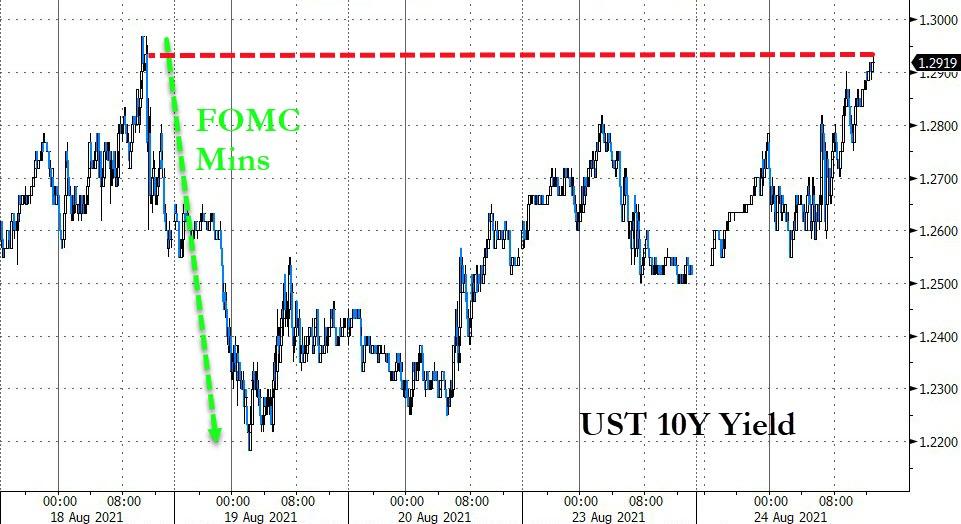
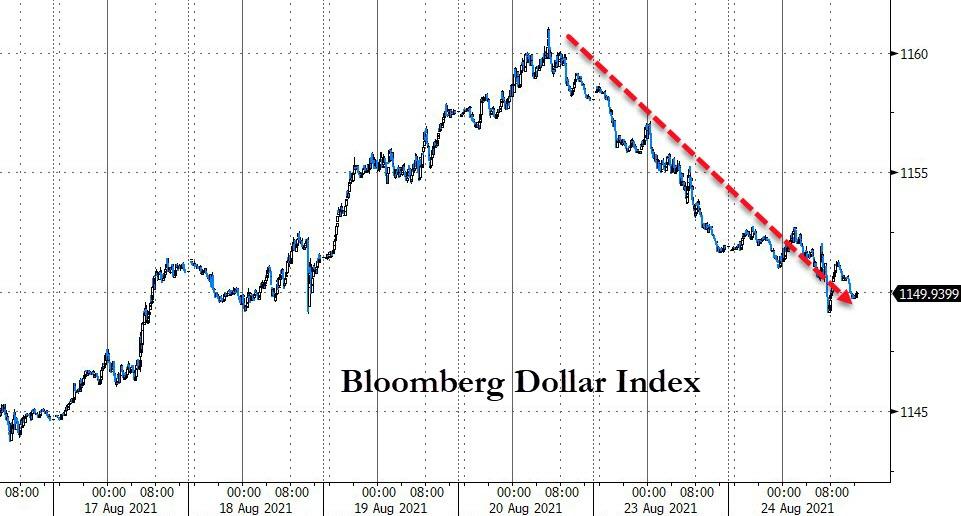
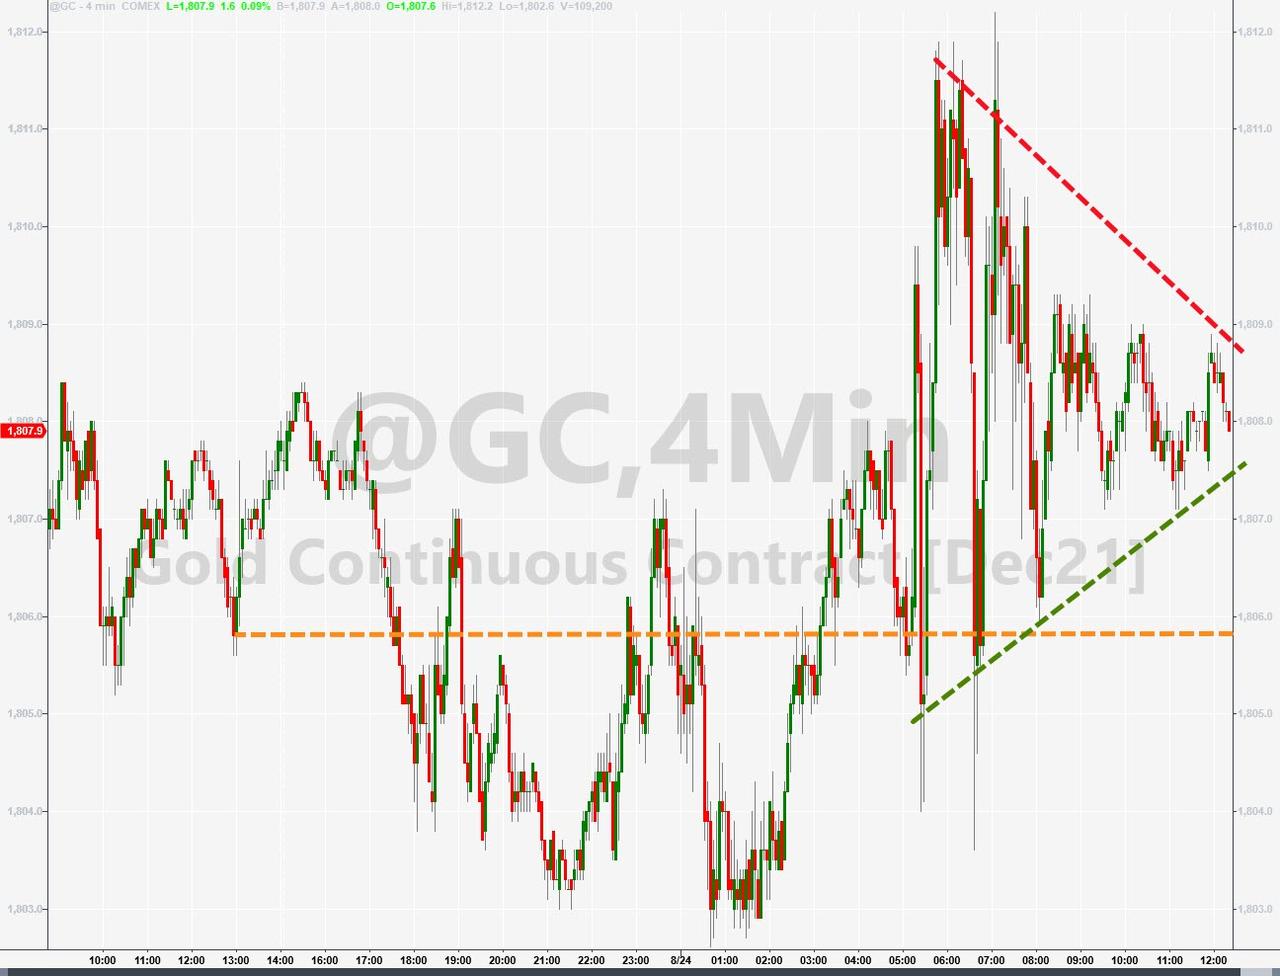
Today, we learned that consumer confidence crashed with inflation fears hitting a 3-year high, as ZH reported. The US Dollar trod water, while the 10-year yield inched up a couple of basis points to 1.305%. This flight to nowhere allowed gold to add +0.28% thereby solidifying it position above the $1,800 level.
Read More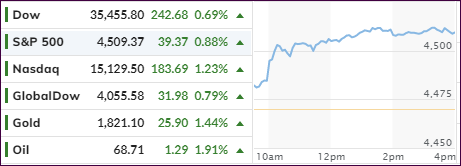
