High Anticipations

Ulli Market Commentary Contact

[Chart courtesy of MarketWatch.com]

  1. Moving the markets

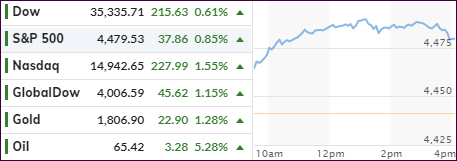
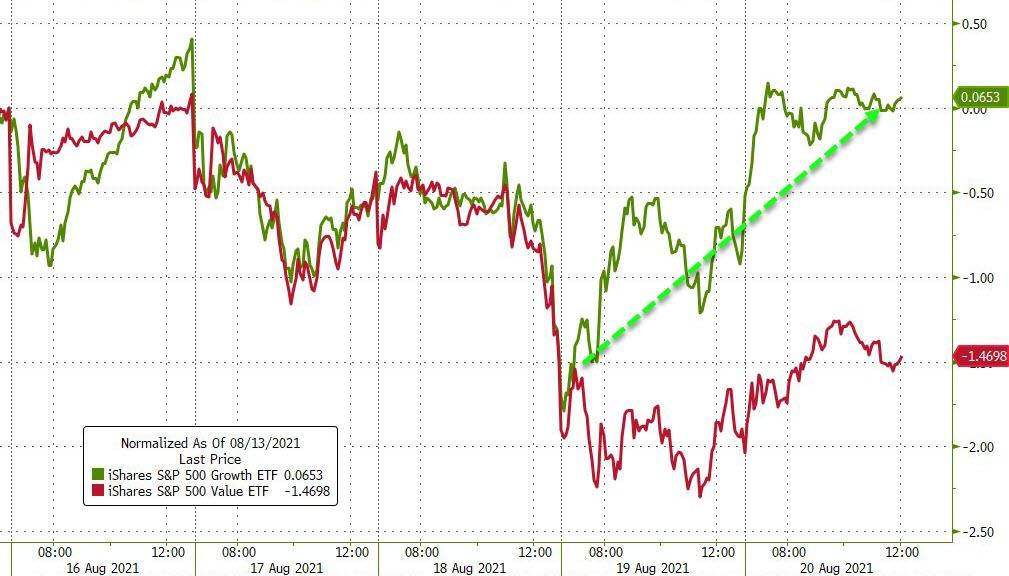
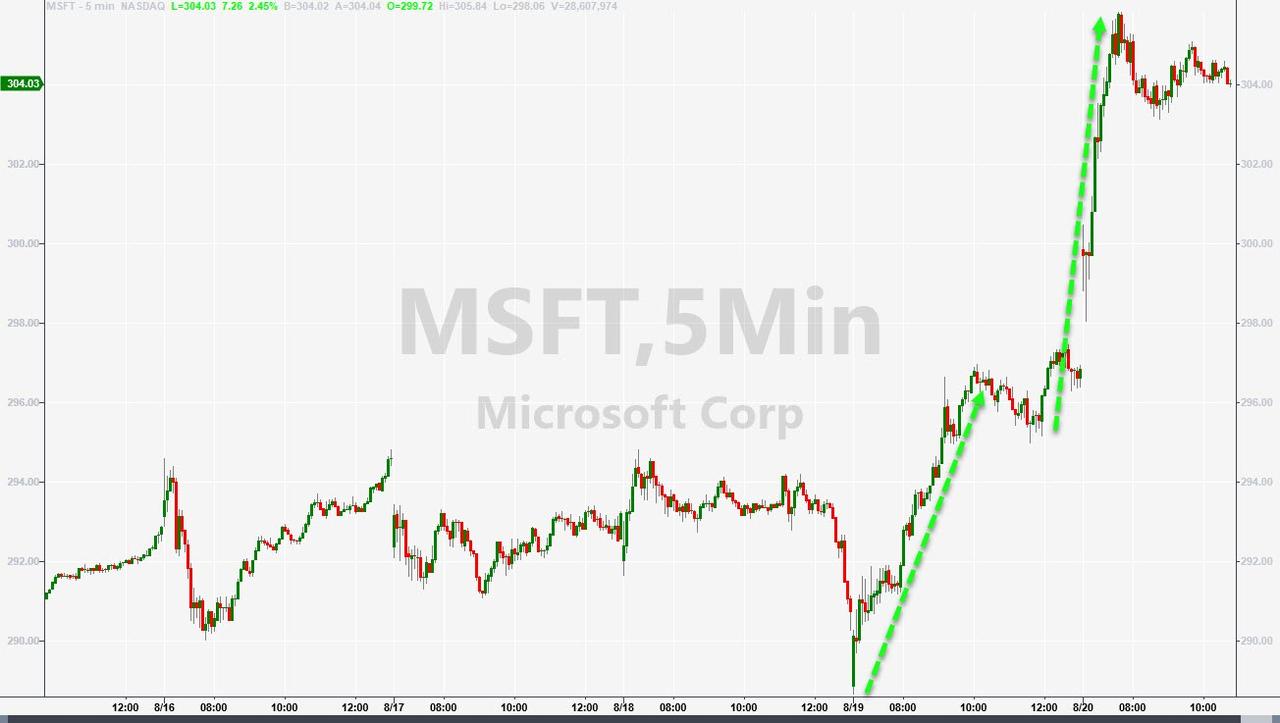
The futures markets already indicated a strong opening, which is exactly how things played out. The major indexes roared out of the gate with all three of them displaying solid gains, but the leader was the Nasdaq by showing off with an advance of +1.55%.

Last week’s weakness was shoved in the rear-view mirror, when Fed VP Kaplan, after Friday’s close, uttered those words that markets are dying to hear, namely that “he’s open to adjusting his view that the Central Bank should start tapering sooner rather than later if the Delta variant persists and hurts economic progress.”

Wow, how much clearer can he be to announce that talk about tapering was just that: Empty talk.

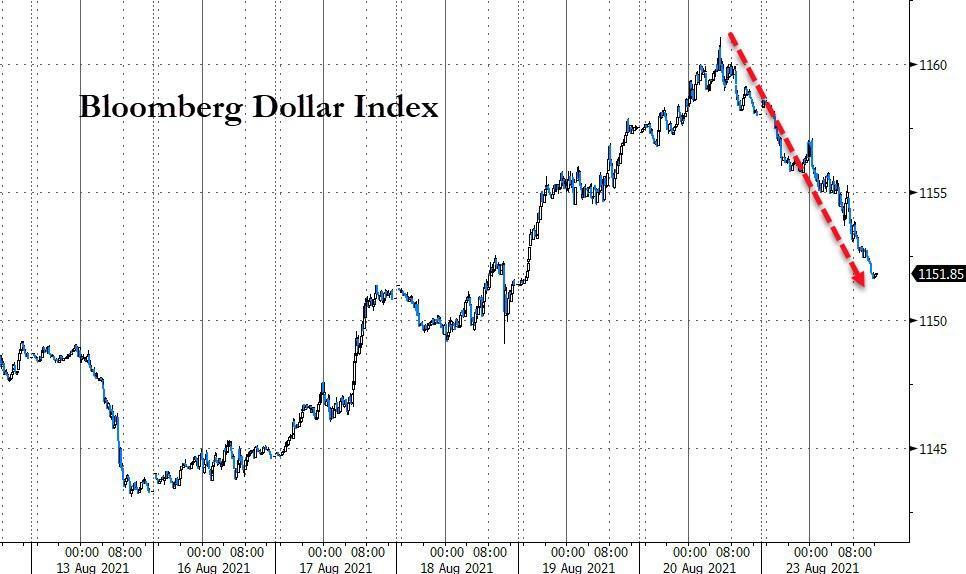
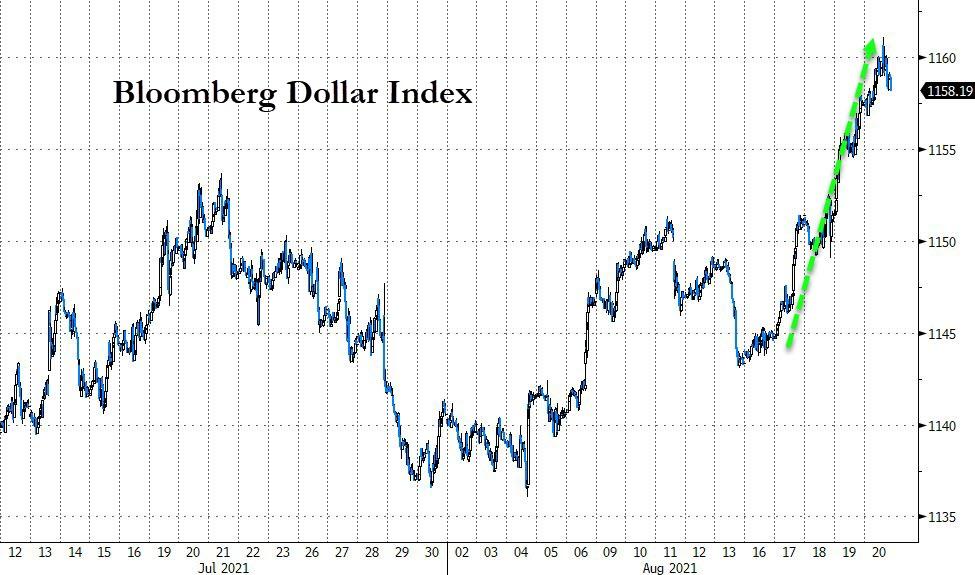
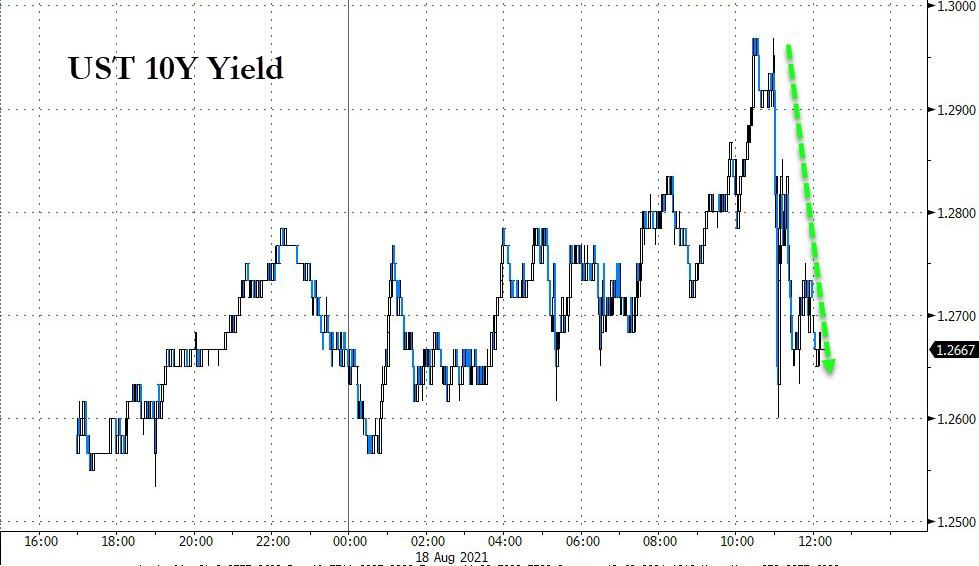
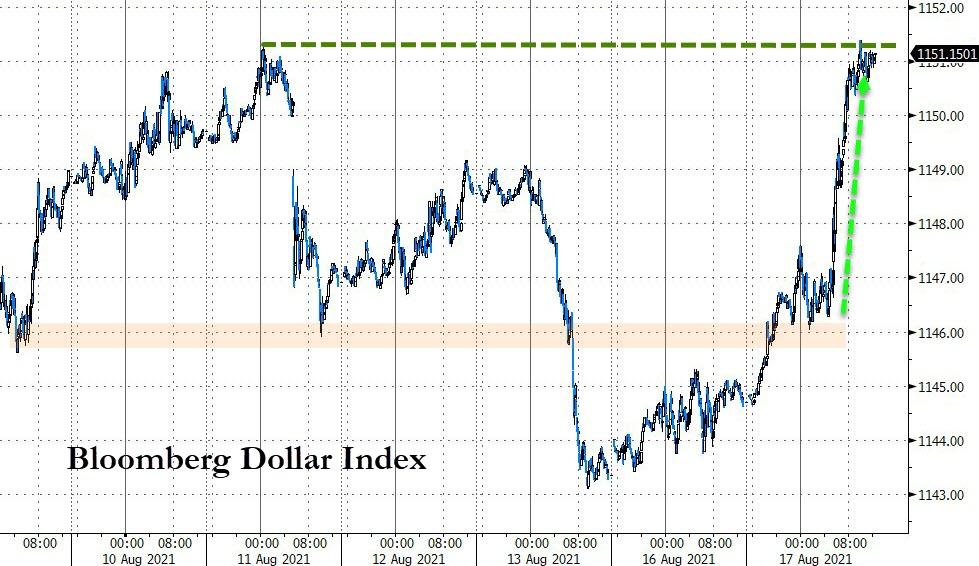
Be that as it may, market reaction was broadly bullish with even the international arena recovering from its recent swoon and participating in today’s “Ramp-A-Thon.” The US Dollar took a swan dive, with bond yields joining in, as the 10-year dropped to 1.25%.

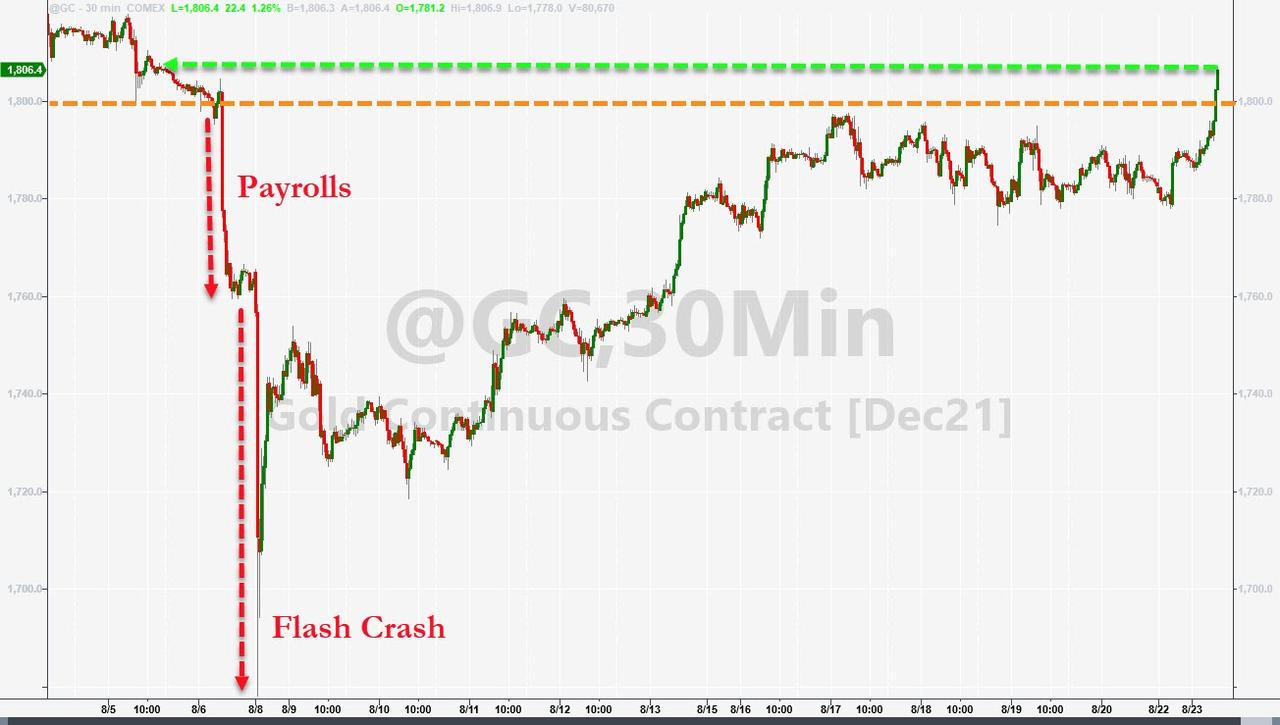
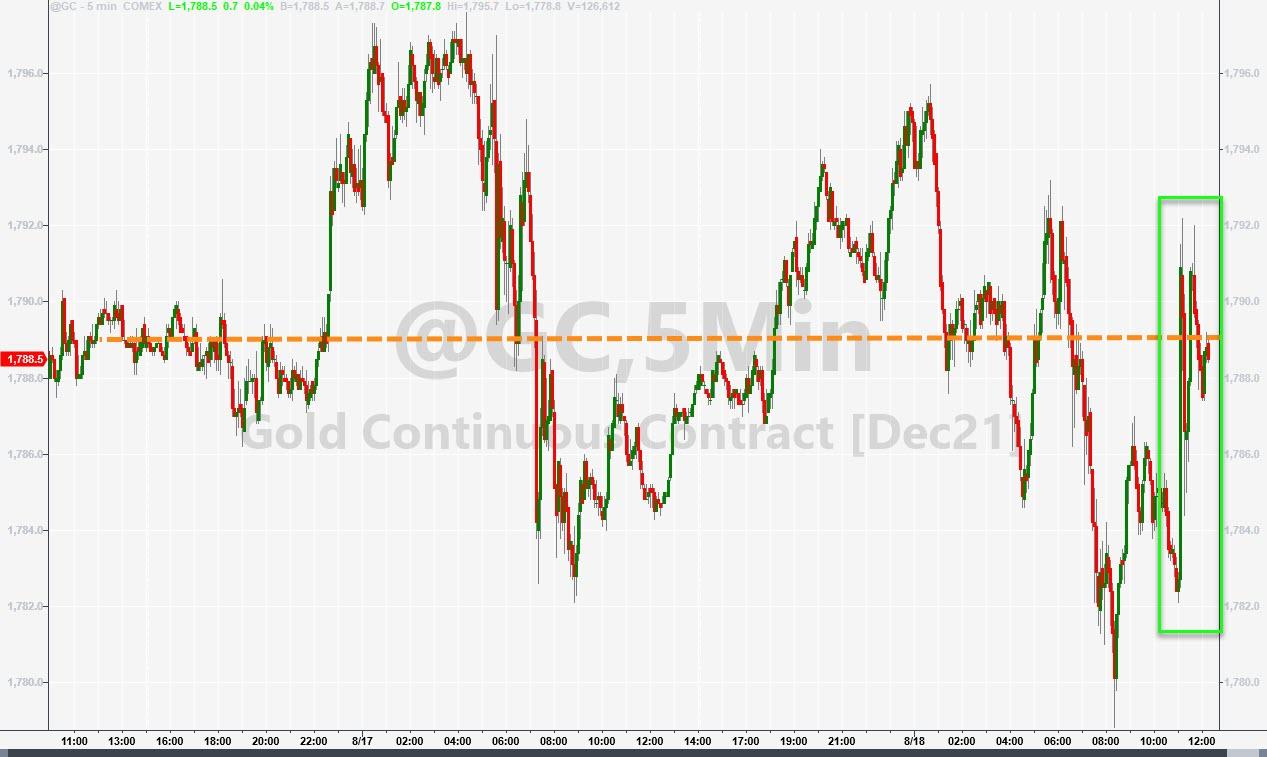
That caused Gold to take off with the precious metal not only rebounding +1.26% but also reclaiming its psychologically important $1,800 level.

The key event is the upcoming Jackson Hole, WY virtual symposium and Fed head Powell’s highly anticipated speech later this week causing a wave of speculations. Here’s one:

Our base case is that the FOMC will announce a taper in September if the August non-farm payrolls is strong,” said Joseph Capurso, head of international economics at CBA. “We anticipate the taper will be implemented in October or November, though the recent increase in Covid infections and deaths in parts of the U.S. may give Powell pause.

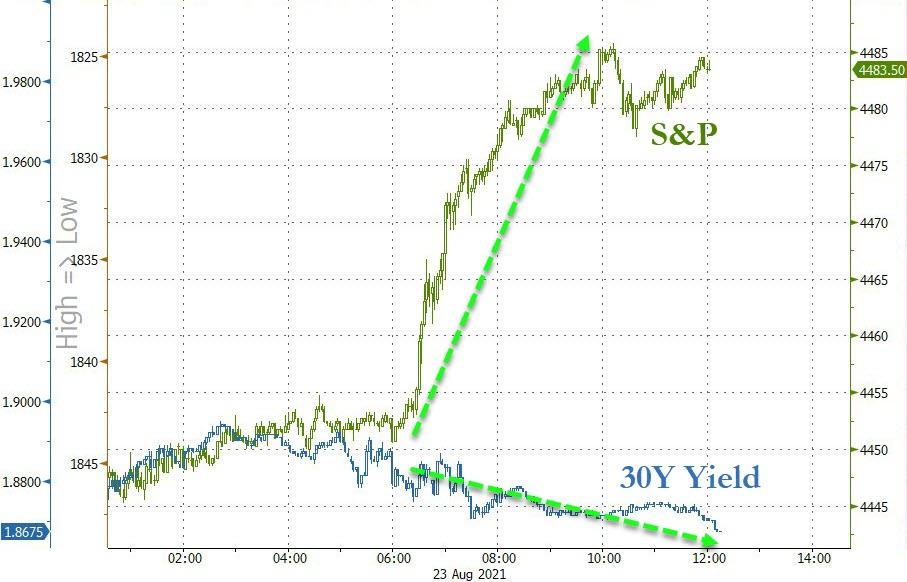
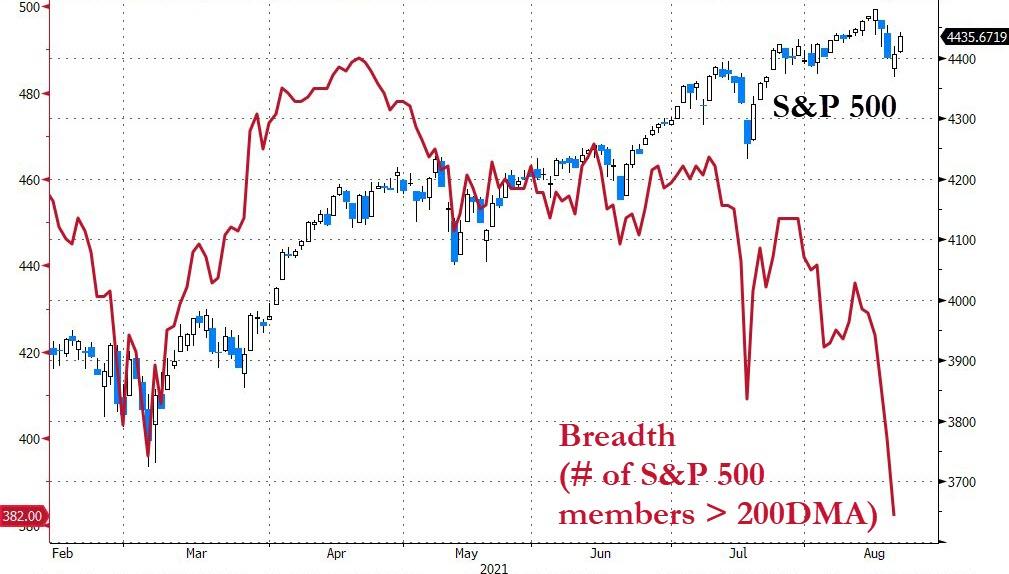
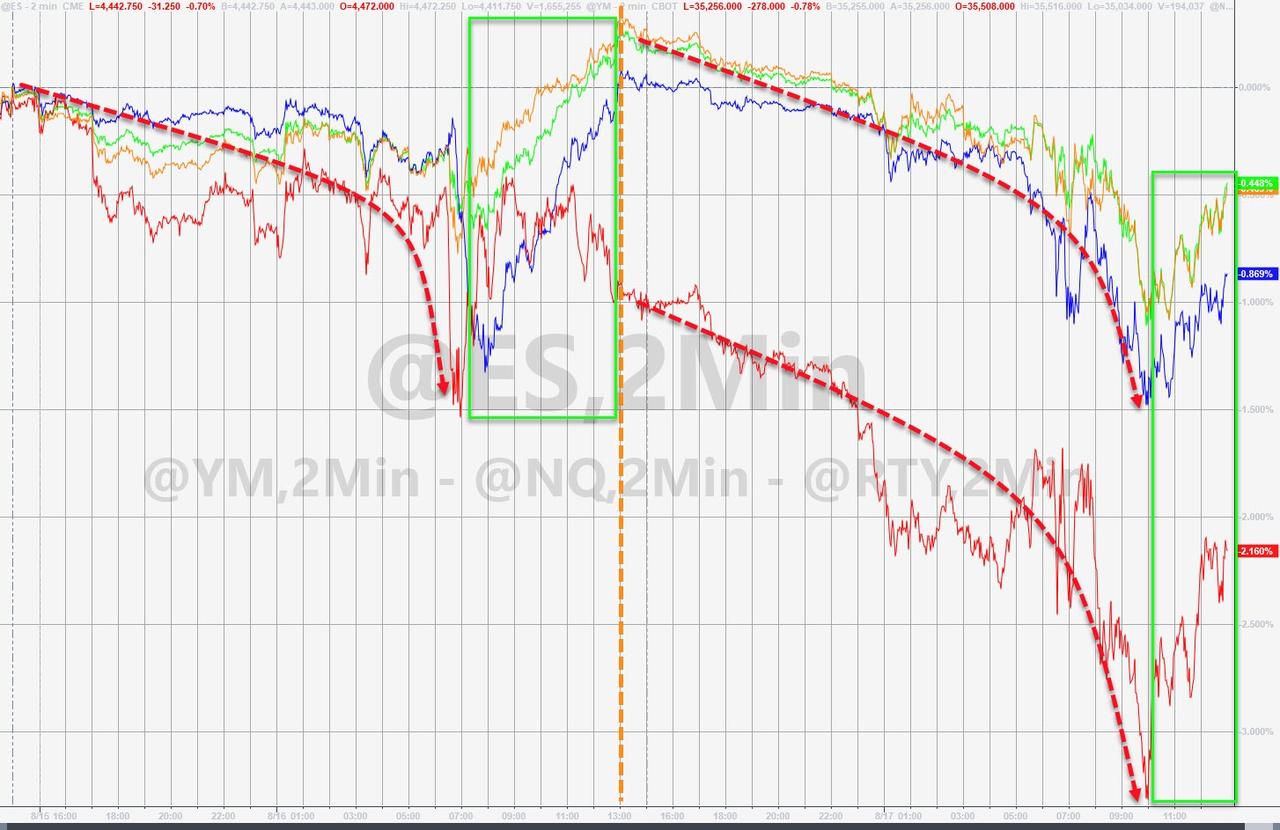
It seems something went awry in the markets today, as equities totally disconnected from the bond markets, as Bloomberg demonstrates in this chart leaving me pondering as to who will be right in the end.

Read More

ETFs On The Cutline – Updated Through 08/20/2021

Ulli ETFs on the Cutline Contact

Below, please find the latest High-Volume ETF Cutline report, which shows how far above or below their respective long-term trend lines (39-week SMA) my currently tracked ETFs are positioned.

This report covers the HV ETF Master List from Thursday’s StatSheet and includes 312 High Volume ETFs, defined as those with an average daily volume of more than $5 million, of which currently 229 (last week 252) are hovering in bullish territory. The yellow line separates those ETFs that are positioned above their trend line (%M/A) from those that have dropped below it.

Take a look:                                                                   

The HV ETF Master Cutline Report

In case you are not familiar with some of the terminology used in the reports, please read the Glossary of Terms. If you missed the original post about the Cutline approach, you can read it here.      

ETF Tracker Newsletter For August 20, 2021

Ulli ETF Tracker Contact

ETF Tracker StatSheet          

You can view the latest version here.

A POSITIVE CLOSE ENDS A DOWN WEEK

[Chart courtesy of MarketWatch.com]

  1. Moving the markets

After Monday’s bounce, it was all downhill, although moderately, but today the bulls found their mojo again with the major indexes staging a broad recovery lead by the Nasdaq’s 1.19% charge.

It was a positive ending to a down week, during which the Dow gave back 1.1%, the S&P 500 0.6% and the Nasdaq 0.7%. In other words, much ado about nothing.

It seemed like we climbed a wall of worry today, as fears of the Fed pulling back some of its stimulus remains fresh in traders’ minds, but apparently that fact is slowly being accepted. Support for bullish sentiment came from the tech sector, as investor picked up some of the recent weaklings like Microsoft, Cisco and Salesforce and turned them into winners, at least for this session.

Of course, not all his hunky dory with Barclay’s commenting on the current situation:

With Fed tapering coming while delta variant keeps spreading, the transition away from liquidity/policy regime to more mid-cycle markets means we may experience a bumpier ride ahead. Market narrative may thus turn more cautious, as concerns about peaking growth rates, Delta variant and policy mistake may prove headwinds, at a time where seasonality and technicals are unfavorable.

Bumpiness could also be cause of next week’s annual meeting in Jackson Hole, WY, after which the Fed may release more insight into their “taper talk,” meaning a tightening of market conditions that could be on deck.

Looking at the big picture, ZeroHedge pointed out that global economic data is disappointing at its fastest pace since the Covid lockdowns began. Hmm, does that mean the Fed will be tightening into a weakening economy?

Things were even worse in China, as their Golden Dragon index suffered its eighth straight weekly loss, which is its longest losing streak in a decade, as ZH explained. Ouch!

Domestically, growth stocks outperformed value, mainly due to Microsoft’s crazy 6% vertical move in the past couple of days. The US Dollar rose every day of this week, while Gold remained steady but did not manage to break above the $1,800 level.

Regarding stocks, the fact is that breadth remains appalling with the S&P 500 being totally disconnected, as Bloomberg shows in this chart. How long this can go on is anyone’s guess.  

Read More

Weekly StatSheet For The ETF Tracker Newsletter – Updated Through 08/19/2021

Ulli ETF StatSheet Contact

ETF Data updated through Thursday, August 19, 2021

Methodology/Use of this StatSheet:

1. From the universe of over 1,800 ETFs, I have selected only those with a trading volume of over $5 million per day (HV ETFs), so that liquidity and a small bid/ask spread are assured.

2. Trend Tracking Indexes (TTIs)

Buy or Sell decisions for Domestic and International ETFs (section 1 and 2), are made based on the respective TTI and its position either above or below its long-term M/A (Moving Average). A crossing of the trend line from below accompanied by some staying power above constitutes a “Buy” signal. Conversely, a clear break below the line constitutes a “Sell” signal. Additionally, I use an 8% trailing stop loss on all positions in these categories to control downside risk.

3. All other investment arenas do not have a TTI and should be traded based on the position of the individual ETF relative to its own respective trend line (%M/A). That’s why those signals are referred to as a “Selective Buy.” In other words, if an ETF crosses its own trendline to the upside, a “Buy” signal is generated. Since these areas tend to be more volatile, I recommend a wider trailing sell stop of 8%-10% depending on your risk tolerance.

If you are unfamiliar with some of the terminology, please see Glossary of Terms and new subscriber information in section 9.     

1. DOMESTIC EQUITY ETFs: BUY — since 07/22/2020

Click on chart to enlarge

Our main directional indicator, the Domestic Trend Tracking Index (TTI-green line in the above chart) has now rallied above its long-term trend line (red) by +8.44% and remains in “BUY” mode as posted.

Read More

Searching For Clarity And Direction

Ulli Market Commentary Contact

[Chart courtesy of MarketWatch.com]

  1. Moving the markets

On deck today were the Fed minutes from the July meeting, which disclosed what everyone already knew, namely that discussions about a possible reduction of its monthly $120 billion bond buying program had already happened.

Here’s what the minutes said:

Looking ahead, most participants noted that, provided that the economy were to evolve broadly as they anticipated, they judged that it could be appropriate to start reducing the pace of asset purchases this year.

The economy has reached its inflation goal and was “close to being satisfied” with the progress of job growth.

The timing of the tapering had been a hot topic ever since the Fed’s July get together, with participants expressing support of announcing such a move in September with an effective date of October.

Now that the cat has been let out of the bag, traders, and computer algos alike are left to figure out how this “tightening” could maintain the bullish meme. At least for today, the reaction was negative and, while the major indexes originally maintained a neutral sideways pattern, in the end, they dumped into the close. “Value” and “Growth” followed the same premise.

Bond yields rose for most of the session with the 10-year approaching its 1.30% level, but sold off into the close ending the day just about unchanged.

The US Dollar index ripped early on and then dipped, recovered and closed slightly in the green. Gold had its own roller coaster ride and ended the session right at the unchanged line.

I see the economy slowing down, which is clearly demonstrated in this chart by Bloomberg, a possibility that is not yet acknowledged in the equity markets.

Read More

Stocks Dump—Where’s The Afternoon Pump?

Ulli Market Commentary Contact

[Chart courtesy of MarketWatch.com]

  1. Moving the markets

An early dump in the markets was not followed by the usual afternoon pump, as a meager rebound attempt failed to make up for the early losses.

Contributing to the sour mood were declining retail sales, as the artificial boom created by almost 18 months of “stimmy checks” had worn off. Other econ data points were mixed with Homebuilder Confidence collapsing to 13-month lows, but US Industrial Production showed some hope with its indicator rising 0.9% MoM, which is the 5th straight month of increases.

Still, signs about a slowing economy are present, causing ZeroHedge to state:

Well, we were right: 3 months later, with China bracing for a softish (if not much harder) landing, with countries imposing Covid lockdowns all over again, and with the US consumer tapped out and no longer spending like a drunken sailor, the peak is long behind us and the painful return of gravity – and stimmy-free reality – is back on deck…

Home Depot disappointed and dropped 4% despite topping estimates, but it was the same-store sales numbers that analysts focused on, and they were below expectations.

The “growth scare” continues as US Macro data is declining/disappointing at the fastest rate since March 2020, as ZH put it. To me, this type of reality must set in when a so-called recovery is based nothing but hot air via reckless money creation without an offsetting increase in production.

The US Dollar rocketed today and touched last week’s highs, while bond yields meandered aimlessly below the unchanged line with 10-Year dropping to 1.26%. Gold held up surprisingly well, given the massive dollar jump, with the precious metal only giving up -0.16%.

Read More