
- Moving the markets
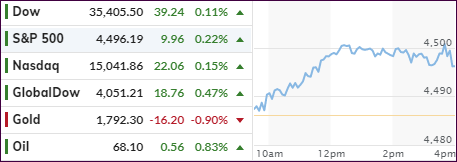
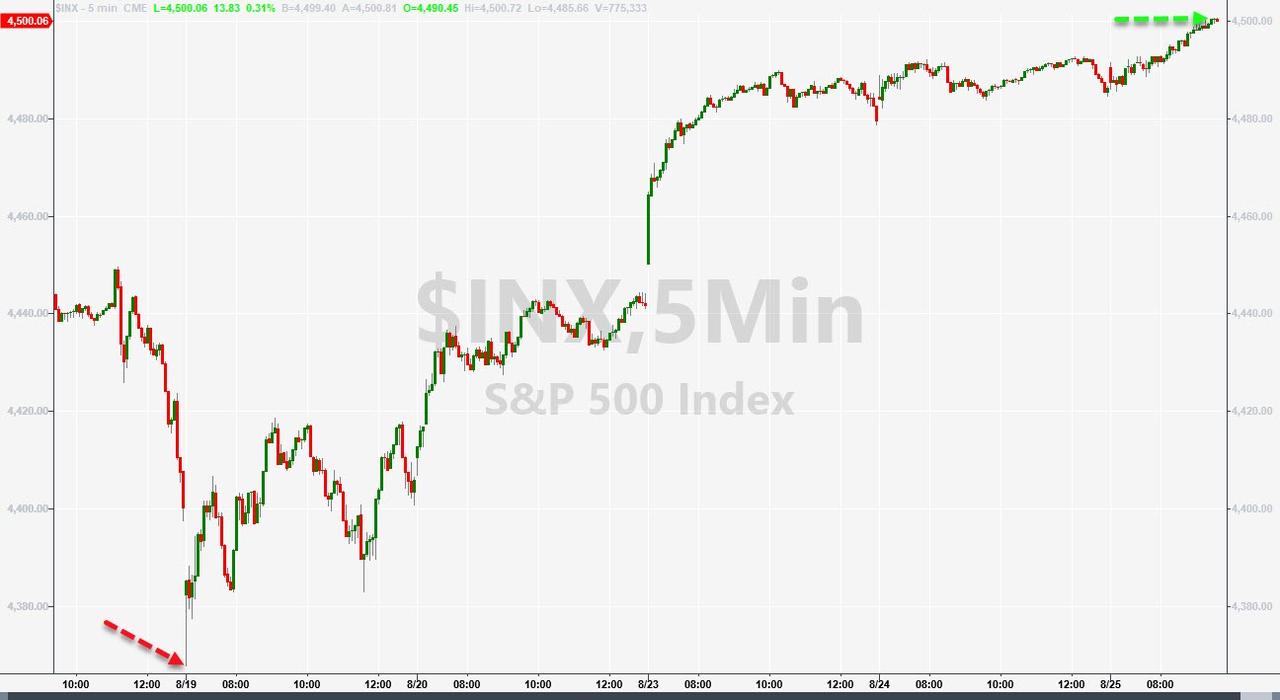
Right now, it seems there is no stopping the bullish train with the S&P 500 taking out its 4,500 milestone for the first time, while the other two major indexes continued their winning streak as well.
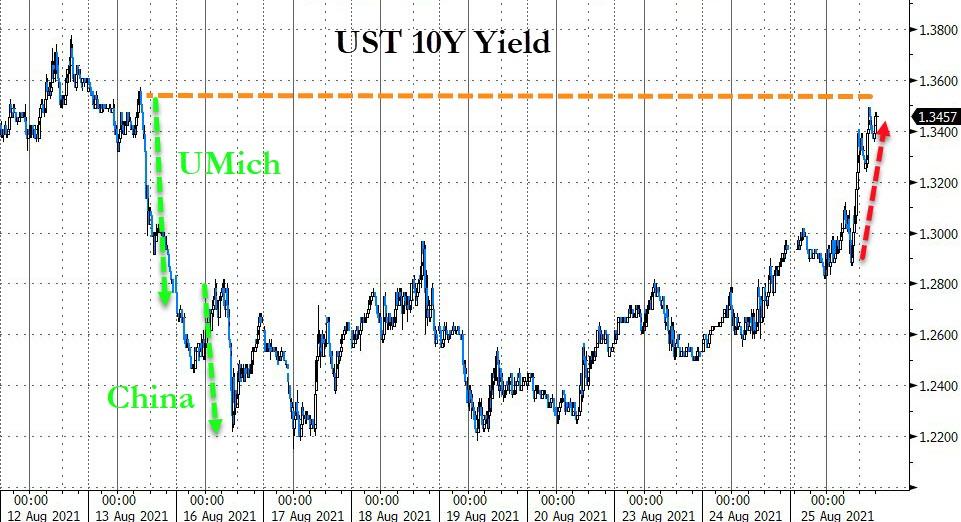
Bond yields rocketed higher with the 10-year climbing to 1.35%, which was the highest level since earlier in the month when it reached 1.36%. This move helped the financial sector with XLF sprinting ahead by +1.18%.
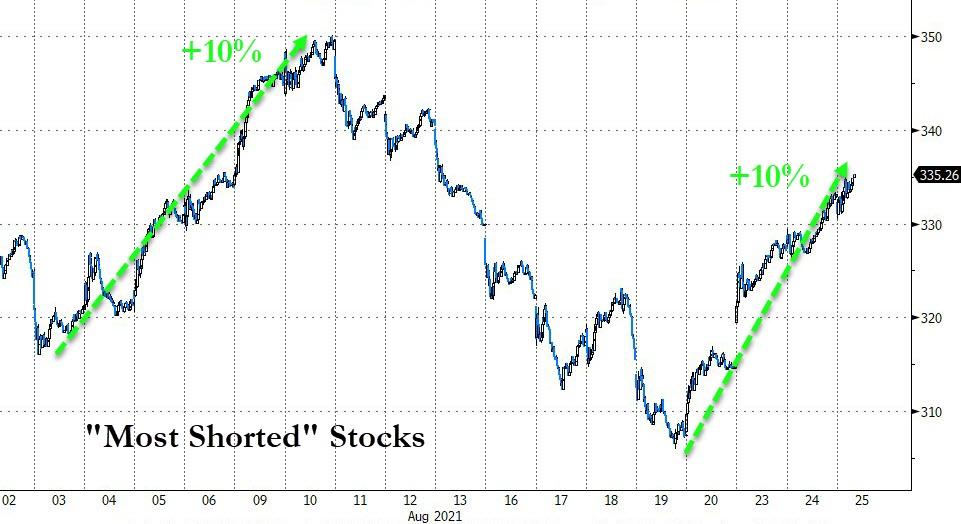
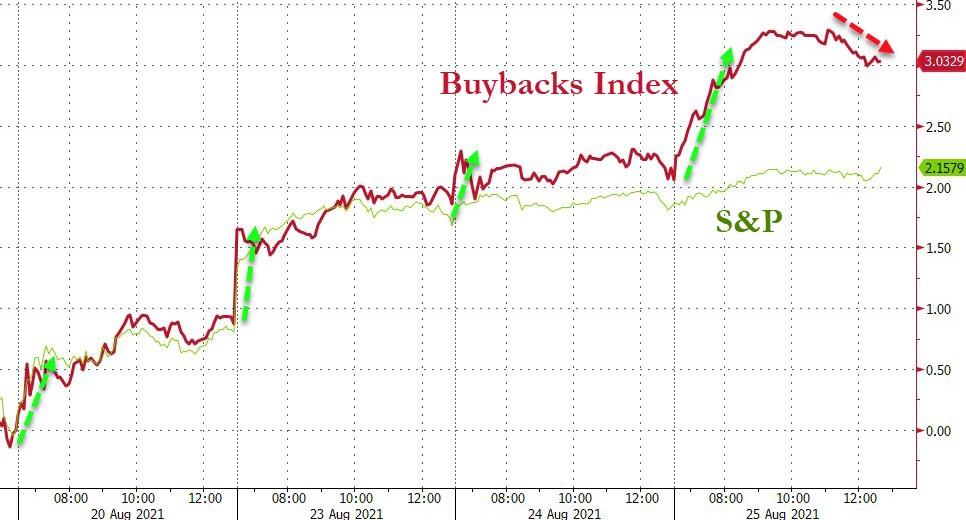
Assisting the ascent was the ongoing short-squeeze, which followed through from last week and has now bounced 10% off its bottom, which was helped by a massive bank buy back scheme. Also boosting sentiment were signs that the delta variant cases could be peaking.
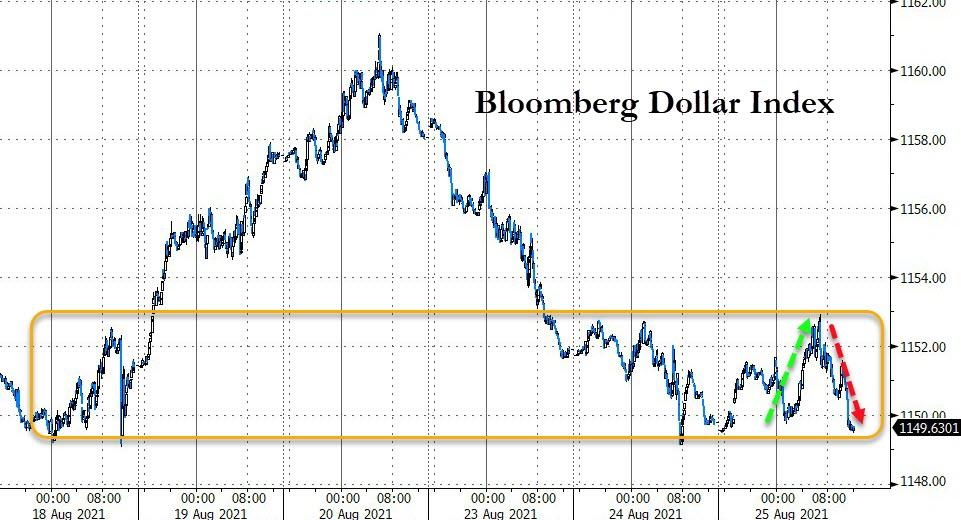
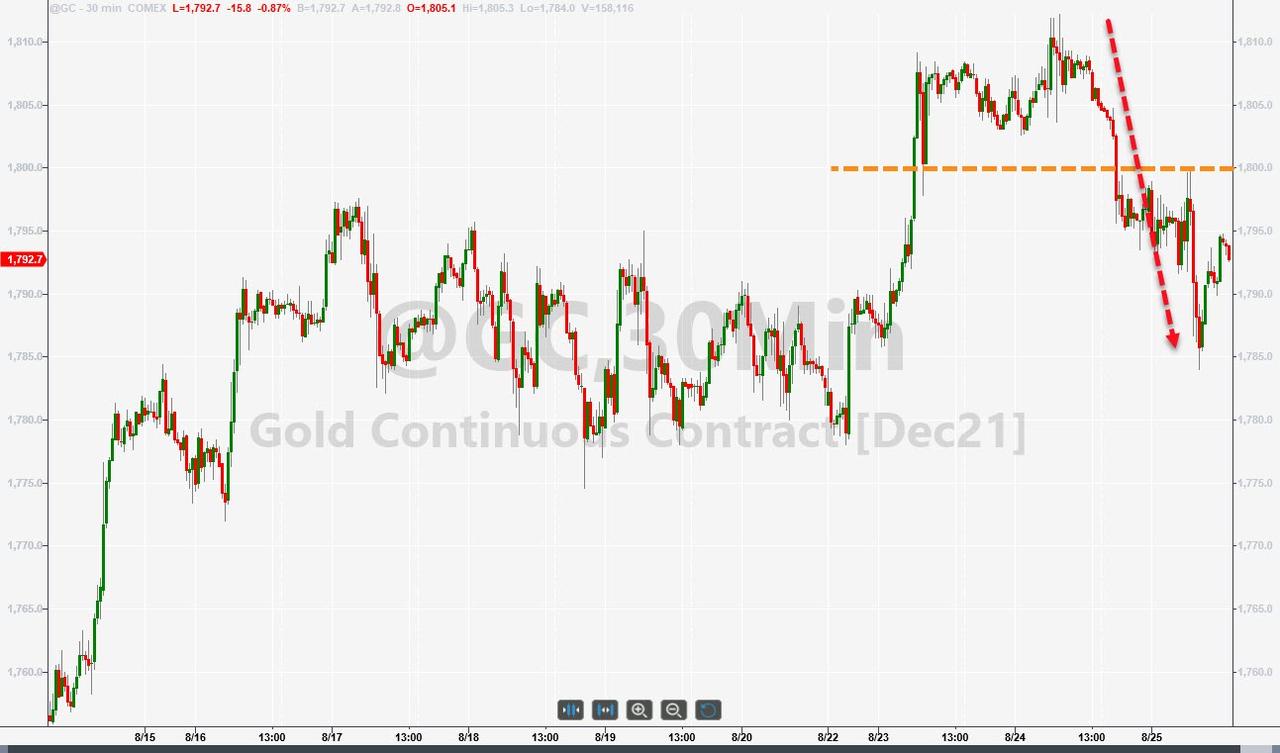
The US Dollar ripped and dipped and essentially ended unchanged, thereby allowing gold to recapture some of its early losses, but the precious metal still lost its $1,800 level again by dropping -0.88%.
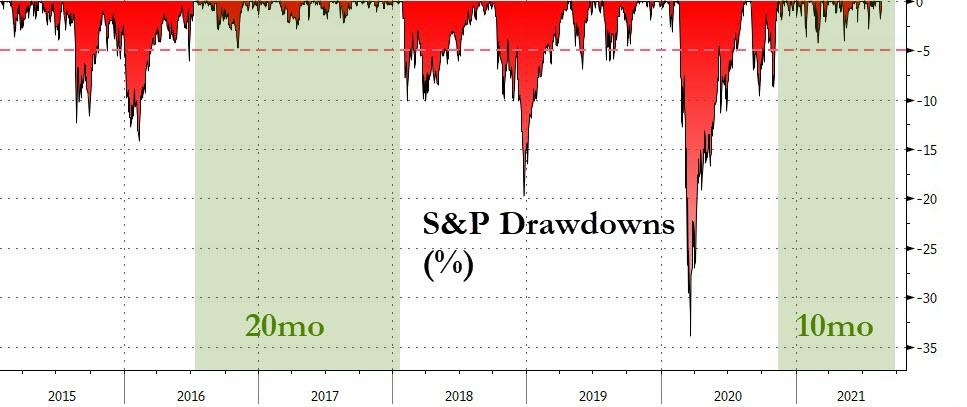
As ZeroHedge pointed out, the month of August has historically been one of the quietest periods for trading, but the S&P’s average volume this year is still below its 10-year average and looks to be the lowest since 2018. It now has been 10 months since the S&P suffered a 5% drawdown or greater. Hmmm…
2. ETFs in the Spotlight
In case you missed the announcement and description of this section, you can 8 again.
It features some of the 10 broadly diversified domestic and sector ETFs from my HighVolume list as posted every Saturday. Furthermore, they are screened for the lowest MaxDD% number meaning they have been showing better resistance to temporary sell offs than all others over the past year.
The below table simply demonstrates the magnitude with which these ETFs are fluctuating above or below their respective individual trend lines (%+/-M/A). A break below, represented by a negative number, shows weakness, while a break above, represented by a positive percentage, shows strength.
For hundreds of ETF choices, be sure to reference Thursday’s StatSheet.
For this current domestic “Buy” cycle, here’s how some our candidates have fared:
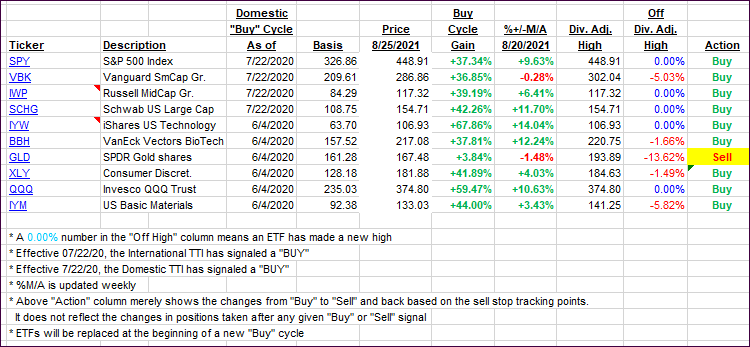
Click image to enlarge.
Again, the %+/-M/A column above shows the position of the various ETFs in relation to their respective long-term trend lines, while the trailing sell stops are being tracked in the “Off High” column. The “Action” column will signal a “Sell” once the -8% point has been taken out in the “Off High” column. For more volatile sector ETFs, the trigger point is -10%.
3. Trend Tracking Indexes (TTIs)
Our TTIs followed the major indexes higher.
This is how we closed 08/25/2021:
Domestic TTI: +10.39% above its M/A (prior close +9.81%)—Buy signal effective 07/22/2020.
International TTI: +6.14% above its M/A (prior close +5.64%)—Buy signals effective 07/22/2020.
Disclosure: I am obliged to inform you that I, as well as my advisory clients, own some of the ETFs listed in the above table. Furthermore, they do not represent a specific investment recommendation for you, they merely show which ETFs from the universe I track are falling within the specified guidelines.
All linked charts above are courtesy of Bloomberg via ZeroHedge.
Contact Ulli