
- Moving the markets
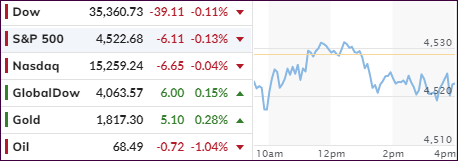
The major indexes managed to close the notoriously slow month of August on a whimper, but unscathed and with bullish momentum intact. It was a day of churning with the S&P 500 touching a new intraday high but then fading below its unchanged line.
For the month, all three of them came out ahead, led by the Nasdaq with a 4% gain, while the S&P 500 and Dow ended up with advances of 3% and 1.3% respectively.
Earnings growth contributed to the bullish meme, assisted by continued loose Fed monetary policies, which were the main contributor to the S&P 500 scoring its 9th positive month in the last 10. The index also achieved its 53rd record close of 2021 just yesterday.
All this occurred in the face of oncoming headwinds in form of the Delta variant of Covid 19, which at times managed to cast doubt on the economic recovery. However, in the end, the Fed and its lack of serious taper talk and definitive action, as well as soothing words about the “transitory” effect of inflation, won out and kept the upward trend alive.
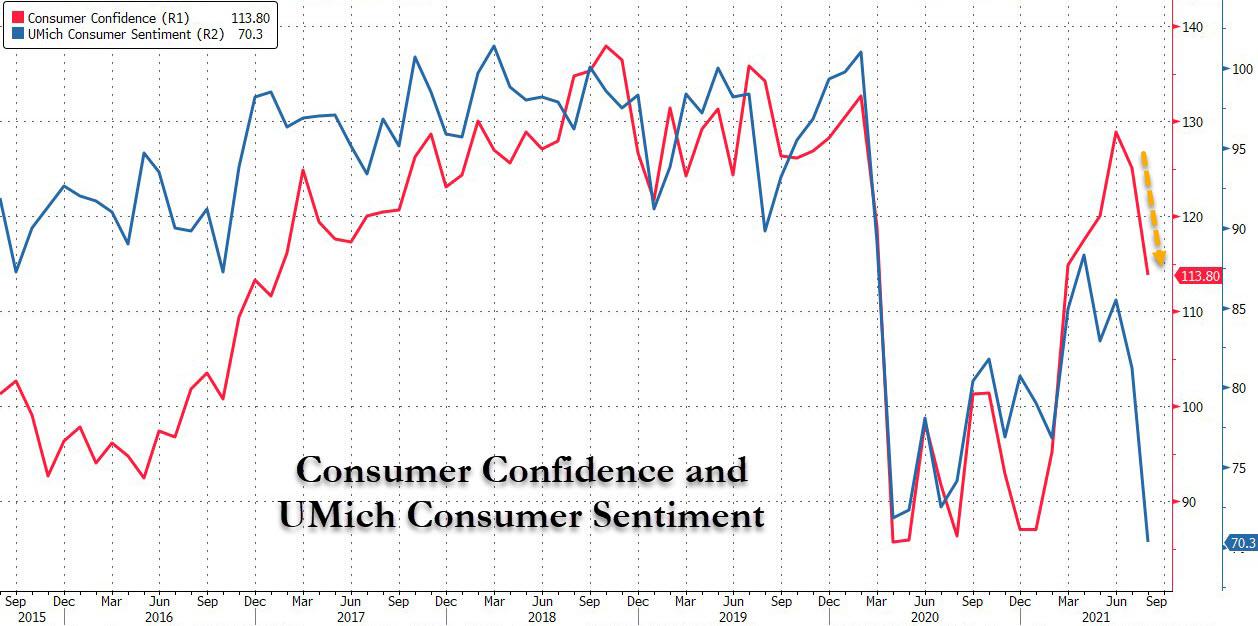
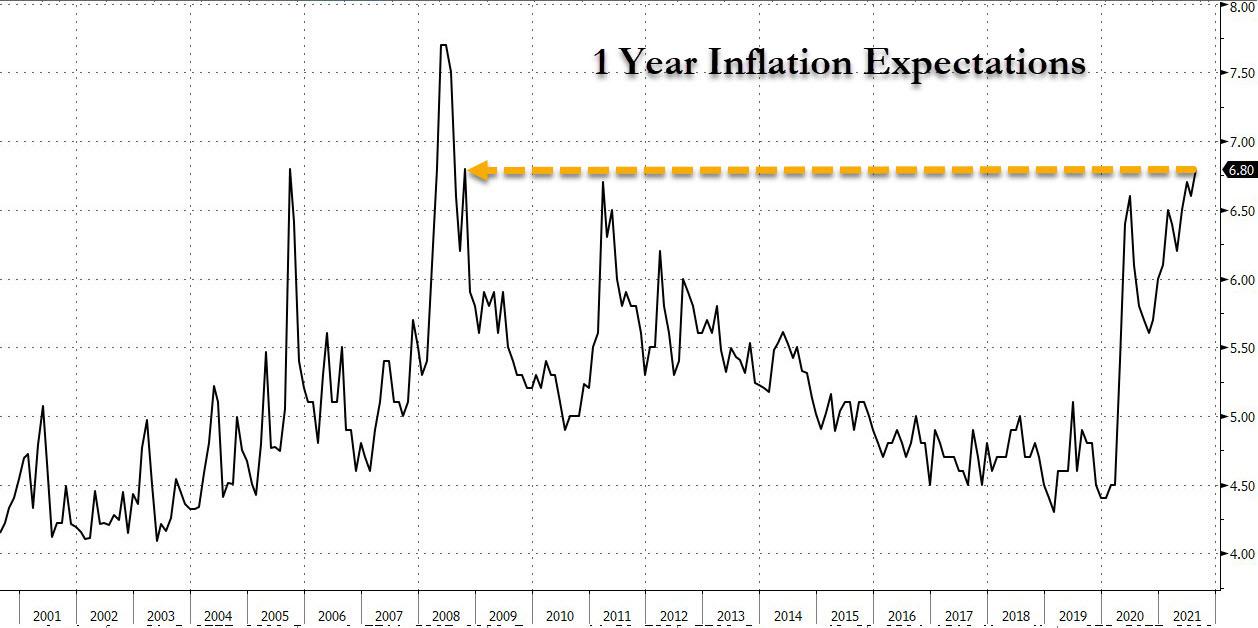
Today, we learned that consumer confidence crashed with inflation fears hitting a 3-year high, as ZH reported. The US Dollar trod water, while the 10-year yield inched up a couple of basis points to 1.305%. This flight to nowhere allowed gold to add +0.28% thereby solidifying it position above the $1,800 level.
2. ETFs in the Spotlight
In case you missed the announcement and description of this section, you can 8 again.
It features some of the 10 broadly diversified domestic and sector ETFs from my HighVolume list as posted every Saturday. Furthermore, they are screened for the lowest MaxDD% number meaning they have been showing better resistance to temporary sell offs than all others over the past year.
The below table simply demonstrates the magnitude with which these ETFs are fluctuating above or below their respective individual trend lines (%+/-M/A). A break below, represented by a negative number, shows weakness, while a break above, represented by a positive percentage, shows strength.
For hundreds of ETF choices, be sure to reference Thursday’s StatSheet.
For this current domestic “Buy” cycle, here’s how some our candidates have fared:
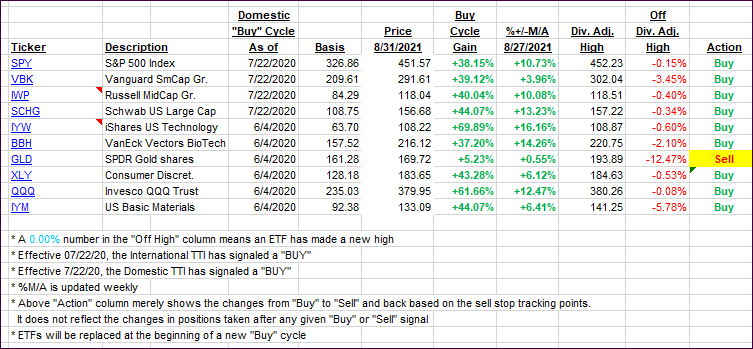
Click image to enlarge.
Again, the %+/-M/A column above shows the position of the various ETFs in relation to their respective long-term trend lines, while the trailing sell stops are being tracked in the “Off High” column. The “Action” column will signal a “Sell” once the -8% point has been taken out in the “Off High” column. For more volatile sector ETFs, the trigger point is -10%.
3. Trend Tracking Indexes (TTIs)
Our TTIs changed immaterially as the major trend was sideways.
This is how we closed 08/31/2021:
Domestic TTI: +9.95% above its M/A (prior close +9.98%)—Buy signal effective 07/22/2020.
International TTI: +6.00% above its M/A (prior close +5.82%)—Buy signals effective 07/22/2020.
Disclosure: I am obliged to inform you that I, as well as my advisory clients, own some of the ETFs listed in the above table. Furthermore, they do not represent a specific investment recommendation for you, they merely show which ETFs from the universe I track are falling within the specified guidelines.
All linked charts above are courtesy of Bloomberg via ZeroHedge.
Contact Ulli