
ETF Tracker StatSheet
You can view the latest version here.
DOVISH FED PROPELS MARKETS
- Moving the markets
Equities received a giant boost from Fed head Powell’s statement that he supports starting to “taper bond purchases” this year, which was expected. What was not expected was his dovish tone, AKA a nothing burger, by not discussing when the actual taper might be announced.
“The timing and pace of the coming reduction in asset purchases will not be intended to carry a direct signal regarding the timing of interest rate liftoff, for which we have articulated a different and substantially more stringent test,” Powell said.
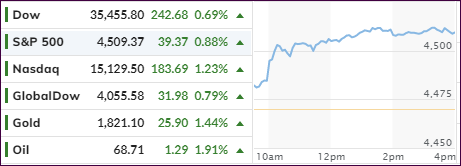
That was enough to sends the bulls on a rampage, with the major indexes never looking back and closing solidly in the green led by the Nasdaq with +1.23%. The rally was broad based with both “value” and “growth” participating.
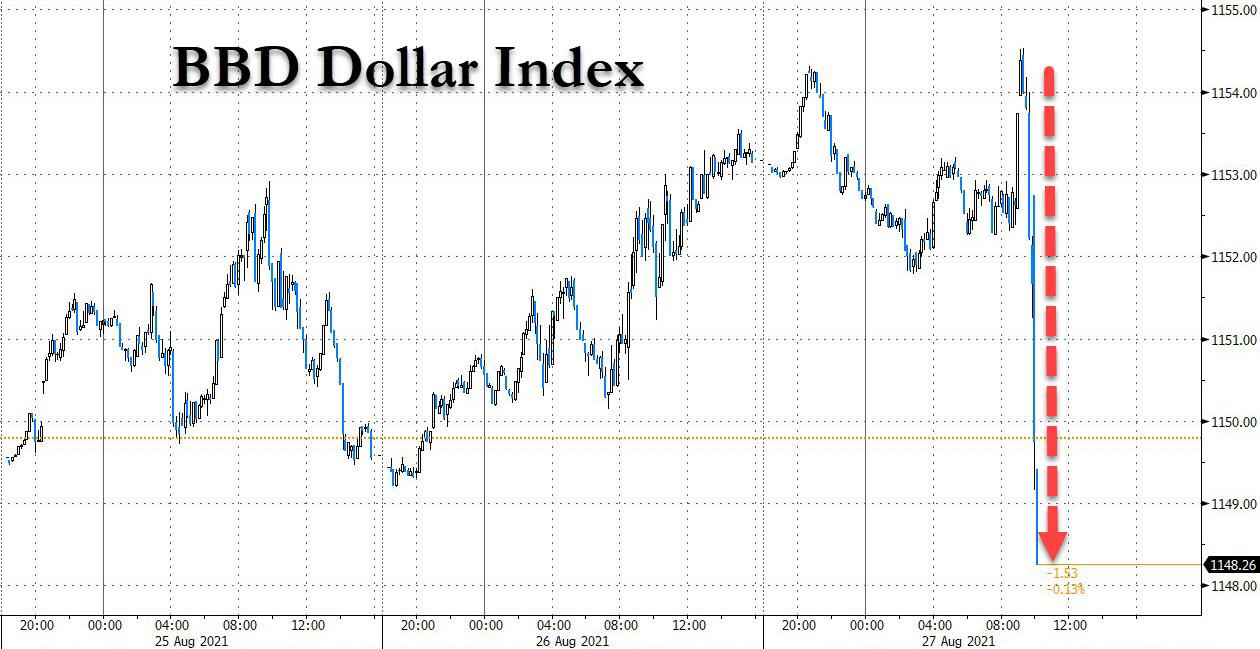
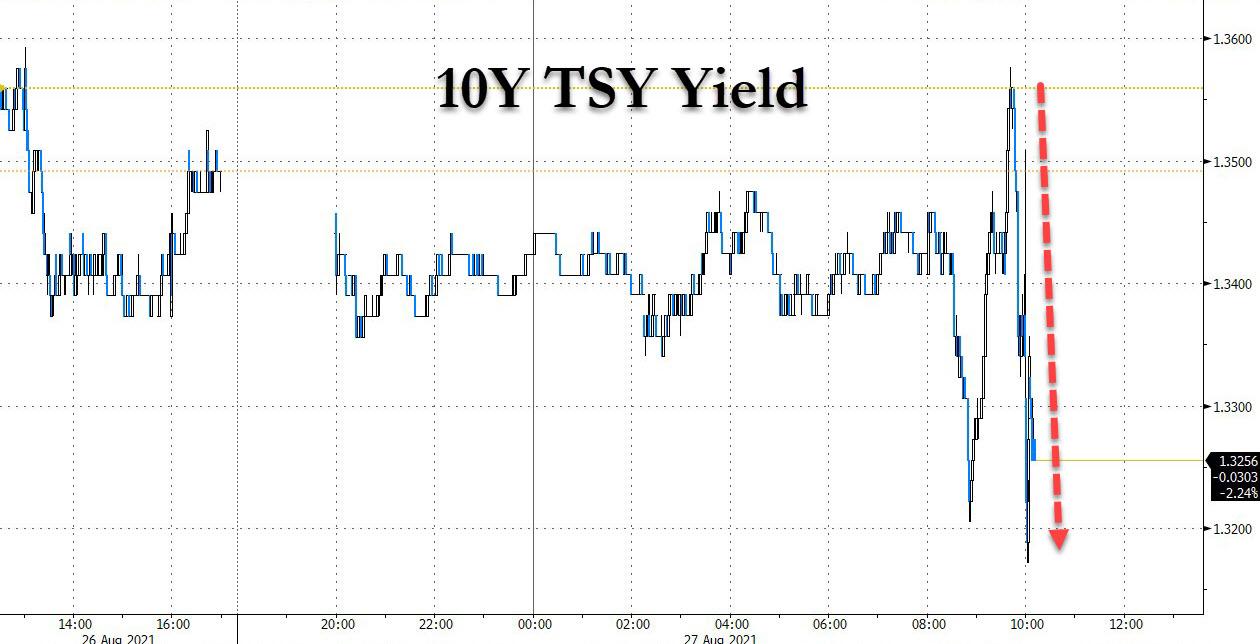
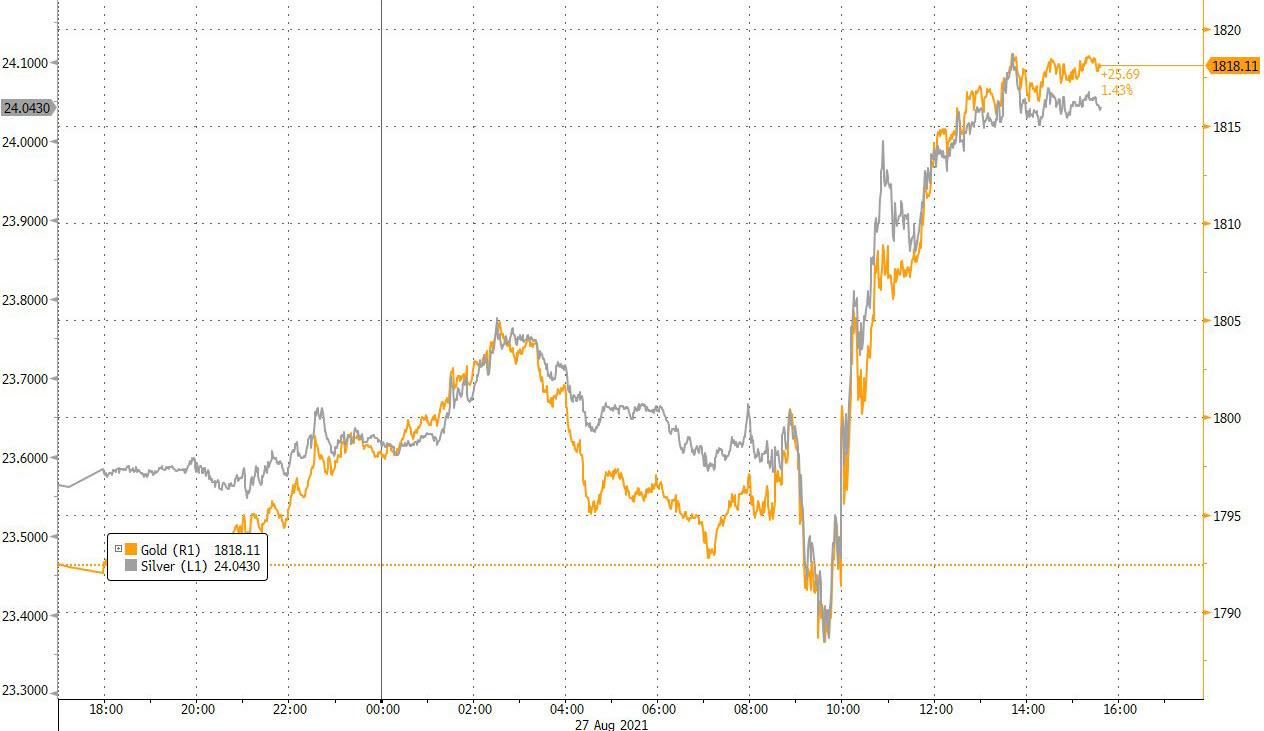
The US Dollar took a dive and lost -0.42%, joining bond yields with the 10-year collapsing to 1.31%. This combination gave a huge boost to gold, which added an impressive +1.47% and solidified its position above its $1,800 level.
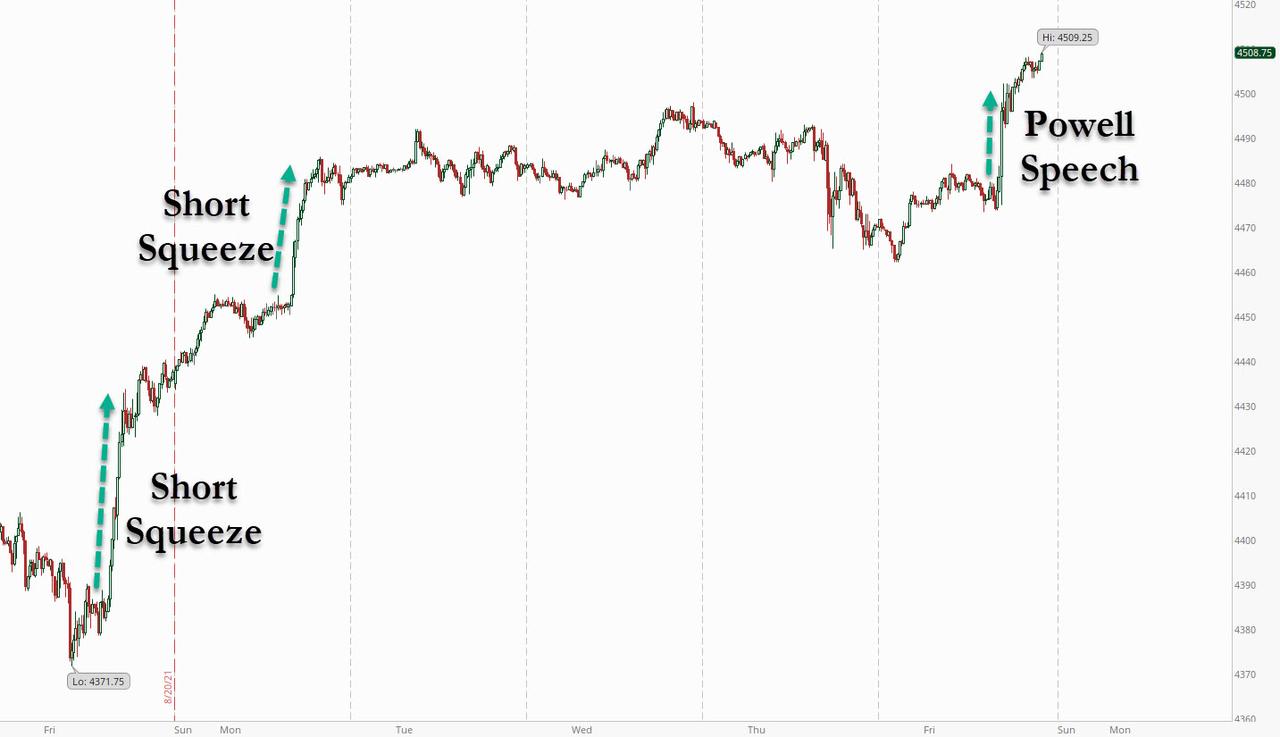
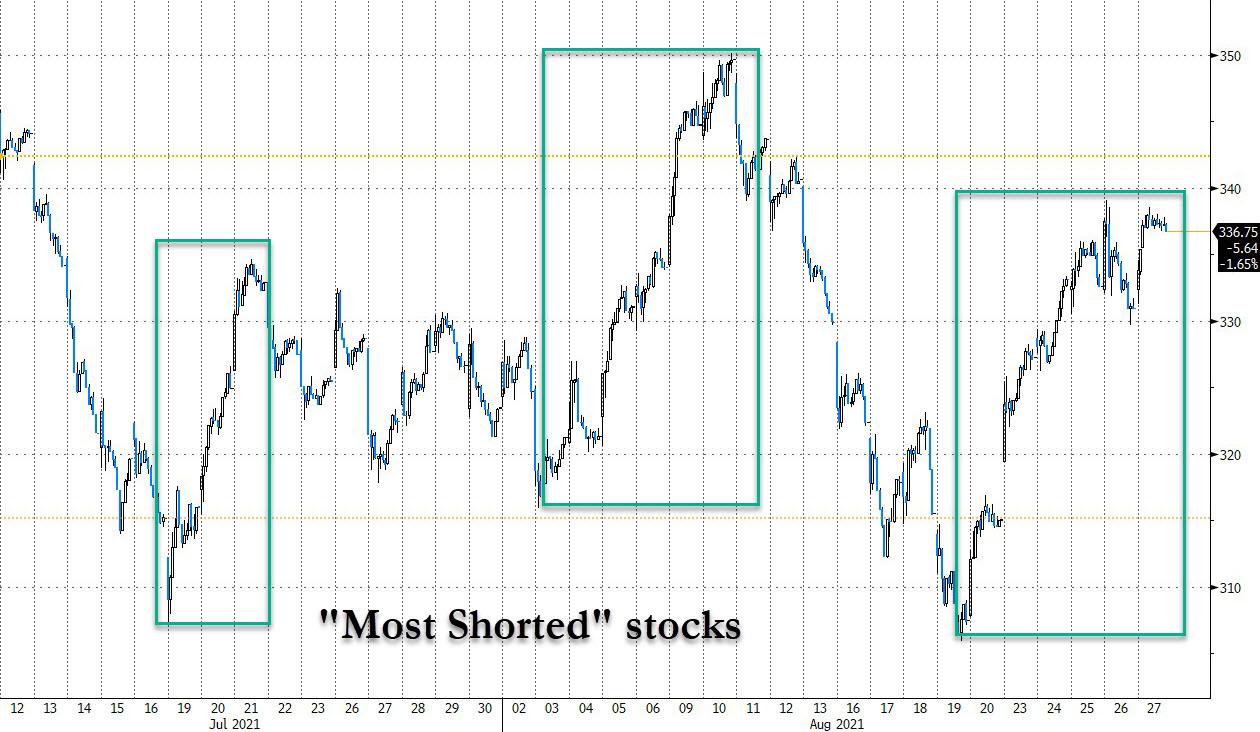
While Powell’s statement was the main driver behind today’s “Rip-A-Thon,” let’s not forget that the third short squeeze in a month made its presence felt as well, as Zero Hege noted.
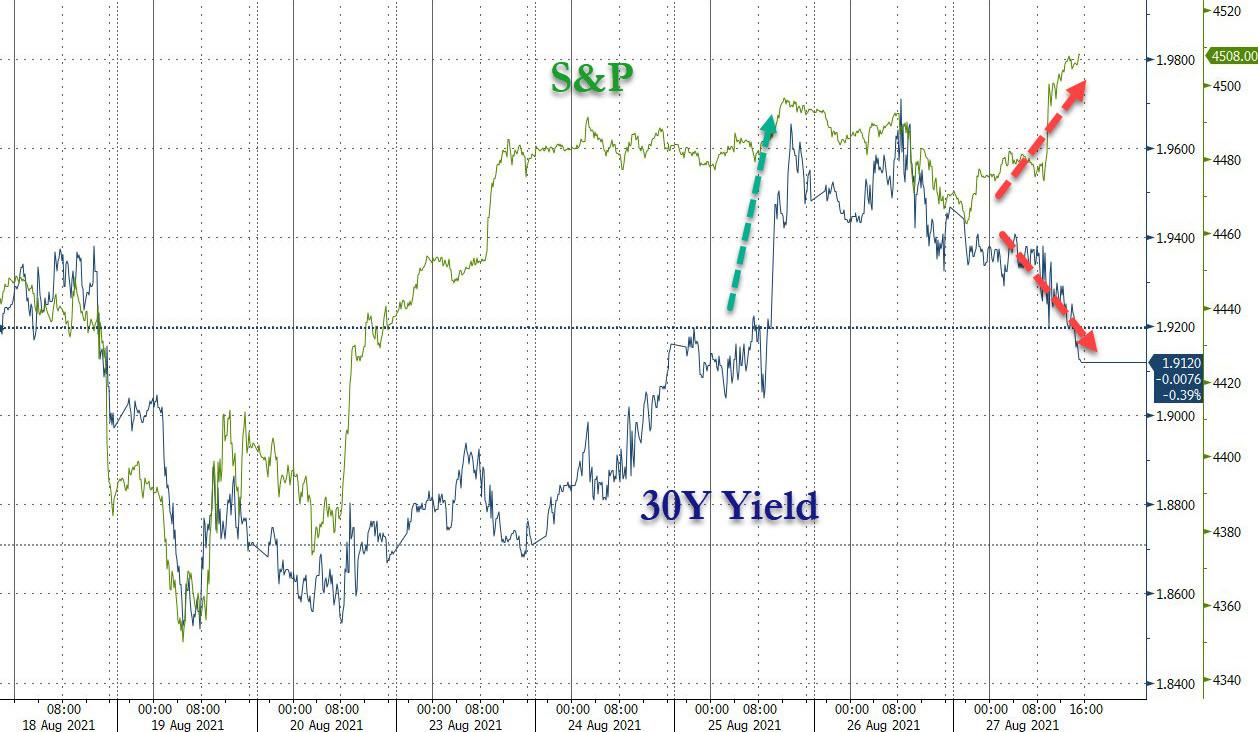
The recoupling of the S&P 500 with the 30-year yield over the past couple of days broke down during this session, and I find myself wondering which way the eventual sync-up will turn out. Will the S&P close the divergence by snapping down to the yield, or will it be the other way again?
Next week, I have a change to my posting schedule, which you can view here.
2. ETFs in the Spotlight
In case you missed the announcement and description of this section, you can 8 again.
It features some of the 10 broadly diversified domestic and sector ETFs from my HighVolume list as posted every Saturday. Furthermore, they are screened for the lowest MaxDD% number meaning they have been showing better resistance to temporary sell offs than all others over the past year.
The below table simply demonstrates the magnitude with which these ETFs are fluctuating above or below their respective individual trend lines (%+/-M/A). A break below, represented by a negative number, shows weakness, while a break above, represented by a positive percentage, shows strength.
For hundreds of ETF choices, be sure to reference Thursday’s StatSheet.
For this current domestic “Buy” cycle, here’s how some our candidates have fared:
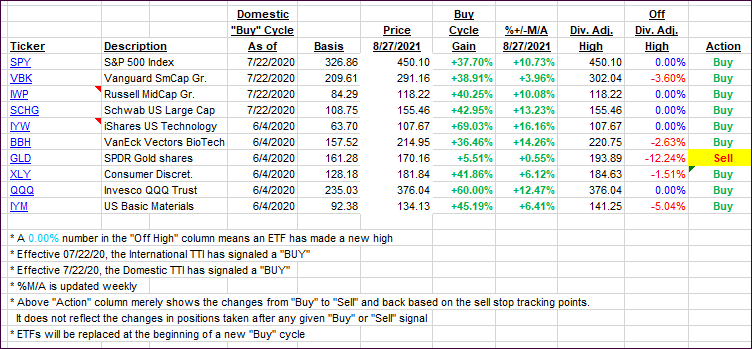
Click image to enlarge.
Again, the %+/-M/A column above shows the position of the various ETFs in relation to their respective long-term trend lines, while the trailing sell stops are being tracked in the “Off High” column. The “Action” column will signal a “Sell” once the -8% point has been taken out in the “Off High” column. For more volatile sector ETFs, the trigger point is -10%.
3. Trend Tracking Indexes (TTIs)
Our TTIs joined today’s Fed fest, as dovishness ramped all markets higher.
This is how we closed 08/27/2021:
Domestic TTI: +10.14% above its M/A (prior close +9.63%)—Buy signal effective 07/22/2020.
International TTI: +5.79% above its M/A (prior close +5.40%)—Buy signals effective 07/22/2020.
Disclosure: I am obliged to inform you that I, as well as my advisory clients, own some of the ETFs listed in the above table. Furthermore, they do not represent a specific investment recommendation for you, they merely show which ETFs from the universe I track are falling within the specified guidelines.
All linked charts above are courtesy of Bloomberg via ZeroHedge.
———————————————————-
WOULD YOU LIKE TO HAVE YOUR INVESTMENTS PROFESSIONALLY MANAGED?
Do you have the time to follow our investment plans yourself? If you are a busy professional who would like to have his portfolio managed using our methodology, please contact me directly or get more details here.
Contact Ulli