
- Moving the markets
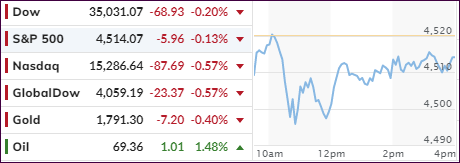
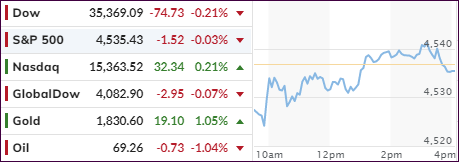
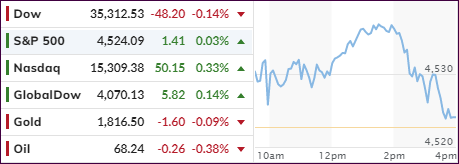
It was a third day in a row of red numbers for the Dow and S&P 500 with the indicators meandering and looking for a base to support the bullish theme. While the three major indexes bounced off the lows for the day, it was not enough to instill confidence in the bears returning the baton back to the bulls.
The economic outlook was foremost on traders’ minds, but since we are in September, known to be one of the most volatile months of the year, more bumpiness may be in the cards. Questionable growth prospects combined with Fed policy, as well as the legislative agendas (cough debt ceiling, cough), may keep buyers in check.
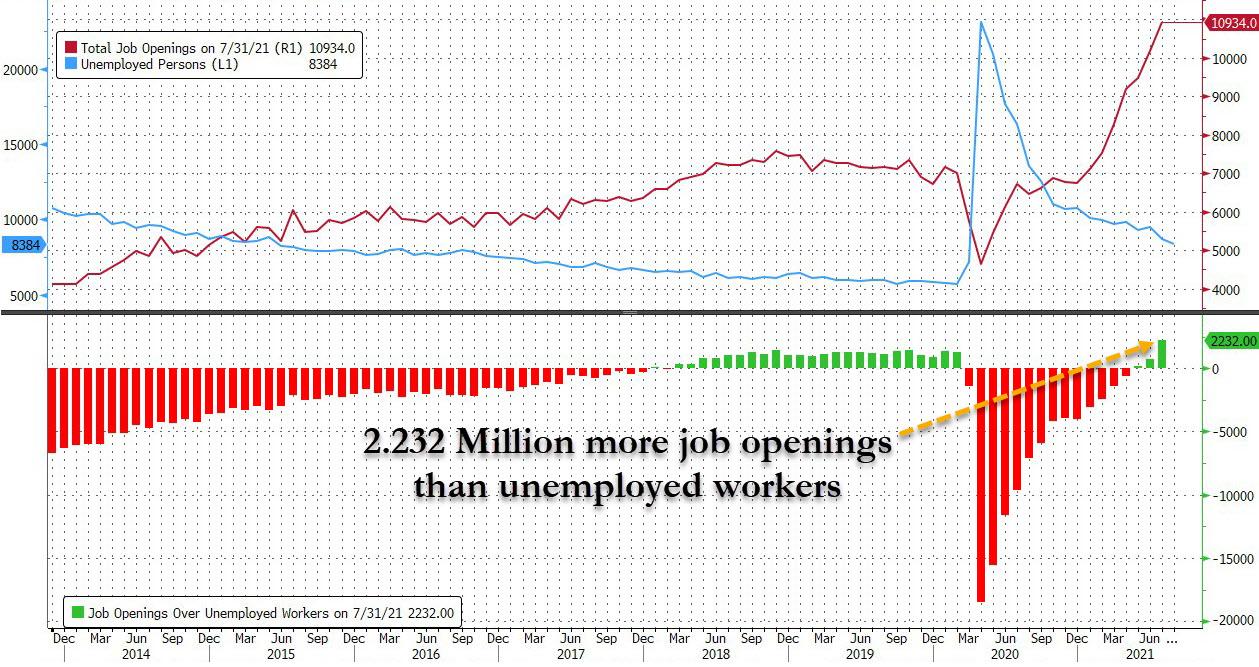
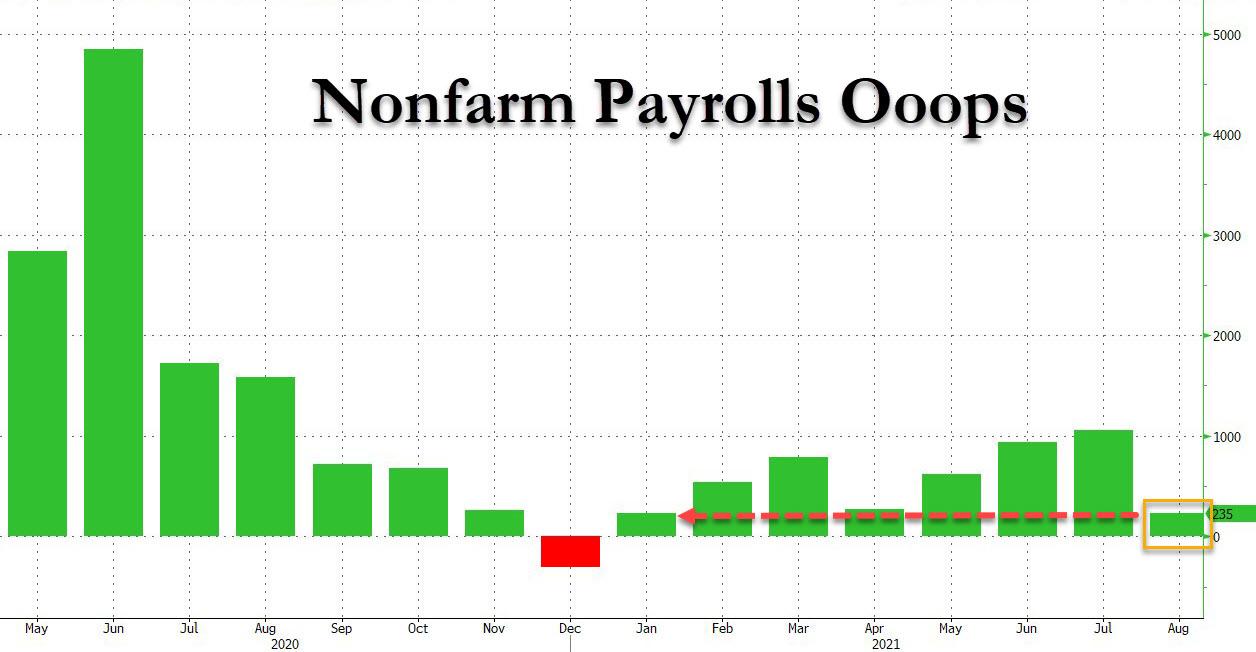
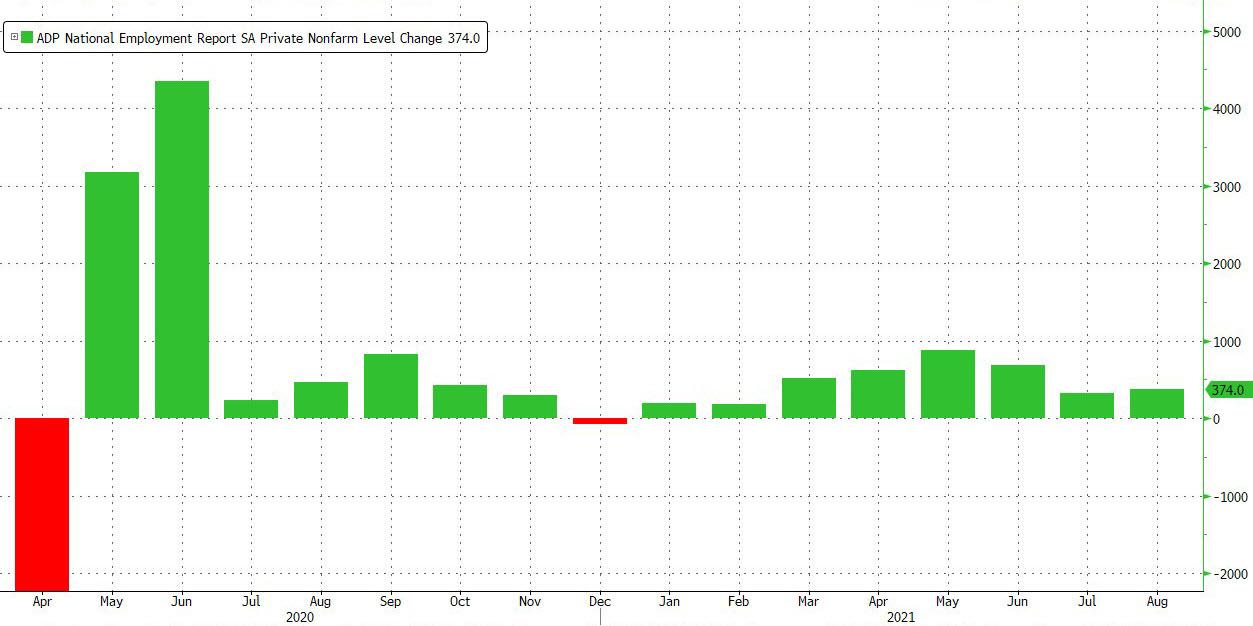
Adding to that the insanity, as ZeroHege called it, that there are now a record 2.2 million more job openings than unemployed workers, makes you scratch your head wondering what kind of an upside-down world we are living in.
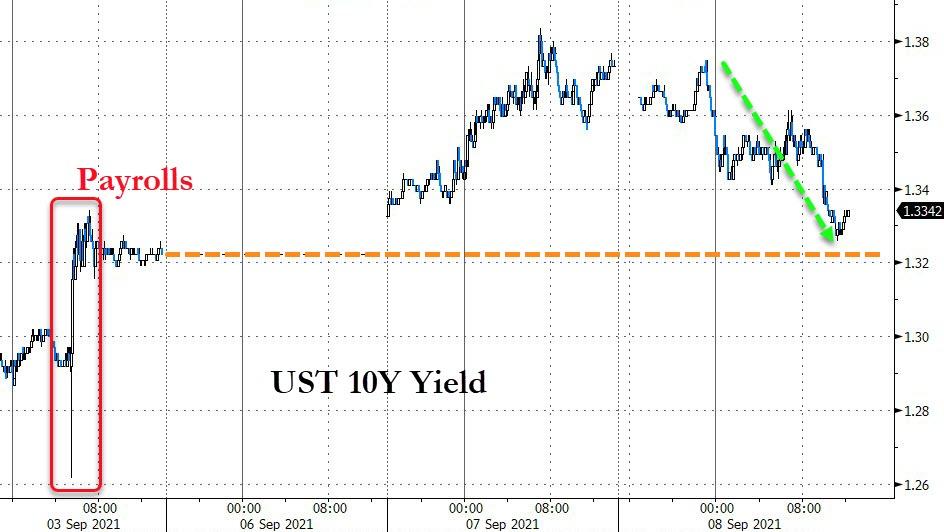
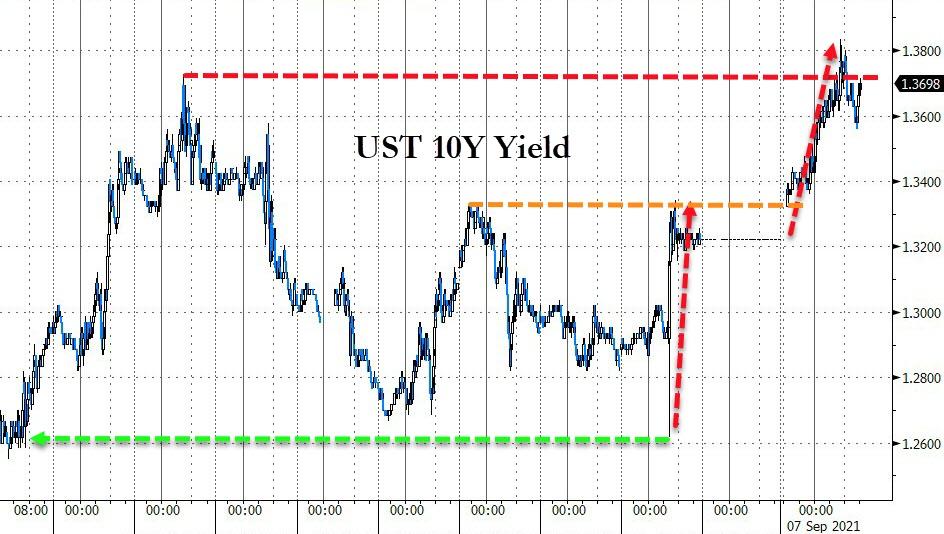
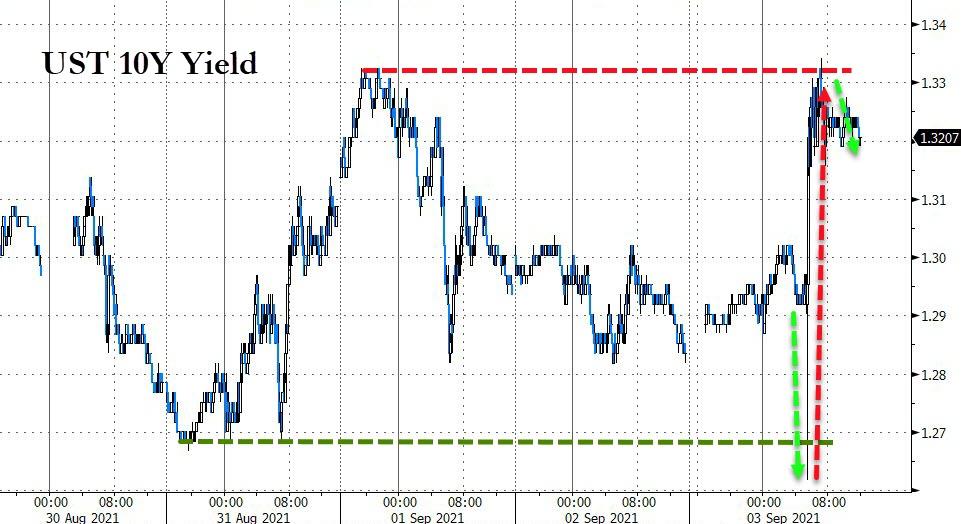
Bonds did well, with yields dropping, as the 10-year auction went better than expected with their yield moving back to unchanged for the week.
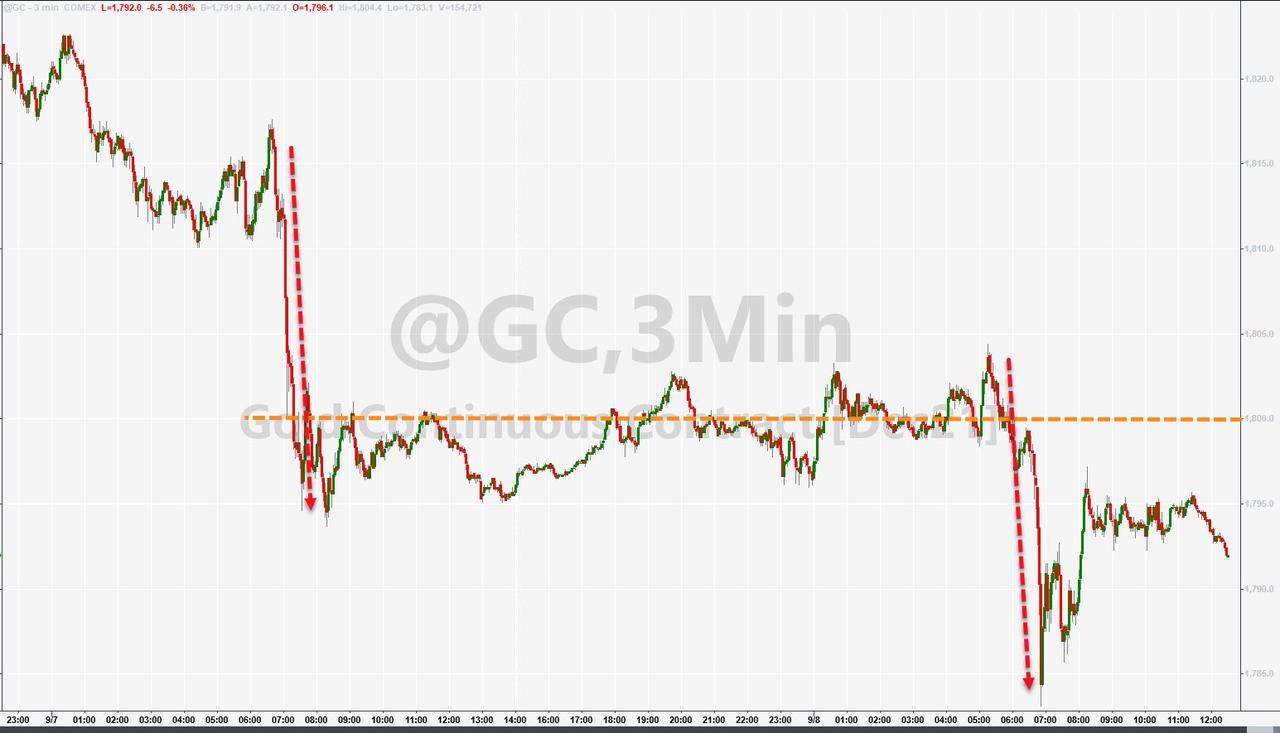
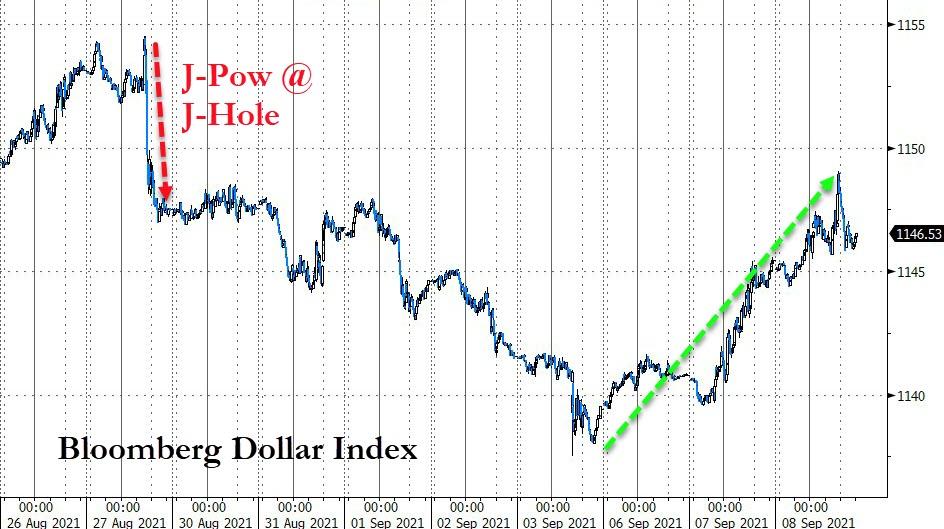
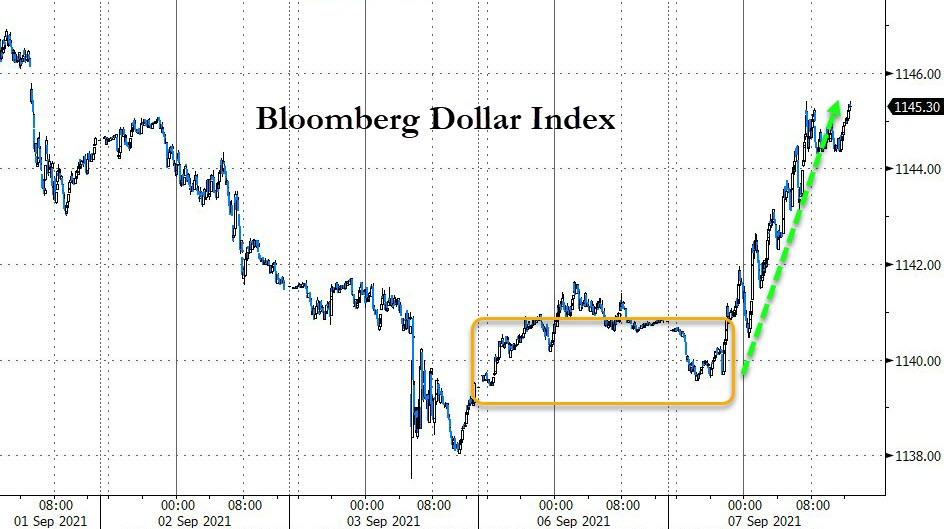
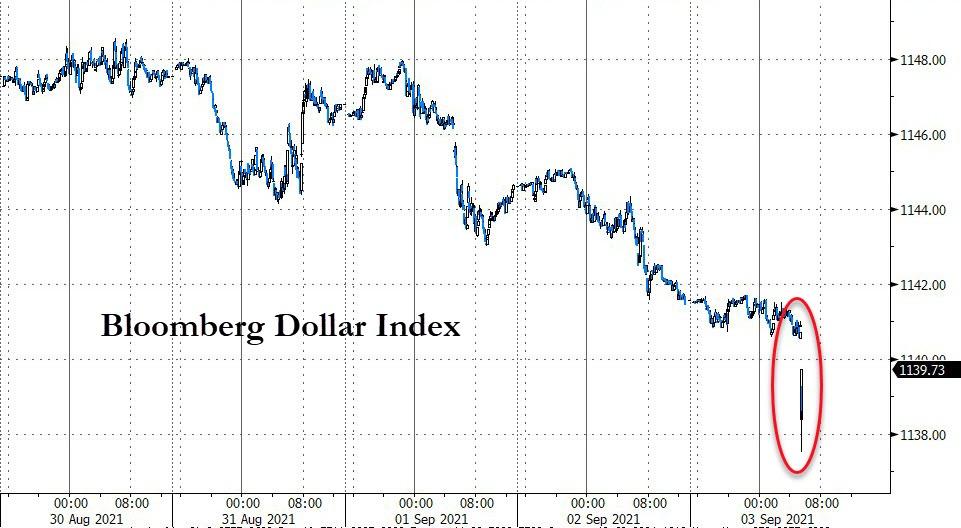
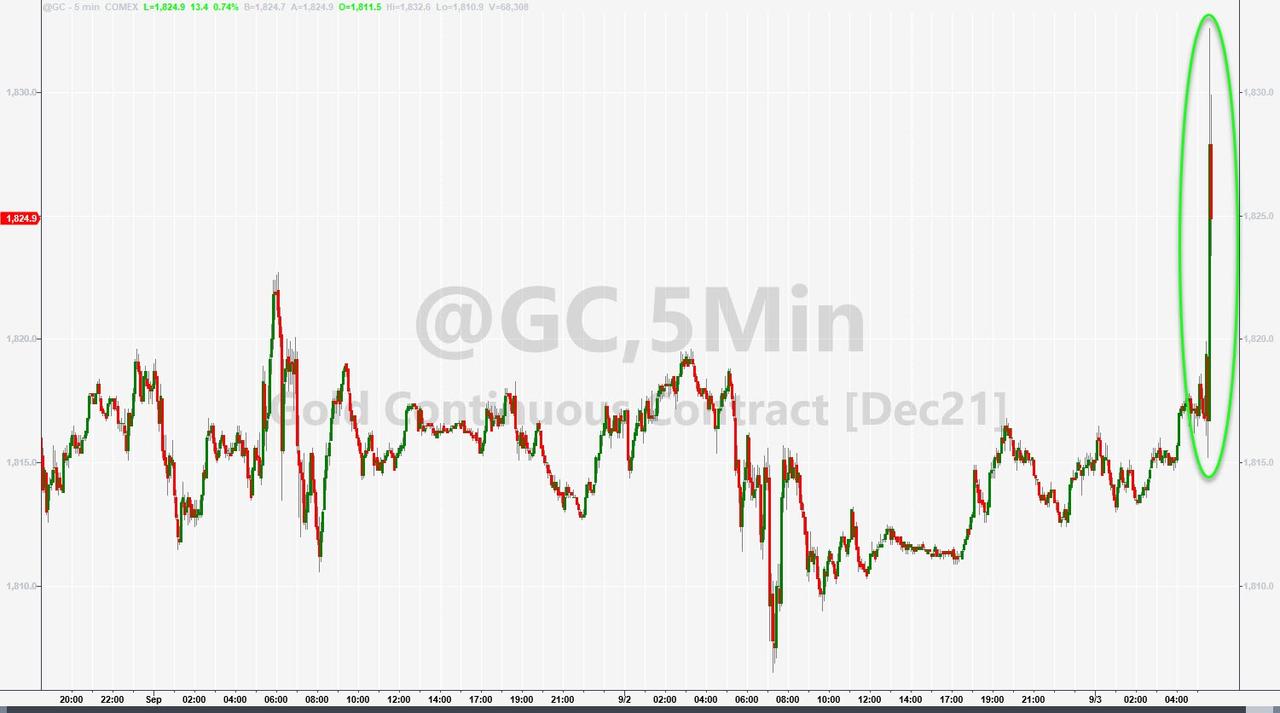
That should have given Gold an assist, but it was prevented by the US Dollar continuing to surge mid-session but giving up some of its gains at the close.
In the end, the losses for the major indexes were minor, but it remains unclear whether there is more downside to come. Your guess is as good as mine.
Read More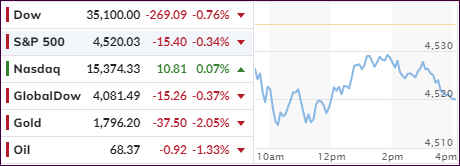
