
ETF Tracker StatSheet
You can view the latest version here.
REALITY DOMINATES OPTIMISM
- Moving the markets
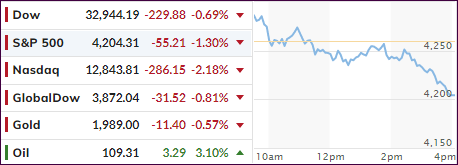
Optimistic traders, who followed the latest firehose of news headlines and pushed the major indexes higher at the opening, had to face reality eventually, because actual happenings erased the early enthusiasm.
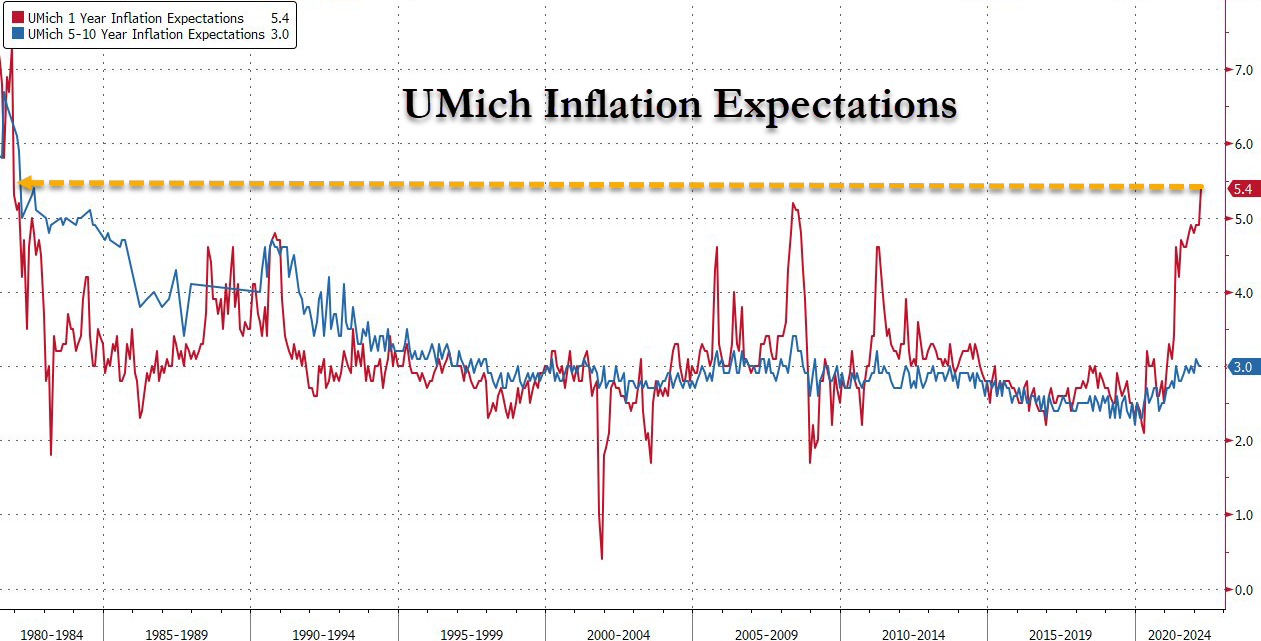
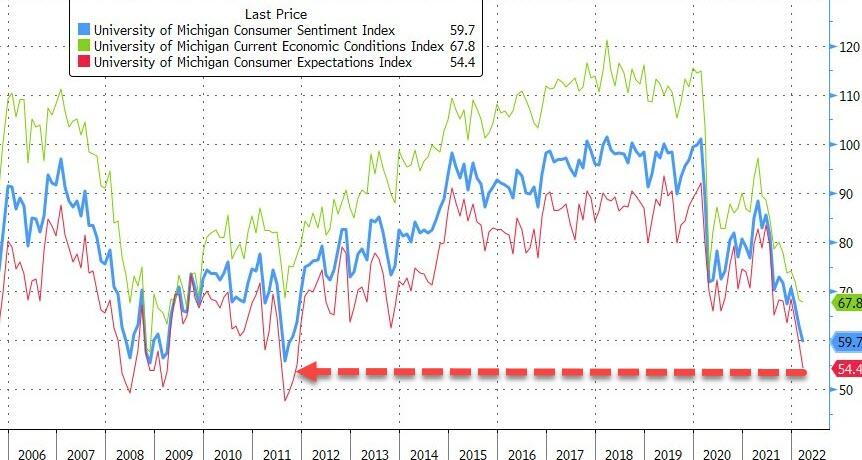
Not helping matters was the fact that the number of unhappy Americans had increased, as measured by the US Sentiment index. Joined by current economic conditions and inflation expectations, the numbers dropped to lows last seen in 2011, as this chart by Bloomberg shows.
That translated into another early rally biting the dust with the Dow notching its 5th straight week of losses due to the Russia-Ukraine war uncertainties keeping the bears in charge.
Added MarketWatch:
Russian President Vladimir Putin said Friday “certain positive shifts” have occurred in the talks between the Kremlin and Ukraine, however, a ceasefire has not been negotiated. Meanwhile, President Volodymyr Zelenskyy reportedly said Ukraine has reached a “strategic turning point” in its war with Russia.
In other words, nothing has been resolved and the adage that “hope is not an investment strategy” was validated again. For the week, the Dow lost 2%, the S&P 500 dropped 2.9%, and the Nasdaq fared the worst by giving back 3.5%.
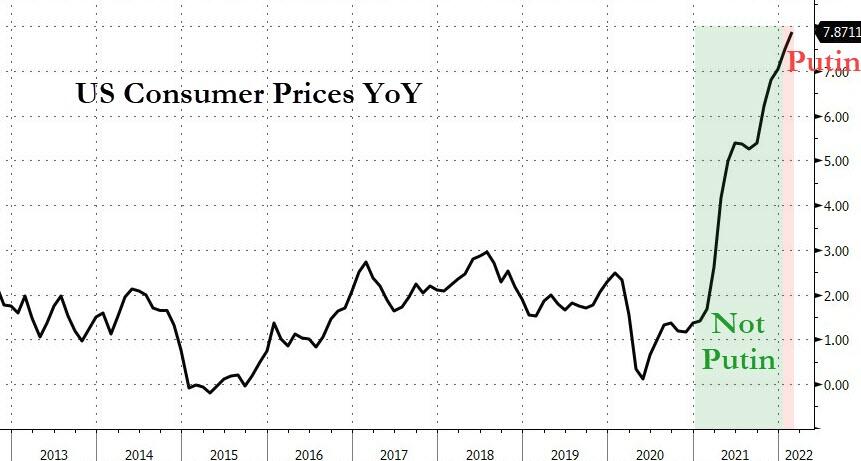
Some biased news reports are now pushing the narrative that YoY consumer price increases were Putin’s fault, a notion that was quickly dismissed and supported by this chart.
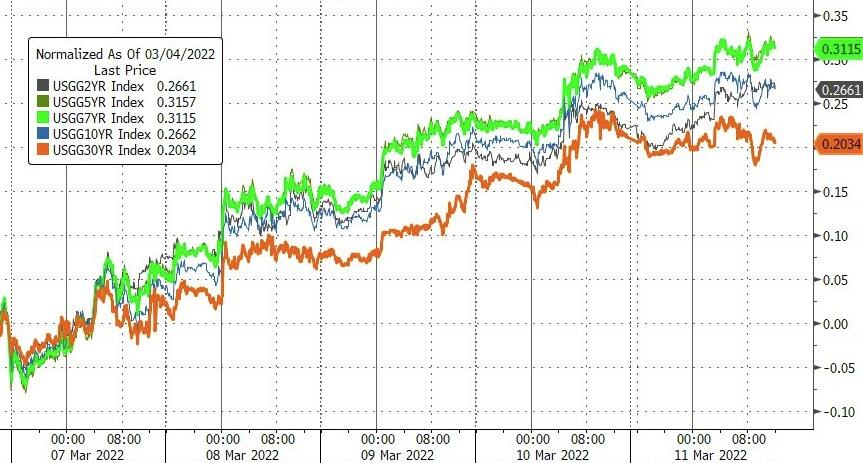
While bond yields soared in Europe all week, the situation was not much better here in the US, where yields as well spiked higher thereby causing bond prices to crumble. This turned into a nightmare for those holding bonds to offset equity weakness, a theory that has bit the dust on many occasions in the recent past.
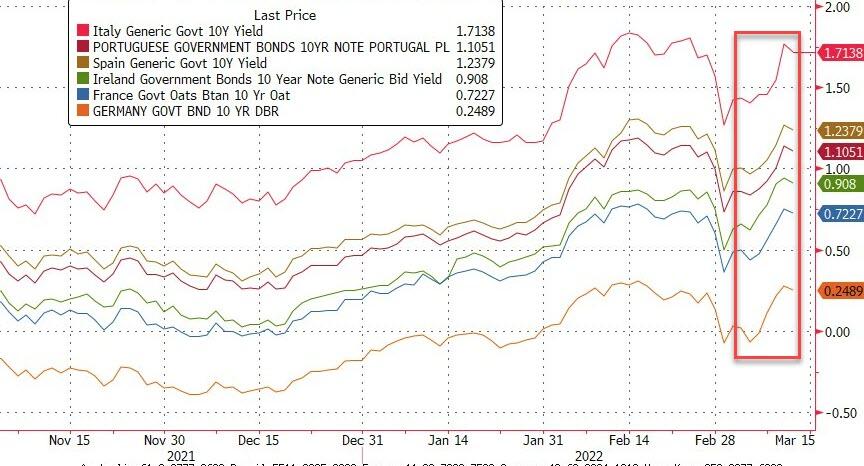
Gold slipped early on, rebounded but still lost its $2k level by a small margin, but it remains the real “safe haven” once again, as negative yielding debt worldwide is simply not the place to be.
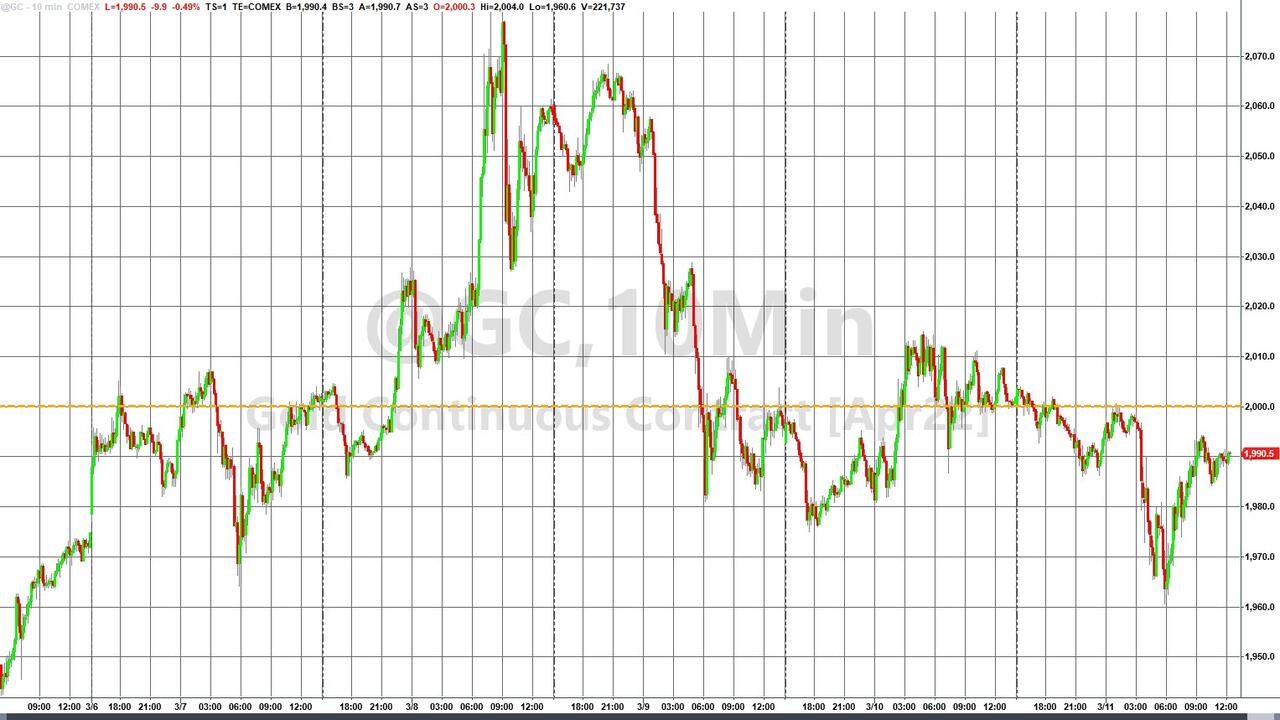
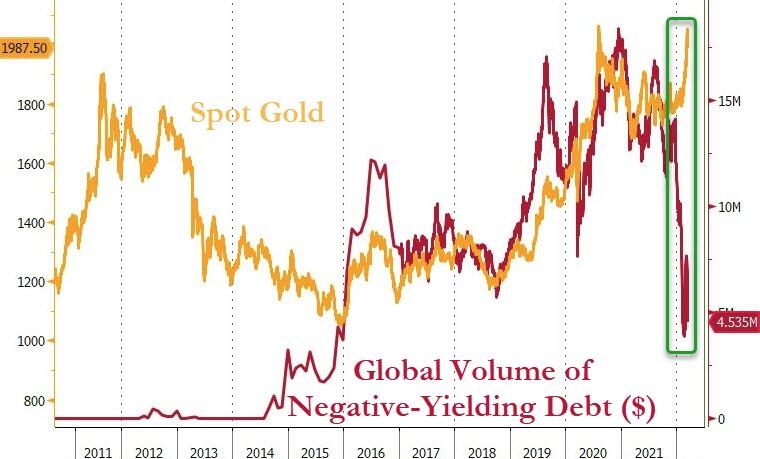
After all, would you loan someone $100, with him promising to pay you back $98? That’s what negative yielding debt translates into.
2. ETFs in the Spotlight
In case you missed the announcement and description of this section, you can read it here again.
It features some of the 10 broadly diversified domestic and sector ETFs from my HighVolume list as posted every Saturday. Furthermore, they are screened for the lowest MaxDD% number meaning they have been showing better resistance to temporary sell offs than all others over the past year.
The below table simply demonstrates the magnitude with which these ETFs are fluctuating above or below their respective individual trend lines (%+/-M/A). A break below, represented by a negative number, shows weakness, while a break above, represented by a positive percentage, shows strength.
For hundreds of ETF choices, be sure to reference Thursday’s StatSheet.
For this just closed-out domestic “Buy” cycle, here’s how some of our candidates have fared:
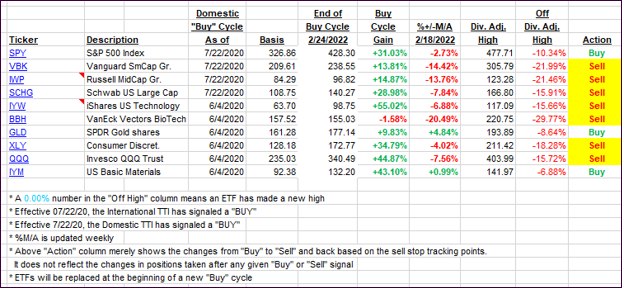
Click image to enlarge.
Again, the %+/-M/A column above shows the position of the various ETFs in relation to their respective long-term trend lines, while the trailing sell stops are being tracked in the “Off High” column. The “Action” column will signal a “Sell” once the -12% point has been taken out in the “Off High” column, which has replaced the prior -8% to -10% limits.
3. Trend Tracking Indexes (TTIs)
Our TTIs dumped again as the broad market sold off into the close.
This is how we closed 03/11/2022:
Domestic TTI: -3.38% below its M/A (prior close -2.37%)—Sell signal effective 02/24/2022.
International TTI: -4.60% below its M/A (prior close -4.04%)—Sell signal effective 03/08/2022.
Disclosure: I am obliged to inform you that I, as well as my advisory clients, own some of the ETFs listed in the above table. Furthermore, they do not represent a specific investment recommendation for you, they merely show which ETFs from the universe I track are falling within the specified guidelines.
All linked charts above are courtesy of Bloomberg via ZeroHedge.
———————————————————-
WOULD YOU LIKE TO HAVE YOUR INVESTMENTS PROFESSIONALLY MANAGED?
Do you have the time to follow our investment plans yourself? If you are a busy professional who would like to have his portfolio managed using our methodology, please contact me directly or get more details.
Contact Ulli