
- Moving the markets
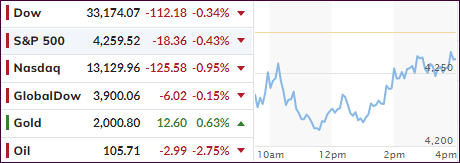
Another crazy day on Wall Street had equities swinging wildly, although with reduced magnitude. In the end, the major indexes crawled back but failed to reach their respective unchanged lines.
Every directional turn appears to be headline driven, as the bulls and bears continue to slug it out. Failed peace talks between Russia and the Ukraine caused the potential global economic fallout to move to front and center again thereby putting a damper on the bullish meme.
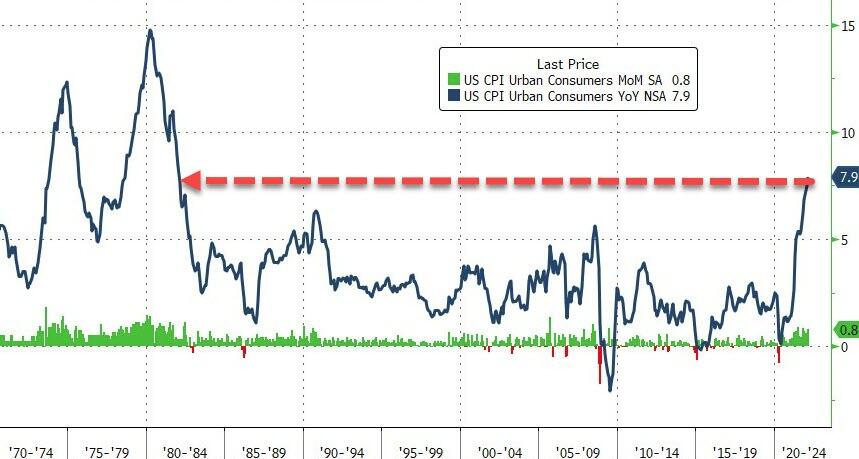
Consumer prices rose at their fastest pace in over 40 years, as ZH reported, with the headline print coming in at the expected +7.9% YoY. That is the highest reading since January 1982 and is also the 21st straight month of increases in consumer prices. So much for inflation being transitory.
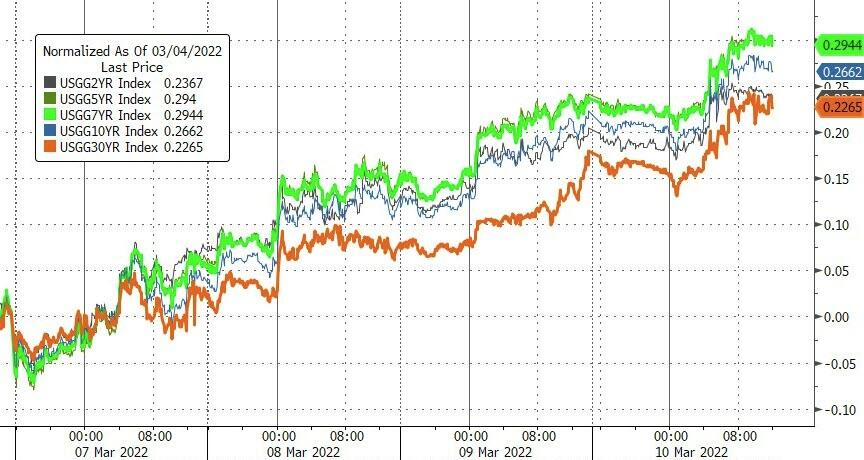
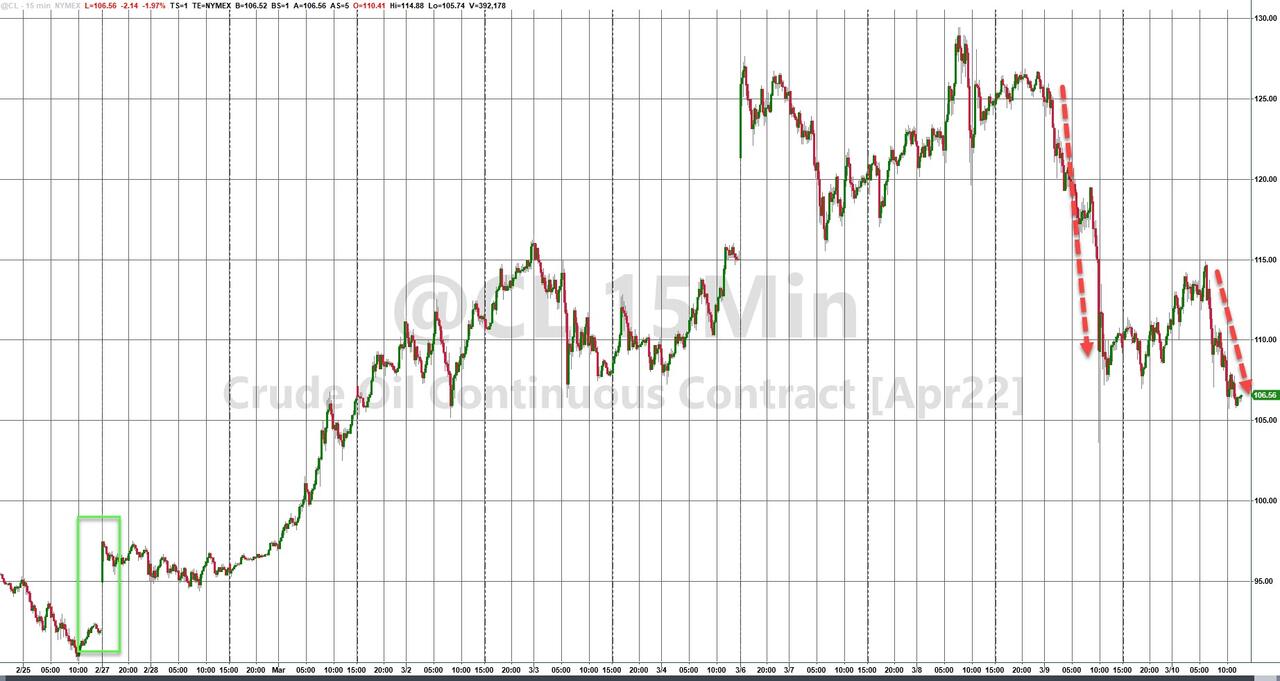
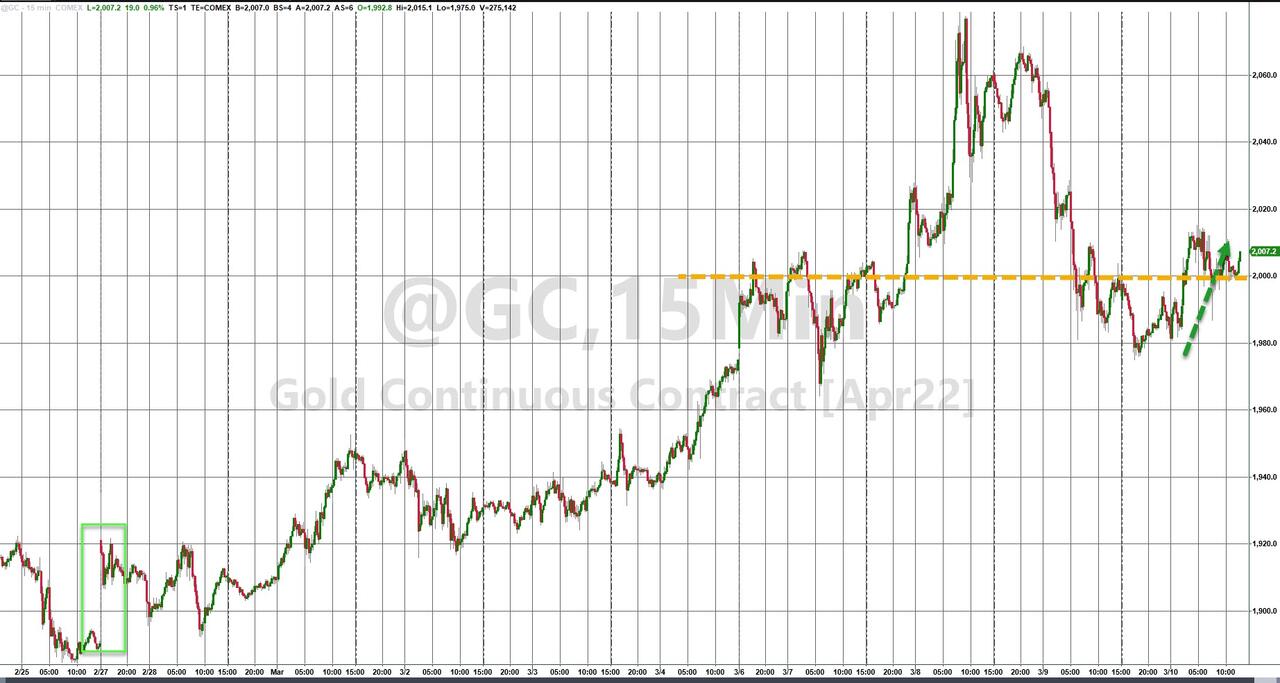
Bonds extended their losses, as yields spiked, with the 10-year again approaching the 2% level. The US Dollar went sideways but surged into the close, Crude Oil slipped for the second day, but gold found some footing to recapture the $2k price level.
Volatility is here to stay, which means wild rides on Wall Street may become the standard rather than the exception.
2. ETFs in the Spotlight
In case you missed the announcement and description of this section, you can read it here again.
It features some of the 10 broadly diversified domestic and sector ETFs from my HighVolume list as posted every Saturday. Furthermore, they are screened for the lowest MaxDD% number meaning they have been showing better resistance to temporary sell offs than all others over the past year.
The below table simply demonstrates the magnitude with which these ETFs are fluctuating above or below their respective individual trend lines (%+/-M/A). A break below, represented by a negative number, shows weakness, while a break above, represented by a positive percentage, shows strength.
For hundreds of ETF choices, be sure to reference Thursday’s StatSheet.
For this just closed-out domestic “Buy” cycle, here’s how some of our candidates have fared:
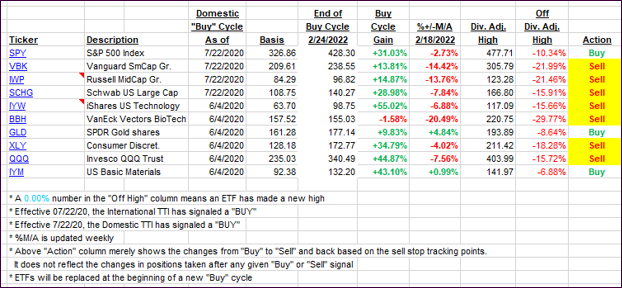
Click image to enlarge.
Again, the %+/-M/A column above shows the position of the various ETFs in relation to their respective long-term trend lines, while the trailing sell stops are being tracked in the “Off High” column. The “Action” column will signal a “Sell” once the -12% point has been taken out in the “Off High” column, which has replaced the prior -8% to -10% limits.
3. Trend Tracking Indexes (TTIs)
Our TTIs slipped with the overall market.
This is how we closed 03/10/2022:
Domestic TTI: -2.37% below its M/A (prior close -2.18%)—Sell signal effective 02/24/2022.
International TTI: -4.04% below its M/A (prior close -3.83%)—Sell signal effective 03/08/2022.
Disclosure: I am obliged to inform you that I, as well as my advisory clients, own some of the ETFs listed in the above table. Furthermore, they do not represent a specific investment recommendation for you, they merely show which ETFs from the universe I track are falling within the specified guidelines.
All linked charts above are courtesy of Bloomberg via ZeroHedge.
Contact Ulli