

- Moving the markets
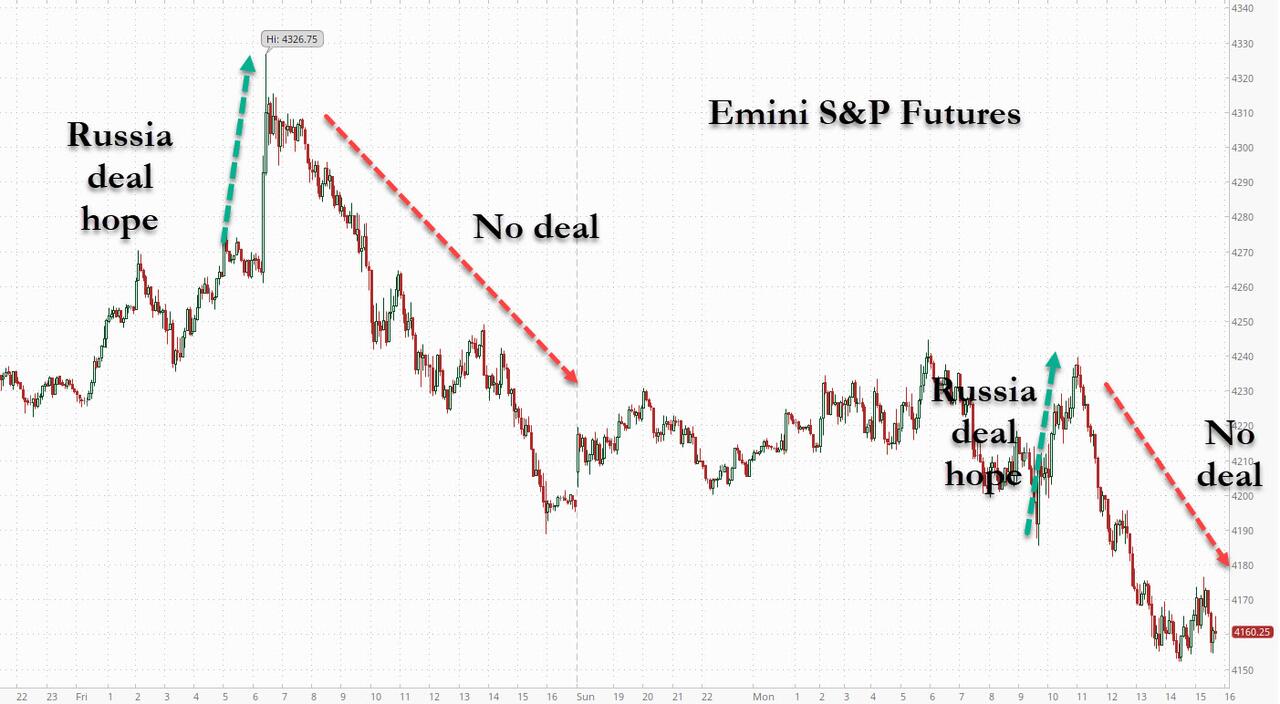
As we’ve seen recently with almost regular frequency, early rallies suddenly reversed, got wiped out and turned into losses. Today was no exception when a 300-point surge in the Dow hit the skids, and south we went. The Nasdaq took the biggest hit with a -2.04% loss.
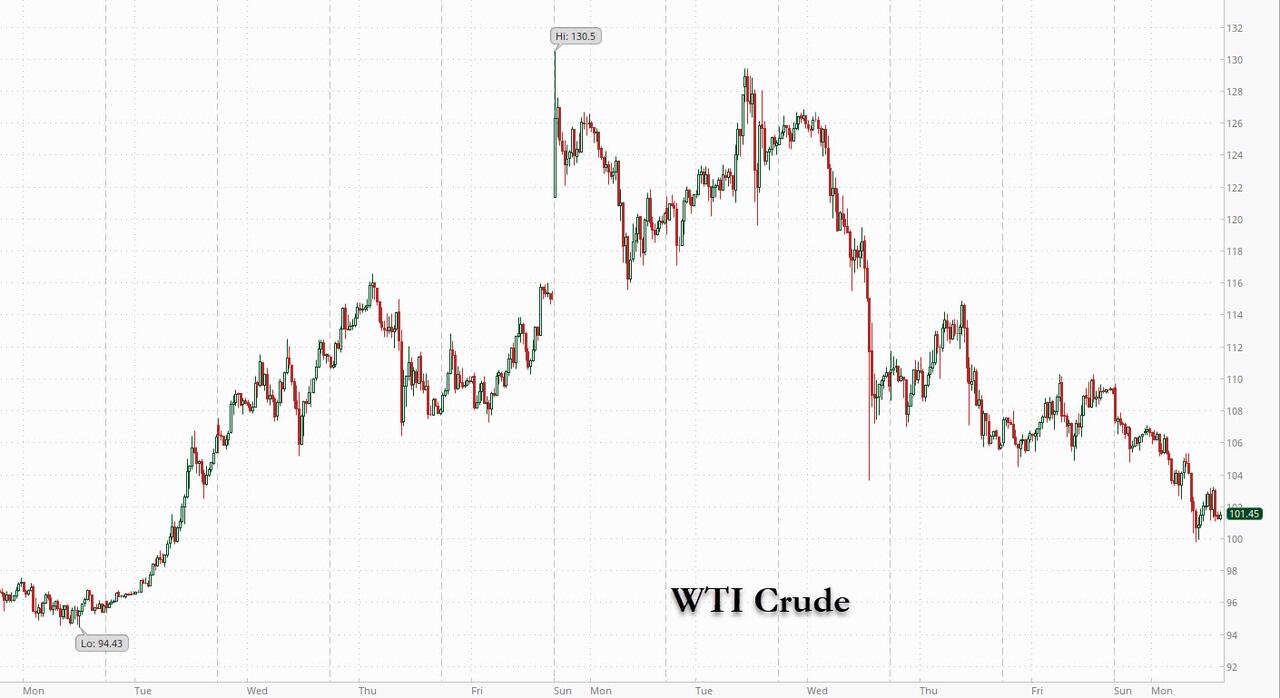
Oil, commodities, and gold gave back recent gains even as uncertainty reigned yet hope of a possible oil trading arrangement by an American company with Venezuela (yes, that sanctioned Venezuela) was said to potentially provide relief.
Be that as it may, markets overall continued to be in disarray with a crazy week on deck, as ZeroHedge pointed out:
A Fed rate hike, a Russian default, a meeting between the US and China, even more sanctions against Russia, the first double-digit (10%) PPI print in decades, a big drop in retail sales, a freak surge in covid across China, oh and a $3.3 trillion notional option expiration on Friday and all happening with liquidity at record lows. Yes, this week will be insane.
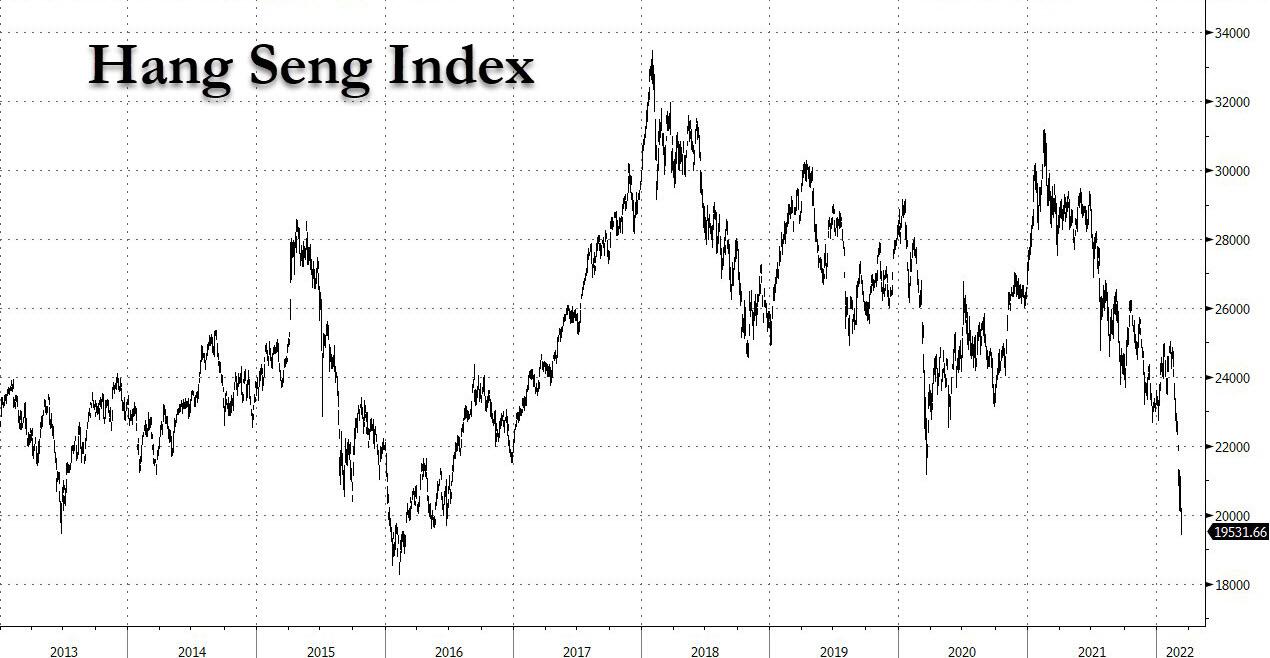
China’s stock market had its worst day in 6 years, in part due to its chummy relationship with Russia, a surge in Covid cases, including a lockdown, and regulatory issues.
Apple took a hit and dropped below its 200-day M/A, as traders worried about the shutdown of the Shenzhen Foxconn factory, which could lead to another supply chain shock for the world’s largest company.
For sure, gold turned out not to be a “safe haven”, at least not for today, as the precious metal got spanked and lost -1.5%.
Bond yields soared, as prices crashed, with the 10-year rallying over 14 bps to close at 2.14%, ahead of the Fed meeting in 2 days. The markets are now expecting 7 rate hikes, due to the inflation tsunami which, if implemented, will translate into enormous distress for stocks going forward.
2. ETFs in the Spotlight
In case you missed the announcement and description of this section, you can read it here again.
It features some of the 10 broadly diversified domestic and sector ETFs from my HighVolume list as posted every Saturday. Furthermore, they are screened for the lowest MaxDD% number meaning they have been showing better resistance to temporary sell offs than all others over the past year.
The below table simply demonstrates the magnitude with which these ETFs are fluctuating above or below their respective individual trend lines (%+/-M/A). A break below, represented by a negative number, shows weakness, while a break above, represented by a positive percentage, shows strength.
For hundreds of ETF choices, be sure to reference Thursday’s StatSheet.
For this just closed-out domestic “Buy” cycle, here’s how some of our candidates have fared:
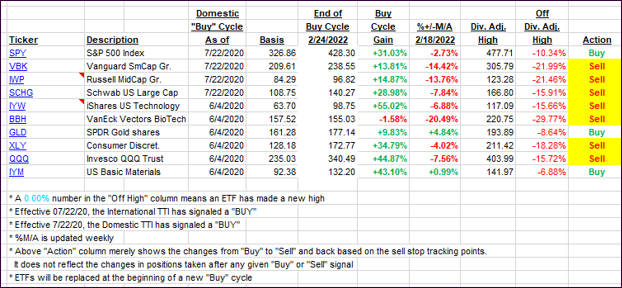
Click image to enlarge.
Again, the %+/-M/A column above shows the position of the various ETFs in relation to their respective long-term trend lines, while the trailing sell stops are being tracked in the “Off High” column. The “Action” column will signal a “Sell” once the -12% point has been taken out in the “Off High” column, which has replaced the prior -8% to -10% limits.
3. Trend Tracking Indexes (TTIs)
Our TTIs slipped deeper into bearish territory, as an early rip turned into a late session dip.
This is how we closed 03/14/2022:
Domestic TTI: -3.74% below its M/A (prior close -3.38%)—Sell signal effective 02/24/2022.
International TTI: -4.64% below its M/A (prior close -4.60%)—Sell signal effective 03/08/2022.
Disclosure: I am obliged to inform you that I, as well as my advisory clients, own some of the ETFs listed in the above table. Furthermore, they do not represent a specific investment recommendation for you, they merely show which ETFs from the universe I track are falling within the specified guidelines.
All linked charts above are courtesy of Bloomberg via ZeroHedge.
Contact Ulli