
- Moving the markets
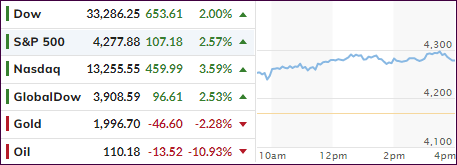
It had to happen eventually, and today was the day. After 4 days of taking a beating, equities finally found a reason to rally, as questionable as it may turn out to be.
One analyst linked it to the adage “buy the rumor, sell the fact,” but in this case it turned into “buy the Ukraine speculation, sell the lack of follow through,” however, we will have to wait and see if the latter part materializes.
Headlines went into overdrive with Bloomberg reporting this:
*AIDE TO ZELENSKIY SAYS UKRAINE READY FOR DIPLOMATIC SOLUTION
That was followed by some dampening of the initial euphoria:
*UKRAINE’S ZHOVKVA: WON’T TRADE `SINGLE INCH’ OF TERRITORIES
And finally, as ZH pointed out:
*UKRAINIAN AIDE: SEEK CLEAR RESPONSE TO EU APPLICATION
Which also seems like a dead end, because as JPMorgan said last night, “Ukraine is no longer insisting on NATO membership, though EU membership would give similar protections.”
Nevertheless, it was a session during which, no matter what happened, the bulls remained oblivious to anything bearish and made up for lost ground by recouping some of this week’s damages.
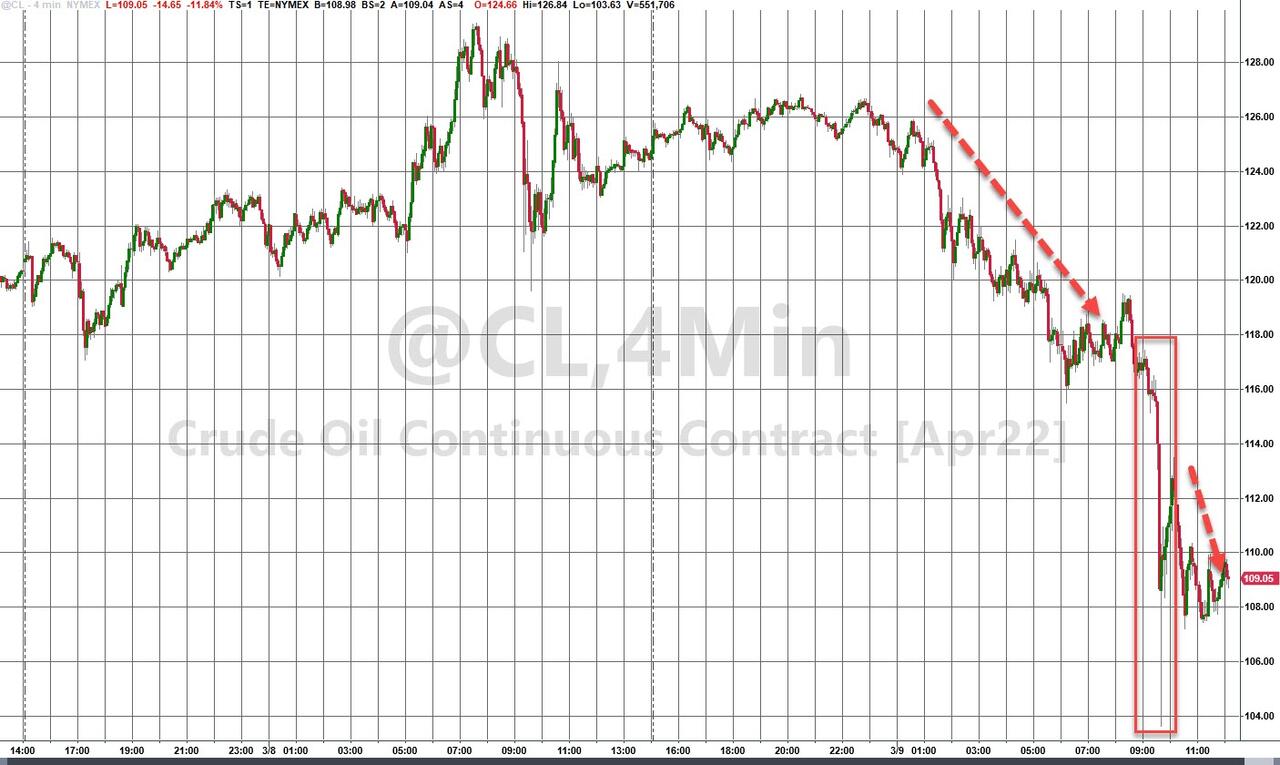
It was another wild ride, during which energy and commodities were hammered, after their recent bullish run, but both came off their intra-day lows by a strong margin. With higher oil prices and continued inflation, I expect this spanking to be a correction rather than a major directional trend change.
The dreaded “S” word, which I have repeatedly mentioned, remains in play with one hedge fund giant seeing it this way:
The way things are going now, $200 per barrel is a clear possibility, according to Jeffrey Gundlach from investment firm DoubleLine. Speaking to TIFIN, Gundlach said that oil is on its way to $200, and the Fed may be pressed to raise rates while the country is going into a recession, which, he noted, had never been done before. Gundlach also said it was time to admit the U.S. was going into stagflation, and the latest increase in gas prices was only the beginning of the pain.
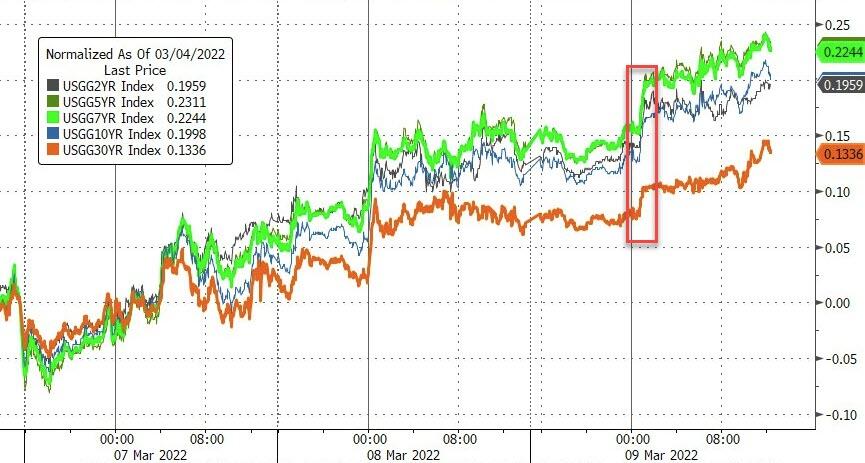
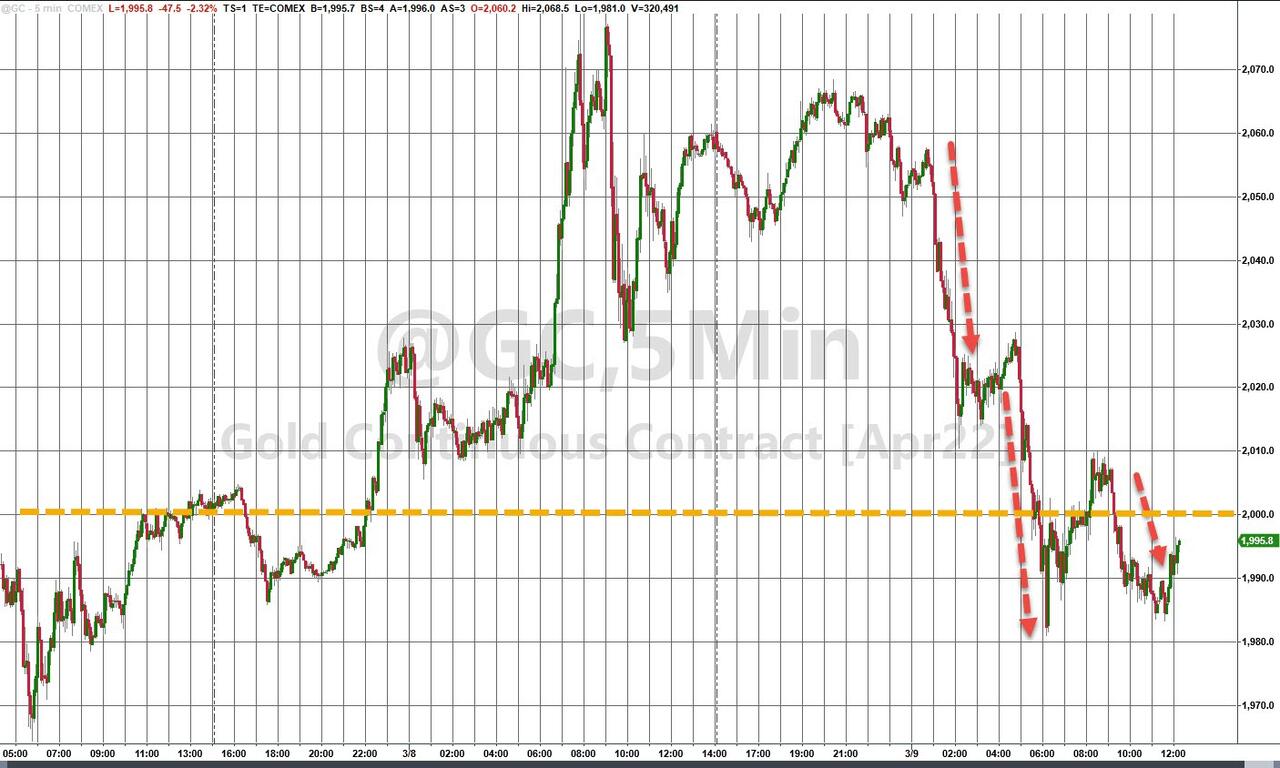
Safe havens like bonds were losers today, as yields spiked, while the recent performance hero, namely gold, was taken out to the barn and spanked, in process losing its $2k handle.
The madness on Wall Street continues. The Fed will try to manage a soft economic landing, the chances of which are just as great as their past announcement that inflation is “transitory.”
2. ETFs in the Spotlight
In case you missed the announcement and description of this section, you can read it here again.
It features some of the 10 broadly diversified domestic and sector ETFs from my HighVolume list as posted every Saturday. Furthermore, they are screened for the lowest MaxDD% number meaning they have been showing better resistance to temporary sell offs than all others over the past year.
The below table simply demonstrates the magnitude with which these ETFs are fluctuating above or below their respective individual trend lines (%+/-M/A). A break below, represented by a negative number, shows weakness, while a break above, represented by a positive percentage, shows strength.
For hundreds of ETF choices, be sure to reference Thursday’s StatSheet.
For this just closed-out domestic “Buy” cycle, here’s how some of our candidates have fared:

Click image to enlarge.
Again, the %+/-M/A column above shows the position of the various ETFs in relation to their respective long-term trend lines, while the trailing sell stops are being tracked in the “Off High” column. The “Action” column will signal a “Sell” once the -12% point has been taken out in the “Off High” column, which has replaced the prior -8% to -10% limits.
3. Trend Tracking Indexes (TTIs)
Our TTIs rebounded as the bulls were firmly in control of the session.
This is how we closed 03/09/2022:
Domestic TTI: -2.18% below its M/A (prior close -4.21%)—Sell signal effective 02/24/2022.
International TTI: -3.83% below its M/A (prior close -6.13%)—Sell signal effective 03/08/2022.
Disclosure: I am obliged to inform you that I, as well as my advisory clients, own some of the ETFs listed in the above table. Furthermore, they do not represent a specific investment recommendation for you, they merely show which ETFs from the universe I track are falling within the specified guidelines.
All linked charts above are courtesy of Bloomberg via ZeroHedge.
Contact Ulli