
- Moving the markets
There was no question as to who oversaw market direction today. With bond yields soaring, and the 10-year spiking to 2.78%, its highest level since January 2019 when it topped out at 2.799%, the bears clearly had the upper hand.
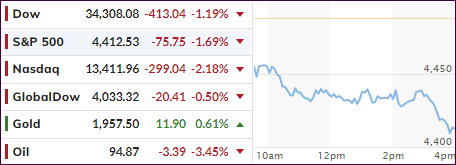
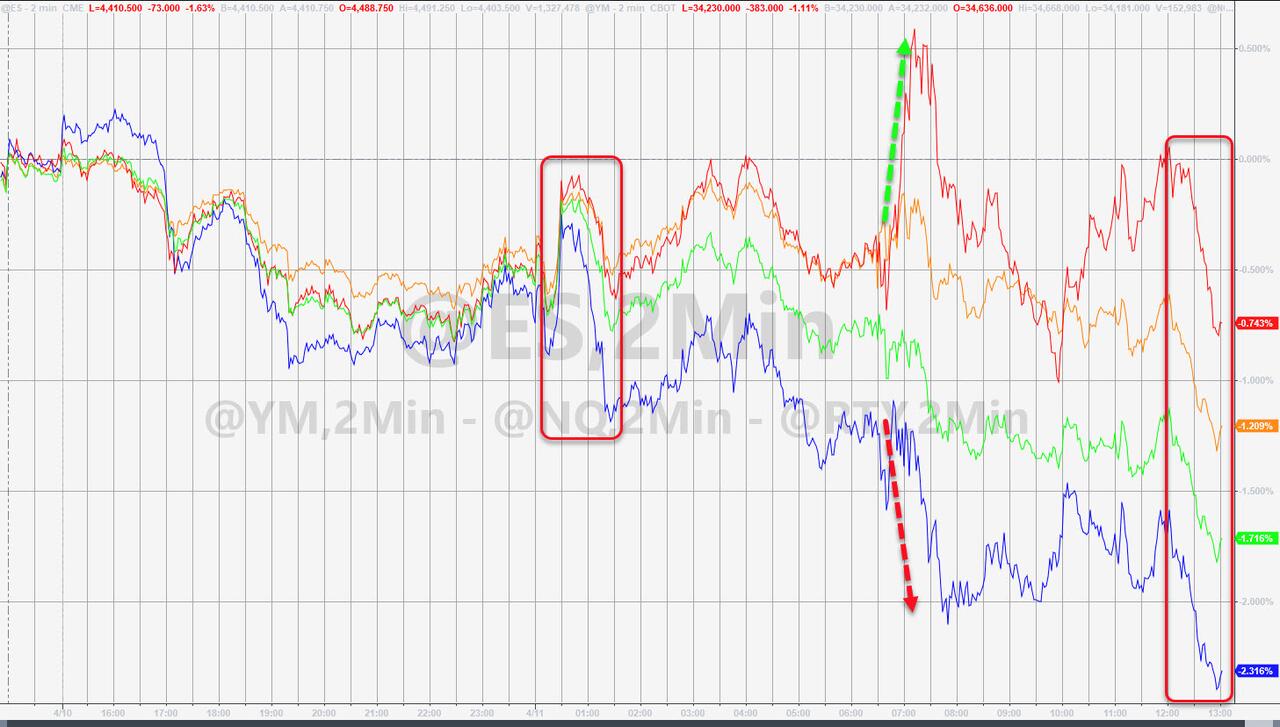
The major indexes got smacked with the Nasdaq leading the downturn by surrendering 2.18%, hotly pursued by the S&P 500 with a -1.69% drop. Other than gold, there was no place to hide, as bond holders were taking behind the barn for another spanking, as the most widely held TLT slumped another -1.73% bringing its YTD loss to a stunning -15.57%.
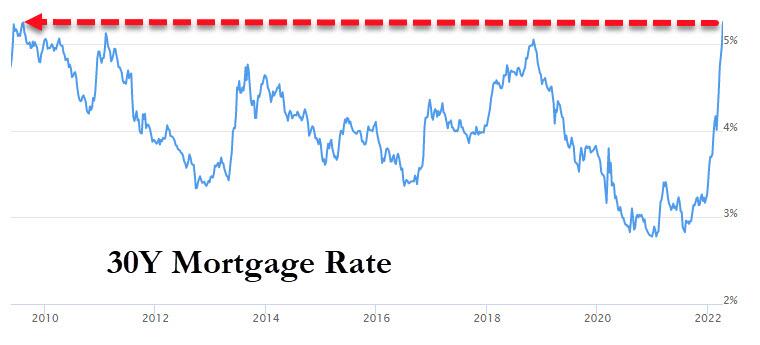
I have cautioned about bond investments for a long time. After all, when yields are at all-time lows, and inflation is raging, the most logical outcome are rising yields, which destroy bond prices. Mortgage rates were also affected with the 30-year reaching 5.25% today, it’s highest since 2009.
As a result, risk assets, especially in the tech area have been shed by traders, as the reality that we may be at the end of the bond super cycle slowly sinks in. If the Fed is serious about fighting inflation, and follows through with their accelerated hiking schedule, there will be much more downside equity pain on deck, which is why it’s critical to limit risk via an exit strategy.
One analyst summed it up like this:
And right now, the Fed has an urgent and fateful decision to make.
It can keep printing trillions of dollars, let inflation skyrocket, or tighten monetary policy, and watch the stock market crash.
In other words, it can sacrifice the stock market or the dollar.
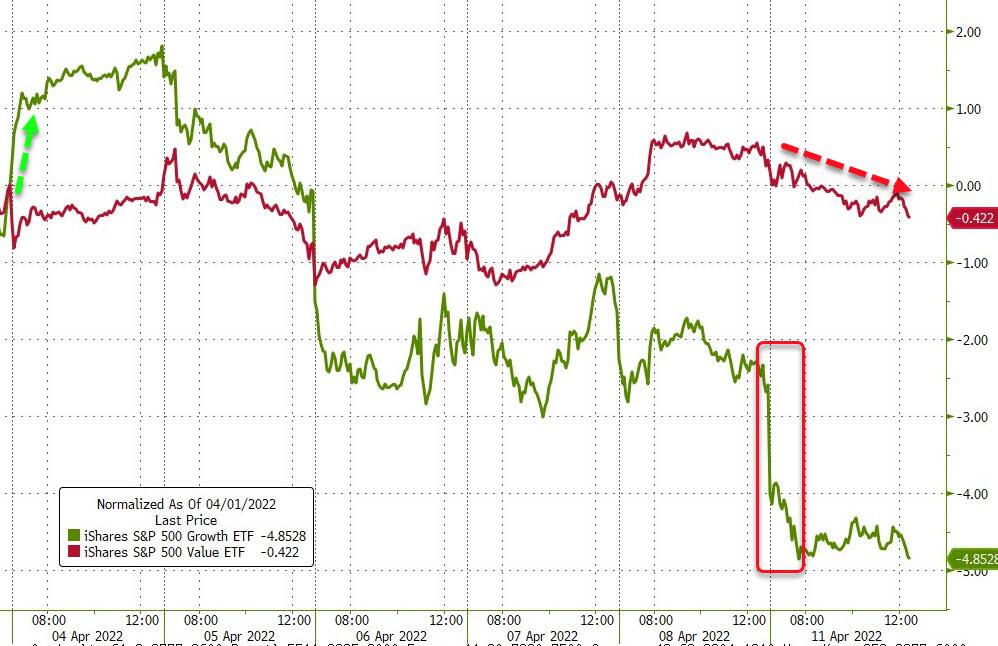
Despite “value” ending up moderately in the red, “growth” got slapped, as Bloomberg demonstrates in this chart.
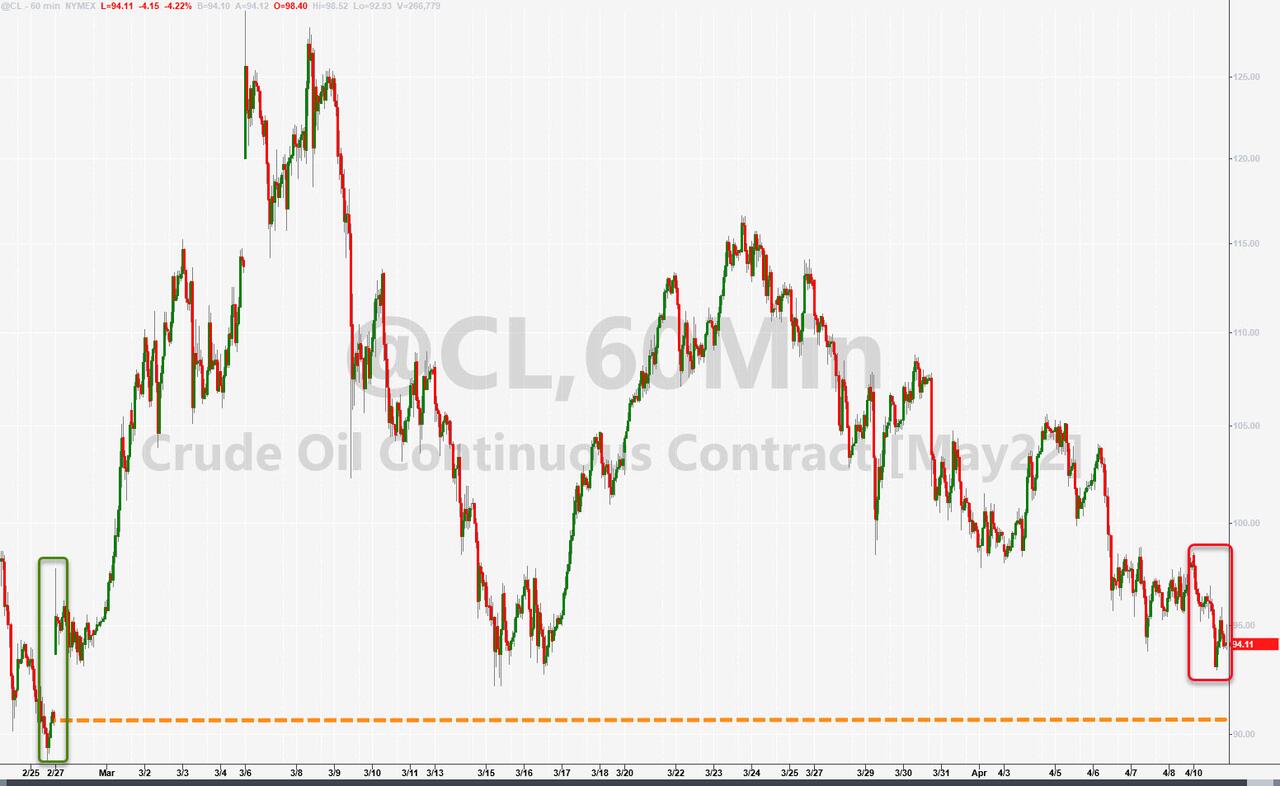
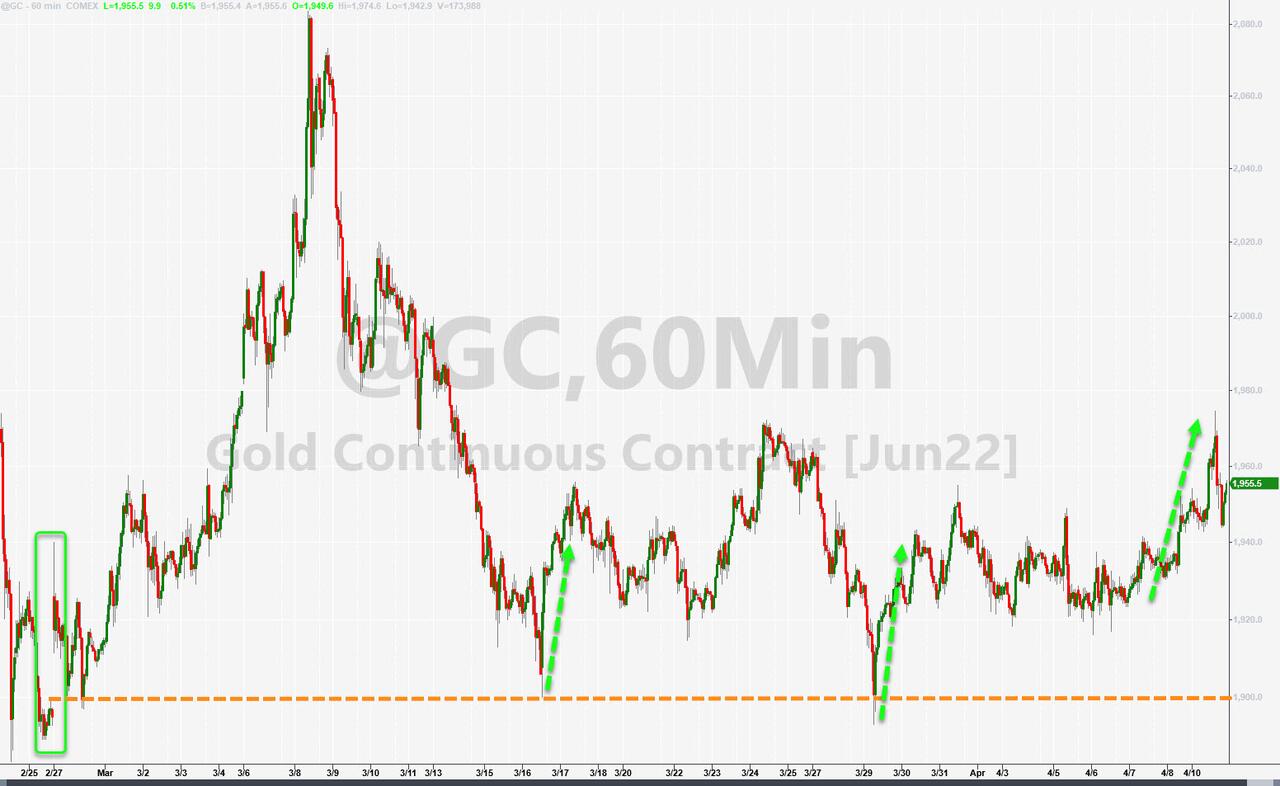
Crude oil pulled back again and currently sits a tad below $95, with the Energy sector slipping as well, but Gold was the savior of the day by gaining +0.64%.
The most anticipated number will be tomorrow’s CPI with consensus estimates being in the 8.4% range. Ouch.
A tip of the hat goes to ZeroHedge for this quote by Chicago Fed President Charles Evans, who said today:
“We will know a lot more about persistent inflation the end of the year” and (here’s the best line), he is “hopeful it’s receding…”
Ah yes, I feel much better now…
2. ETFs in the Spotlight
In case you missed the announcement and description of this section, you can read it here again.
It features some of the 10 broadly diversified domestic and sector ETFs from my HighVolume list as posted every Saturday. Furthermore, they are screened for the lowest MaxDD% number meaning they have been showing better resistance to temporary sell offs than all others over the past year.
The below table simply demonstrates the magnitude with which these ETFs are fluctuating above or below their respective individual trend lines (%+/-M/A). A break below, represented by a negative number, shows weakness, while a break above, represented by a positive percentage, shows strength.
For hundreds of ETF choices, be sure to reference Thursday’s StatSheet.
For this just closed-out domestic “Buy” cycle, here’s how some of our candidates have fared:
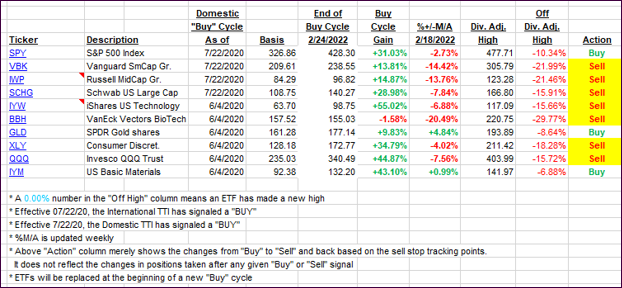
Click image to enlarge.
Again, the %+/-M/A column above shows the position of the various ETFs in relation to their respective long-term trend lines, while the trailing sell stops are being tracked in the “Off High” column. The “Action” column will signal a “Sell” once the -12% point has been taken out in the “Off High” column, which has replaced the prior -8% to -10% limits.
3. Trend Tracking Indexes (TTIs)
Our TTIs headed sharply south with the Domestic one again in striking distance of breaking into bear market territory thereby validating our current limited domestic exposure. Right now, it appears that the March comeback rally, which started on 3/15, was merely a bear market bounce. Again, if bond yields continue to rise, equities will suffer.
This is how we closed 04/11/2022:
Domestic TTI: +0.25% above its M/A (prior close +1.23%)—Sell signal effective 02/24/2022.
International TTI: -0.81% below its M/A (prior close -0.26%)—Sell signal effective 03/08/2022.
Disclosure: I am obliged to inform you that I, as well as my advisory clients, own some of the ETFs listed in the above table. Furthermore, they do not represent a specific investment recommendation for you, they merely show which ETFs from the universe I track are falling within the specified guidelines.
All linked charts above are courtesy of Bloomberg via ZeroHedge.
Contact Ulli