
- Moving the markets
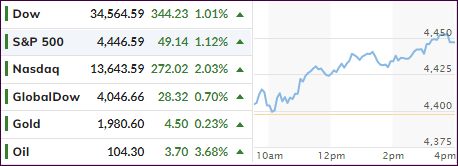
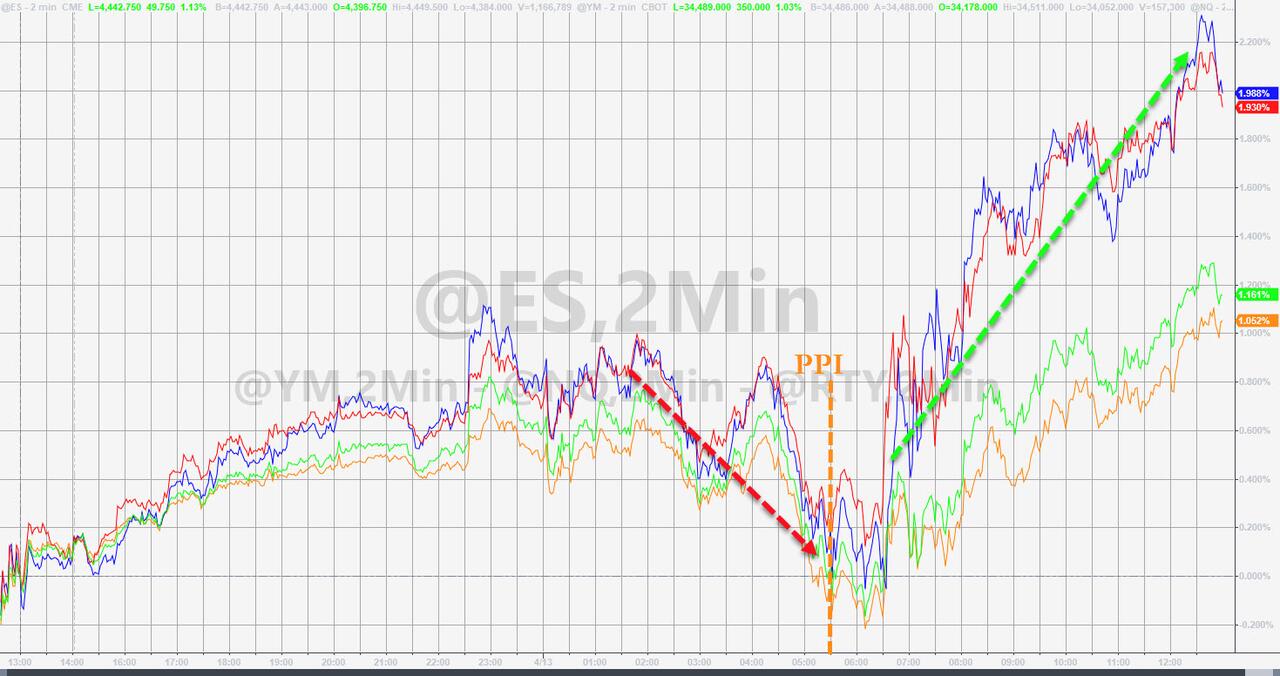
After three consecutive losing sessions, the major indexes managed to score a win, despite another horrific inflation number, which traders simply overlooked. Some corporate earnings came in better than expected (BlackRock, Fastenal, Delta) with the latter one announcing the return to profitability this quarter.
Other airlines, hotel, and travel stocks joined the rebound, which was led by the Nasdaq with a 2% gain.
The much-awaited Producer Price Index (PPI) jumped a mind-boggling 11.2% YoY in March, while the MoM gain came in at 1.4%, far higher than the expected 1.1%. This follows yesterday’s CPI number, which surged 8.5% YoY in March.
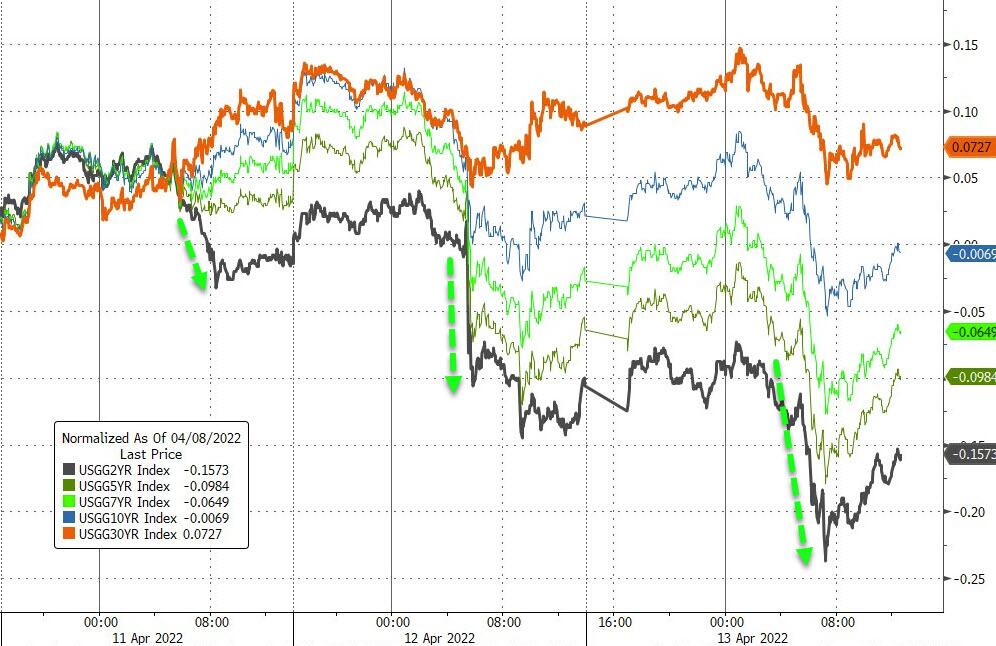
As strange as it may sound, but in the face of the above numbers, bond yields pulled back with the 10-year settling at 2.697%, down 8 basis points.
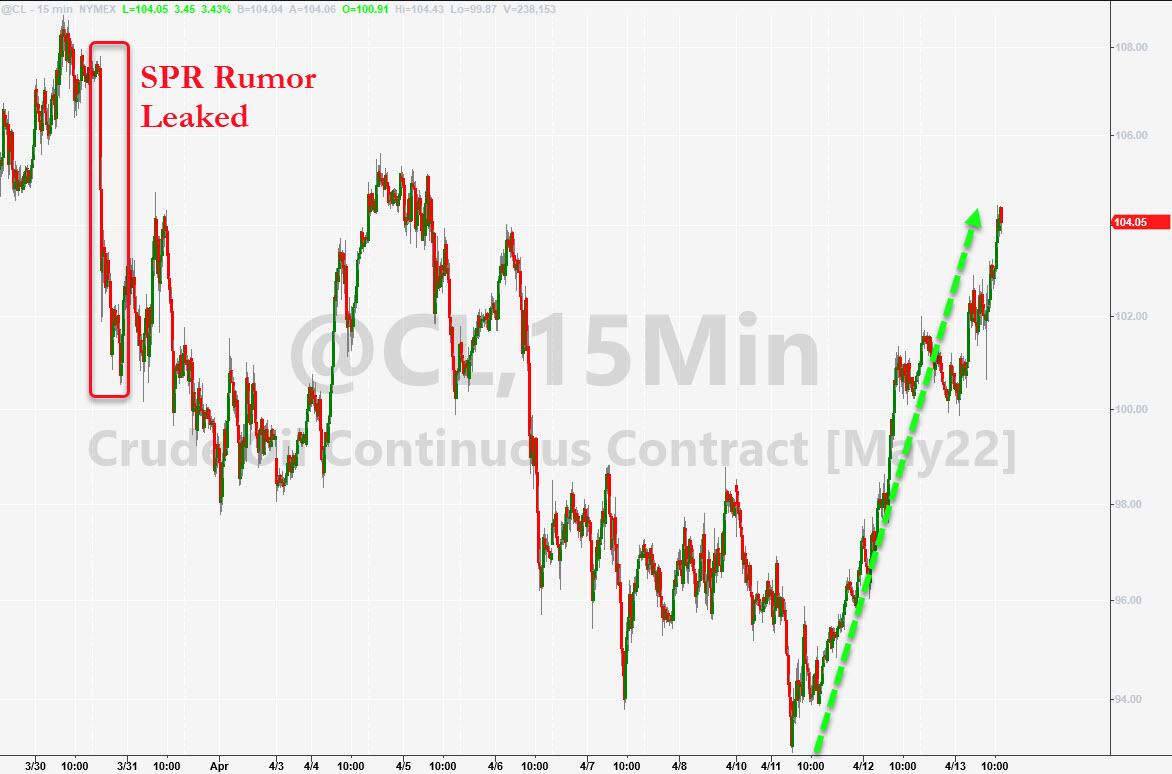
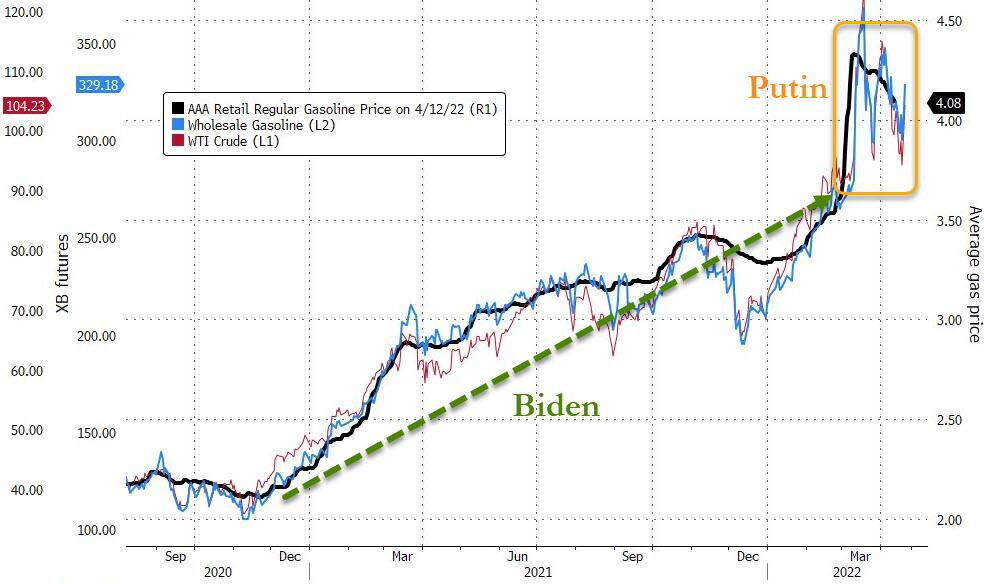
Crude Oil ripped higher despite the greatest SPR (Strategic Petroleum Reserve) release ever, which was pushed into the background on news that Russia is shutting down oil production at a more rapid rate. That will likely reverse the tiny reduction in gas prices of the recent past.
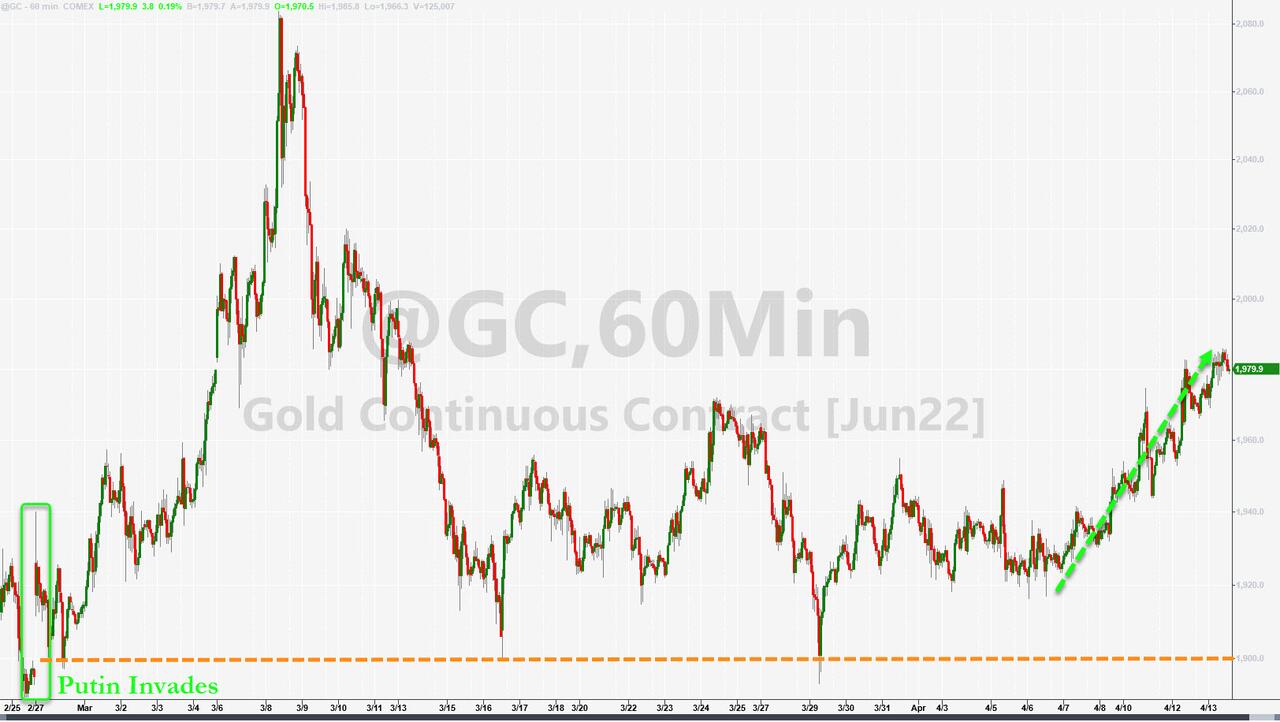
Gold maintained its upward momentum and is heading closer to breaking its $2k glass ceiling again.
2. ETFs in the Spotlight
In case you missed the announcement and description of this section, you can read it here again.
It features some of the 10 broadly diversified domestic and sector ETFs from my HighVolume list as posted every Saturday. Furthermore, they are screened for the lowest MaxDD% number meaning they have been showing better resistance to temporary sell offs than all others over the past year.
The below table simply demonstrates the magnitude with which these ETFs are fluctuating above or below their respective individual trend lines (%+/-M/A). A break below, represented by a negative number, shows weakness, while a break above, represented by a positive percentage, shows strength.
For hundreds of ETF choices, be sure to reference Thursday’s StatSheet.
For this just closed-out domestic “Buy” cycle, here’s how some of our candidates have fared:
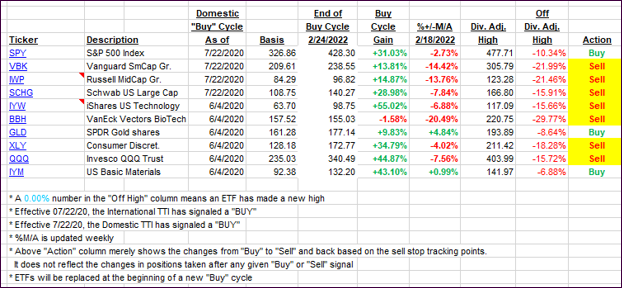
Click image to enlarge.
Again, the %+/-M/A column above shows the position of the various ETFs in relation to their respective long-term trend lines, while the trailing sell stops are being tracked in the “Off High” column. The “Action” column will signal a “Sell” once the -12% point has been taken out in the “Off High” column, which has replaced the prior -8% to -10% limits.
3. Trend Tracking Indexes (TTIs)
Our Domestic TTI went the other way and crawled back above its trend line. Again, as I mentioned yesterday, I will stick to my view that only limited exposure to domestic equities is warranted, and selective sector funds (gold, commodities, and energy) are the main areas to be invested in.
This is how we closed 04/13/2022:
Domestic TTI: +1.04% above its M/A (prior close -0.09%)—Sell signal effective 02/24/2022.
International TTI: -0.47% below its M/A (prior close -1.30%)—Sell signal effective 03/08/2022.
Disclosure: I am obliged to inform you that I, as well as my advisory clients, own some of the ETFs listed in the above table. Furthermore, they do not represent a specific investment recommendation for you, they merely show which ETFs from the universe I track are falling within the specified guidelines.
All linked charts above are courtesy of Bloomberg via ZeroHedge.
Contact Ulli