
- Moving the markets
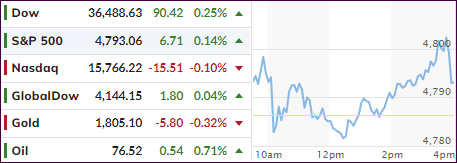
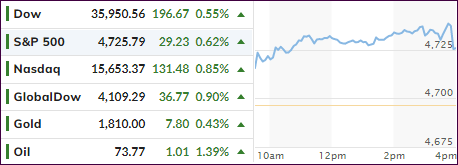
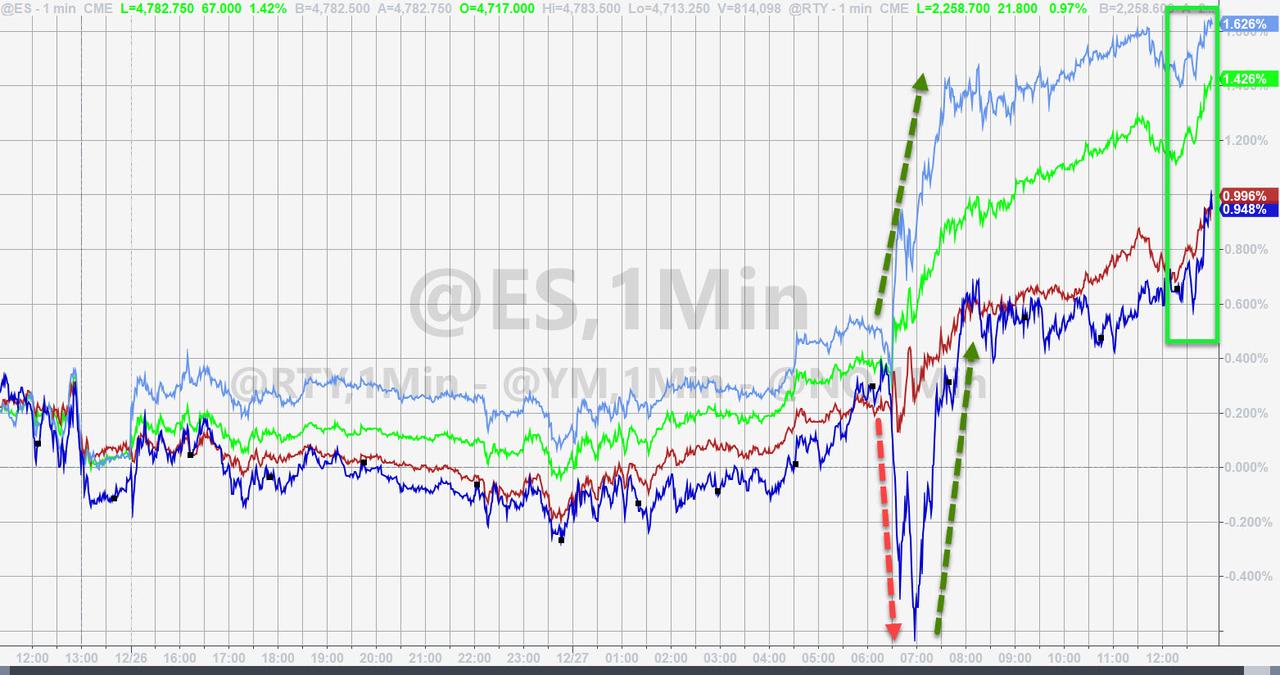
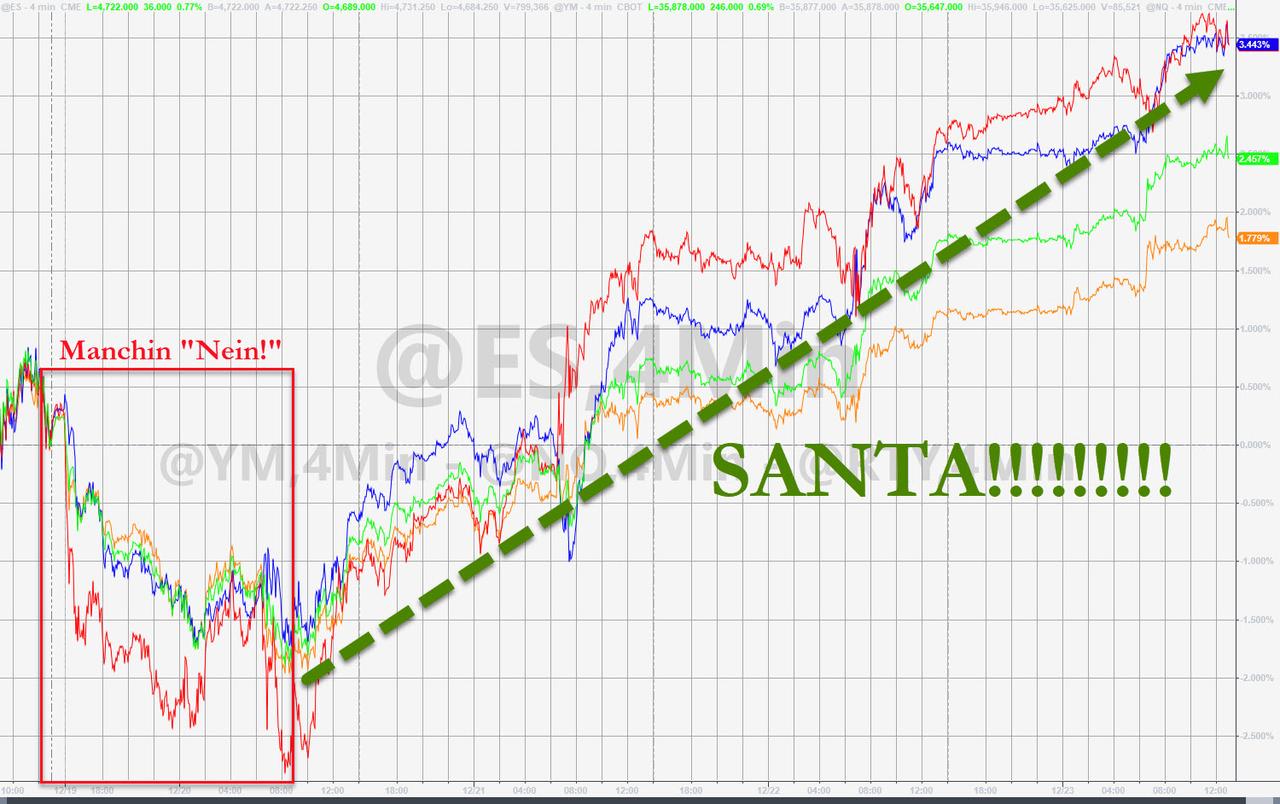
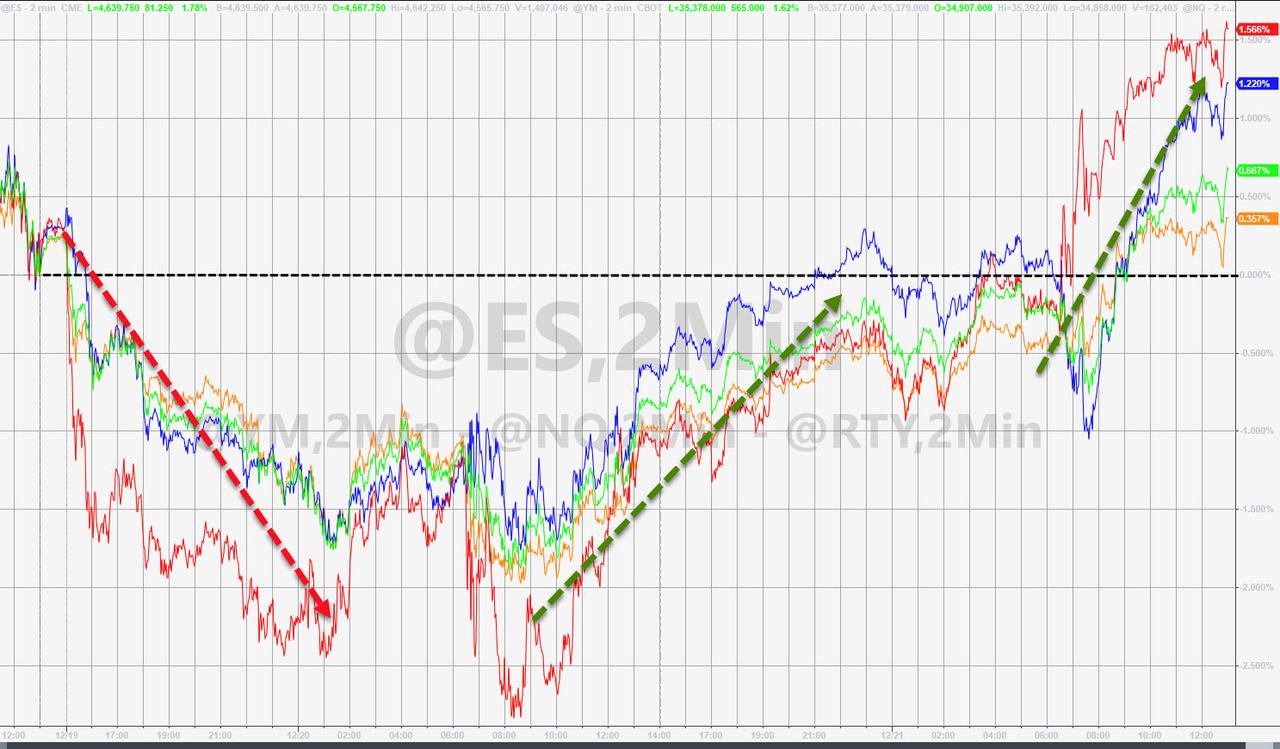
Despite the major indexes bouncing around in a narrow trading range, the S&P 500 managed to notch its 70th record close of the year, while the Dow rose for the 6th day in a row.
Traders hope to not only end the year on a high note but also that this positive momentum will carry at least into the first two trading days into 2022, thereby validating the Santa Claus rally concept.
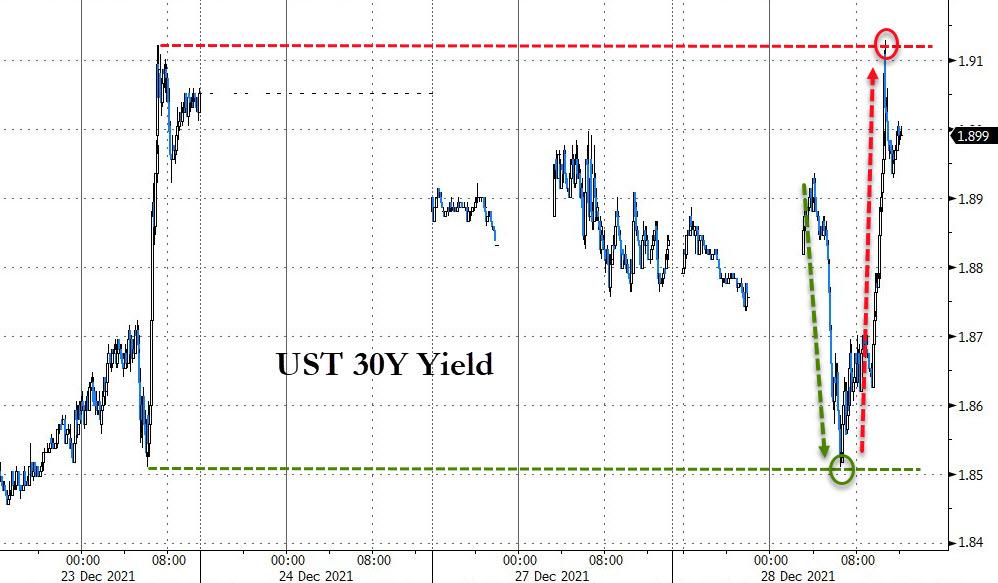
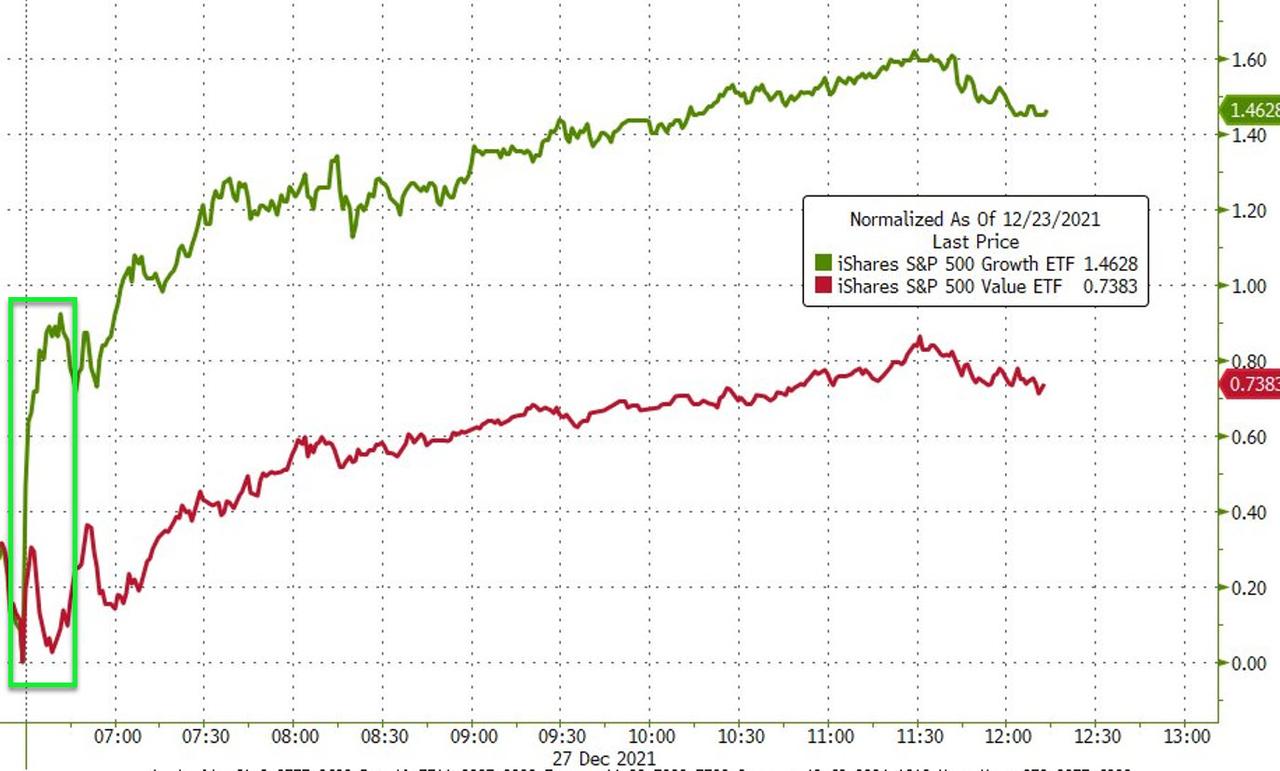
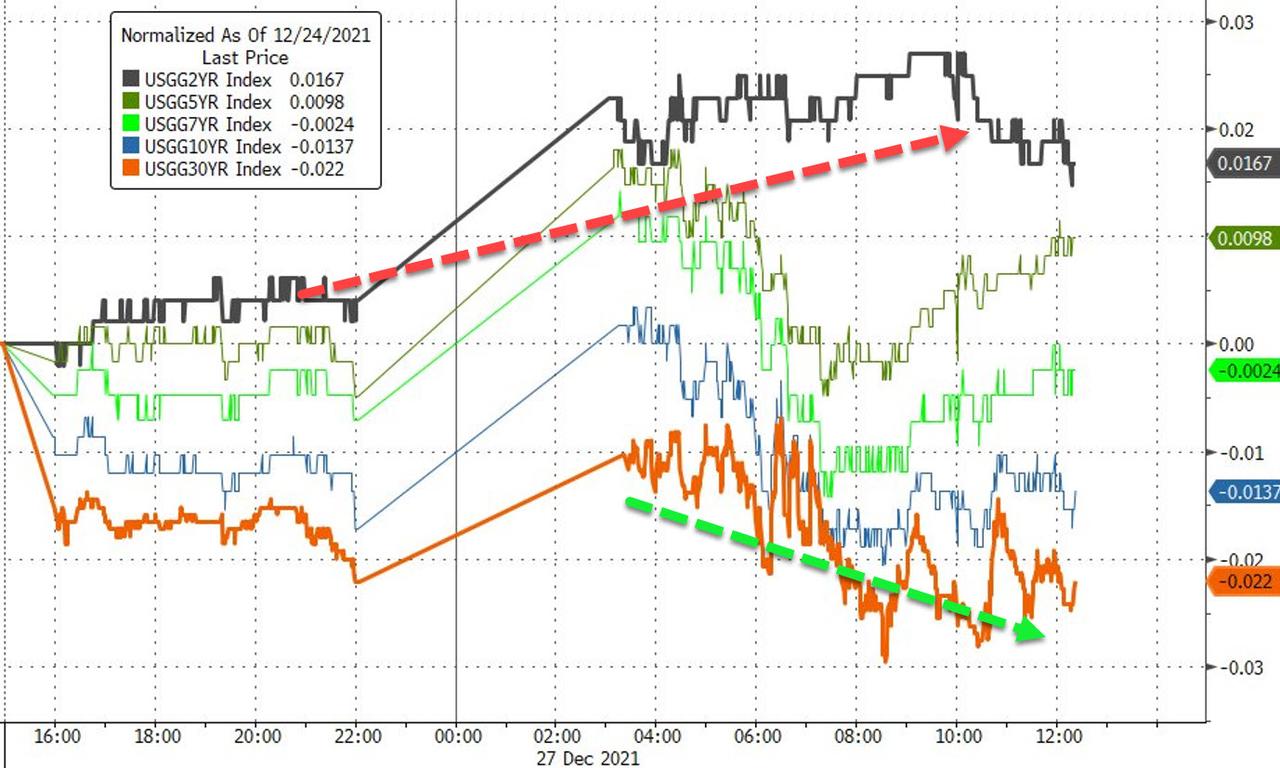
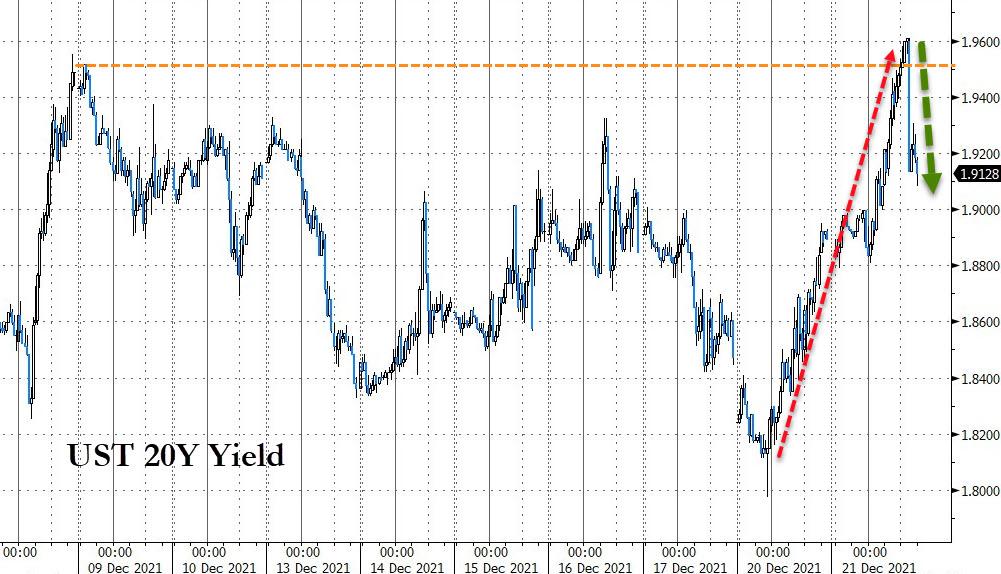
The tech sector struggled today with the Nasdaq closing just about unchanged, as bond yields spiked thus taking the starch out of the “growth” section in general.
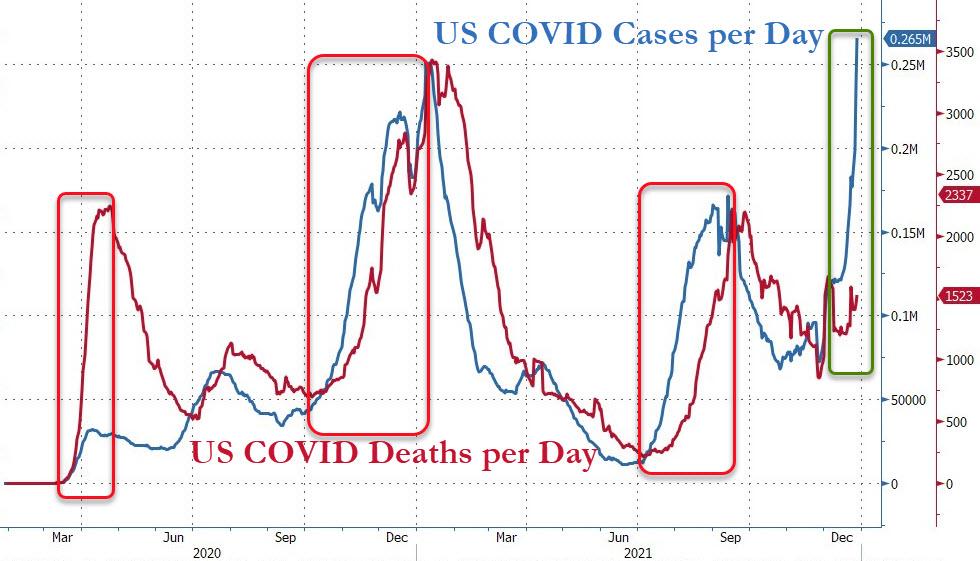
Sentiment continues to weaken, because of potentially tighter monetary policy and the impact of the Omicron variant, the virulency of which remains questionable, as death and hospitalization “refuse” to go along with soaring Covid cases. Hmm…
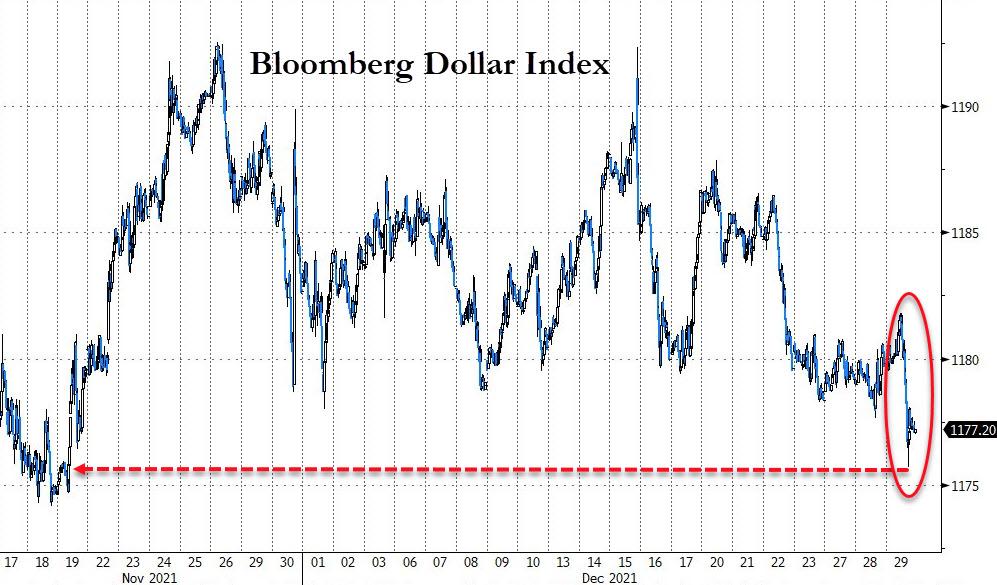
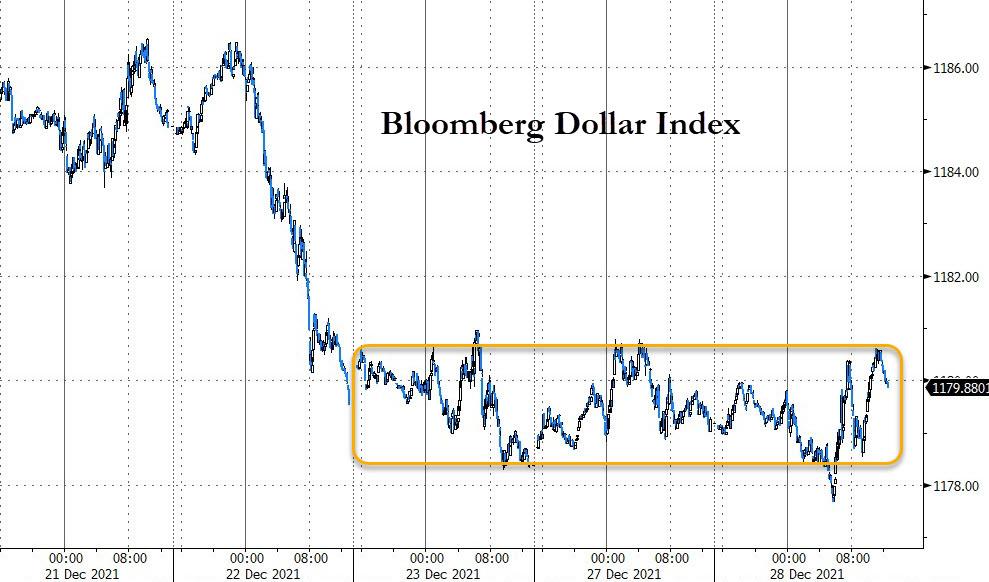
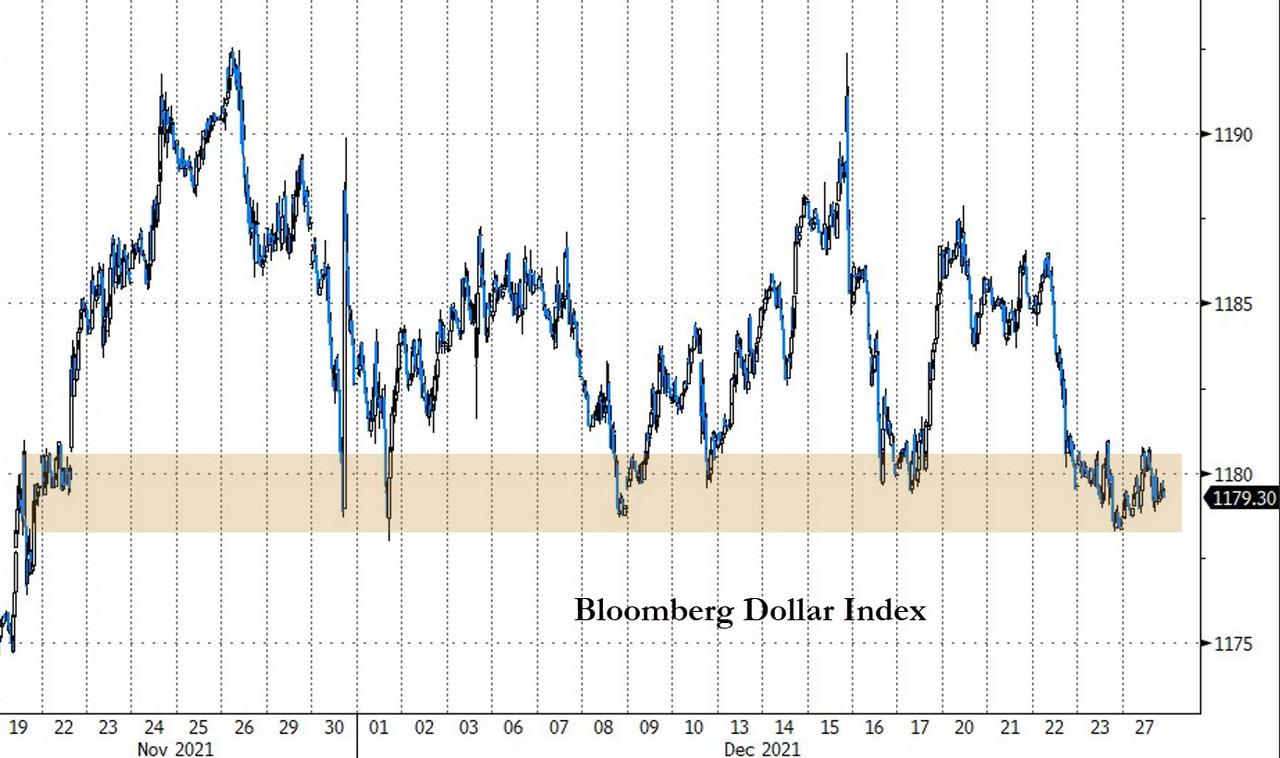
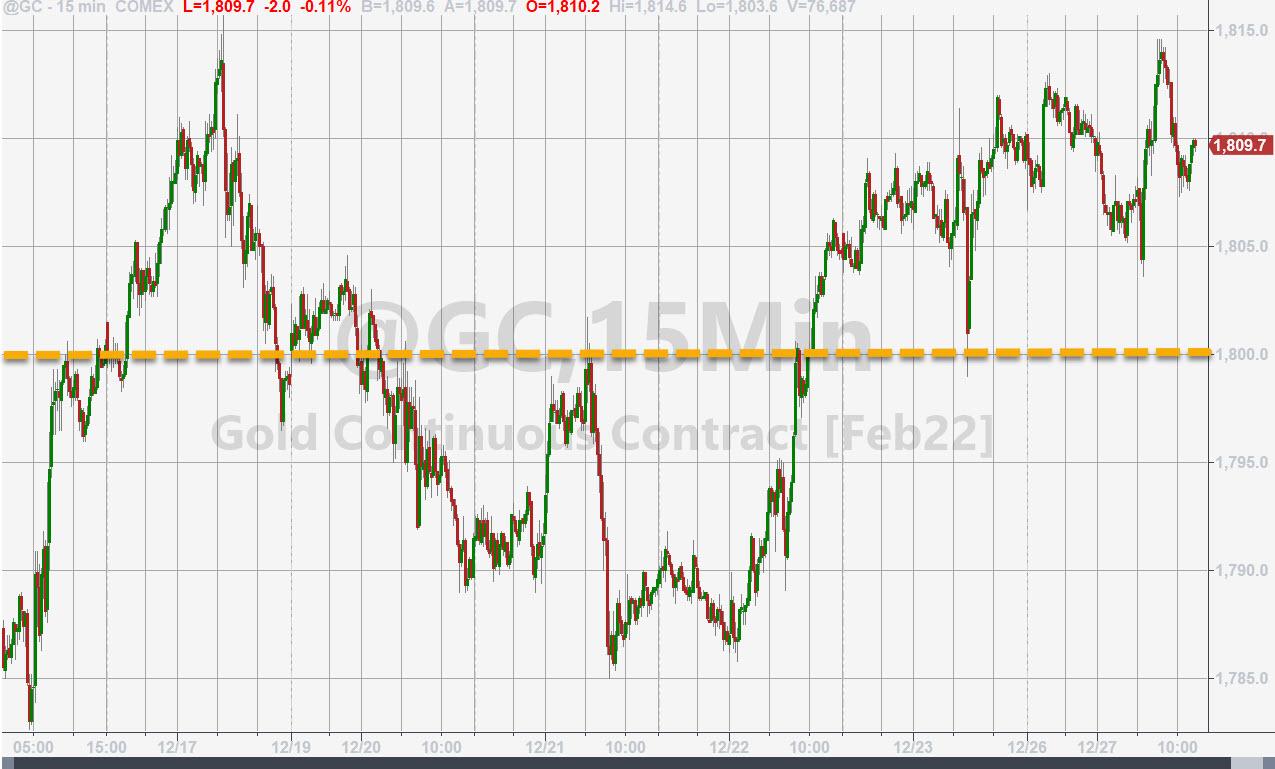
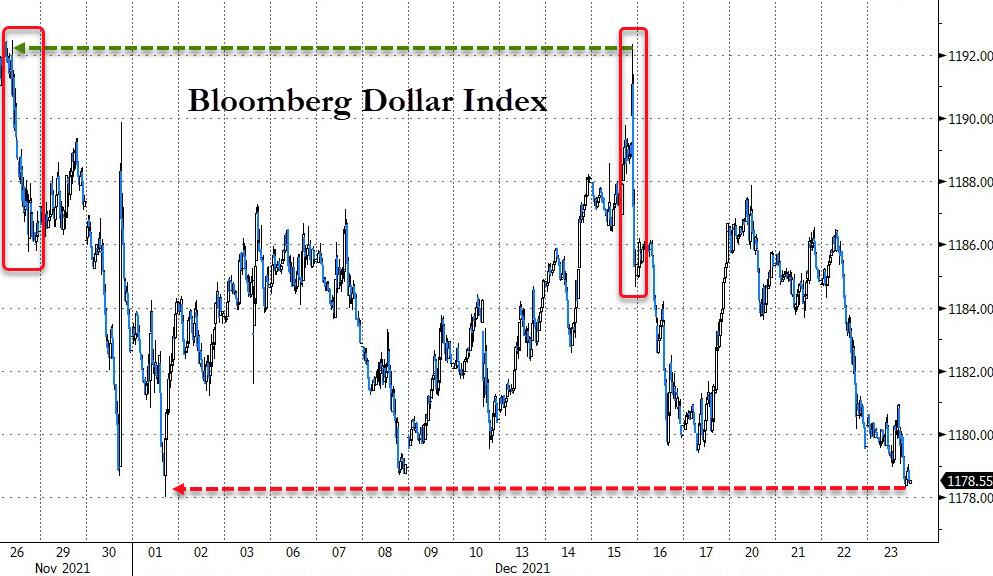
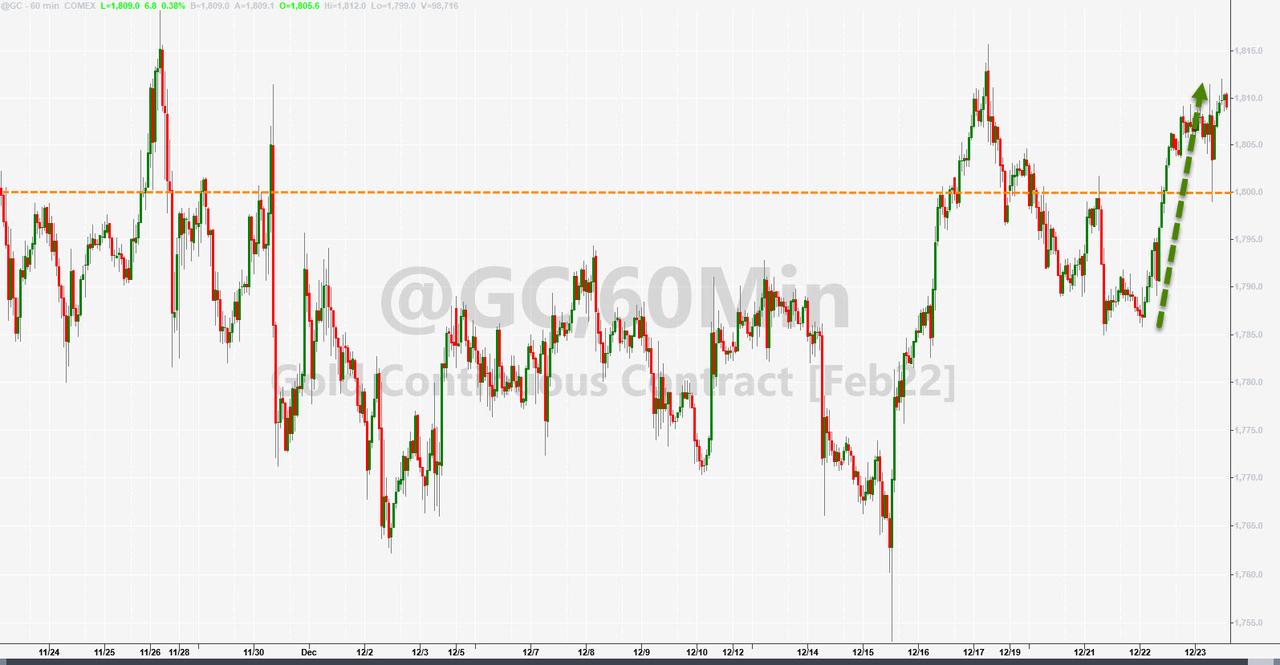
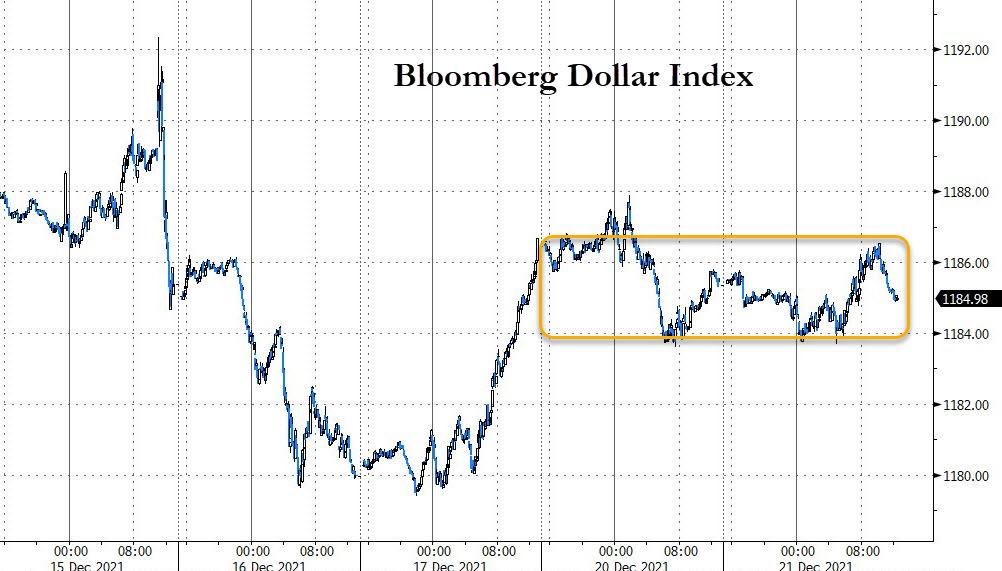
The US Dollar got whacked during this session and plunged to a level last seen just prior to Thanksgiving, while gold dropped and popped and successfully defended its $1,800 level, despite breaking below it midsession.
Economist Nouriel Roubini offered these words of caution:
As long as central banks were in unconventional policy mode, the party could keep going. But the asset and credit bubbles may deflate in 2022 when policy normalization starts. Moreover, inflation, slower growth, and geopolitical and systemic risks could create the conditions for a market correction in 2022. Come what may, investors are likely to remain on the edge of their seats for most of the year.
I will be back to write the final market commentary for 2021 on Friday.
Read More
