ETF Tracker StatSheet
You can view the latest version here.
A POSITIVE CLOSE ENDS A DOWN WEEK

- Moving the markets
After Monday’s bounce, it was all downhill, although moderately, but today the bulls found their mojo again with the major indexes staging a broad recovery lead by the Nasdaq’s 1.19% charge.
It was a positive ending to a down week, during which the Dow gave back 1.1%, the S&P 500 0.6% and the Nasdaq 0.7%. In other words, much ado about nothing.
It seemed like we climbed a wall of worry today, as fears of the Fed pulling back some of its stimulus remains fresh in traders’ minds, but apparently that fact is slowly being accepted. Support for bullish sentiment came from the tech sector, as investor picked up some of the recent weaklings like Microsoft, Cisco and Salesforce and turned them into winners, at least for this session.
Of course, not all his hunky dory with Barclay’s commenting on the current situation:
With Fed tapering coming while delta variant keeps spreading, the transition away from liquidity/policy regime to more mid-cycle markets means we may experience a bumpier ride ahead. Market narrative may thus turn more cautious, as concerns about peaking growth rates, Delta variant and policy mistake may prove headwinds, at a time where seasonality and technicals are unfavorable.
Bumpiness could also be cause of next week’s annual meeting in Jackson Hole, WY, after which the Fed may release more insight into their “taper talk,” meaning a tightening of market conditions that could be on deck.
Looking at the big picture, ZeroHedge pointed out that global economic data is disappointing at its fastest pace since the Covid lockdowns began. Hmm, does that mean the Fed will be tightening into a weakening economy?
Things were even worse in China, as their Golden Dragon index suffered its eighth straight weekly loss, which is its longest losing streak in a decade, as ZH explained. Ouch!
Domestically, growth stocks outperformed value, mainly due to Microsoft’s crazy 6% vertical move in the past couple of days. The US Dollar rose every day of this week, while Gold remained steady but did not manage to break above the $1,800 level.
Regarding stocks, the fact is that breadth remains appalling with the S&P 500 being totally disconnected, as Bloomberg shows in this chart. How long this can go on is anyone’s guess.
2. ETFs in the Spotlight
In case you missed the announcement and description of this section, you can read it here again.
It features some of the 10 broadly diversified domestic and sector ETFs from my HighVolume list as posted every Saturday. Furthermore, they are screened for the lowest MaxDD% number meaning they have been showing better resistance to temporary sell offs than all others over the past year.
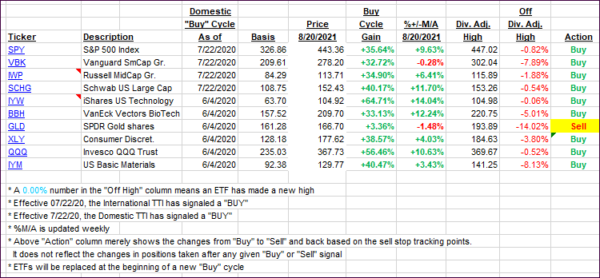
The below table simply demonstrates the magnitude with which these ETFs are fluctuating above or below their respective individual trend lines (%+/-M/A). A break below, represented by a negative number, shows weakness, while a break above, represented by a positive percentage, shows strength.
For hundreds of ETF choices, be sure to reference Thursday’s StatSheet.
For this current domestic “Buy” cycle, here’s how some our candidates have fared:

Click image to enlarge.
Again, the %+/-M/A column above shows the position of the various ETFs in relation to their respective long-term trend lines, while the trailing sell stops are being tracked in the “Off High” column. The “Action” column will signal a “Sell” once the -8% point has been taken out in the “Off High” column. For more volatile sector ETFs, the trigger point is -10%.
3. Trend Tracking Indexes (TTIs)
Our TTIs showed a mixed picture with the Domestic one inching higher, while the International one once again showed weakness. It may very well turn out to be the canary in the coalmine, as I have seen frequently over the decades.
This is how we closed 08/20/2021:
Domestic TTI: +8.55% above its M/A (prior close +8.44%)—Buy signal effective 07/22/2020.
International TTI: +3.84% above its M/A (prior close +4.17%)—Buy signals effective 07/22/2020.
Disclosure: I am obliged to inform you that I, as well as my advisory clients, own some of the ETFs listed in the above table. Furthermore, they do not represent a specific investment recommendation for you, they merely show which ETFs from the universe I track are falling within the specified guidelines.
All linked charts above are courtesy of Bloomberg via ZeroHedge.
———————————————————-
WOULD YOU LIKE TO HAVE YOUR INVESTMENTS PROFESSIONALLY MANAGED?
Do you have the time to follow our investment plans yourself? If you are a busy professional who would like to have his portfolio managed using our methodology, please contact me directly or get more details here.
Contact Ulli