
- Moving the markets
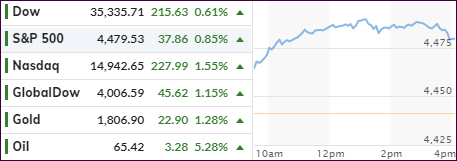
The futures markets already indicated a strong opening, which is exactly how things played out. The major indexes roared out of the gate with all three of them displaying solid gains, but the leader was the Nasdaq by showing off with an advance of +1.55%.
Last week’s weakness was shoved in the rear-view mirror, when Fed VP Kaplan, after Friday’s close, uttered those words that markets are dying to hear, namely that “he’s open to adjusting his view that the Central Bank should start tapering sooner rather than later if the Delta variant persists and hurts economic progress.”
Wow, how much clearer can he be to announce that talk about tapering was just that: Empty talk.
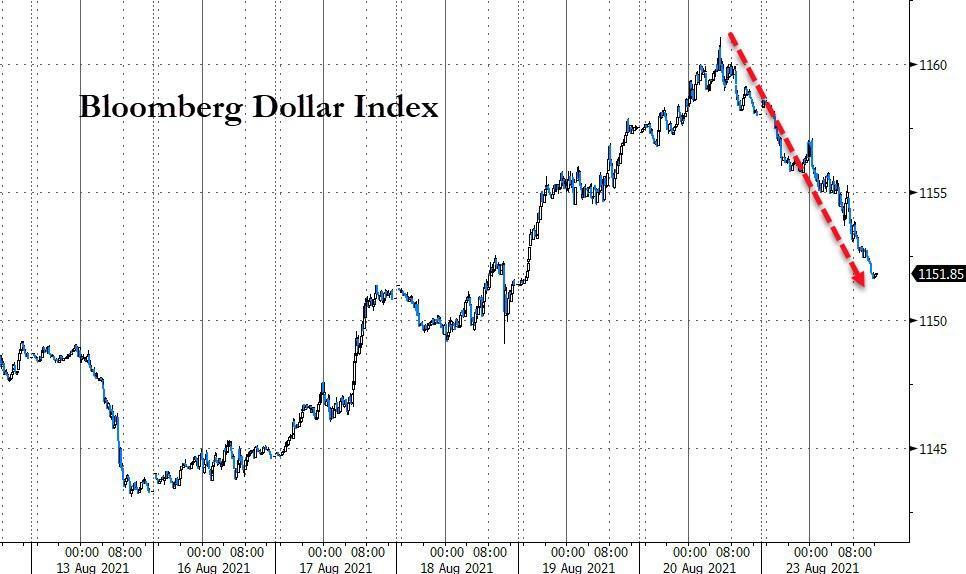
Be that as it may, market reaction was broadly bullish with even the international arena recovering from its recent swoon and participating in today’s “Ramp-A-Thon.” The US Dollar took a swan dive, with bond yields joining in, as the 10-year dropped to 1.25%.
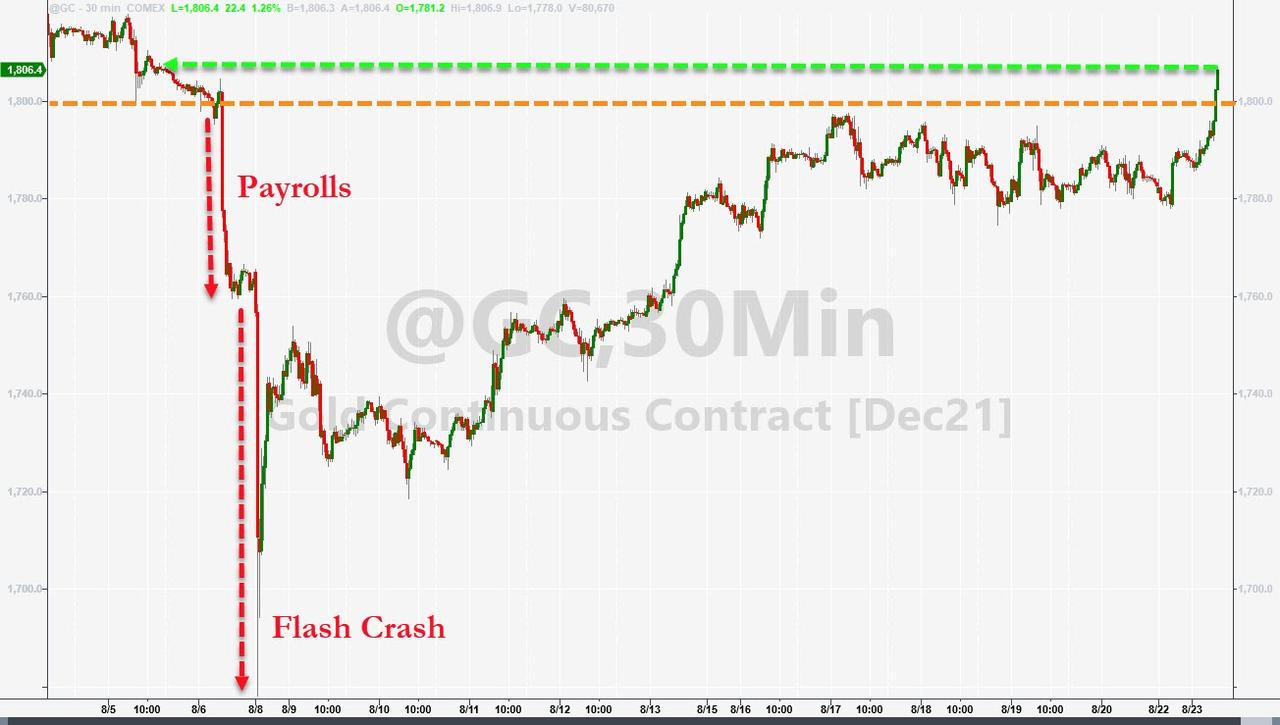
That caused Gold to take off with the precious metal not only rebounding +1.26% but also reclaiming its psychologically important $1,800 level.
The key event is the upcoming Jackson Hole, WY virtual symposium and Fed head Powell’s highly anticipated speech later this week causing a wave of speculations. Here’s one:
Our base case is that the FOMC will announce a taper in September if the August non-farm payrolls is strong,” said Joseph Capurso, head of international economics at CBA. “We anticipate the taper will be implemented in October or November, though the recent increase in Covid infections and deaths in parts of the U.S. may give Powell pause.
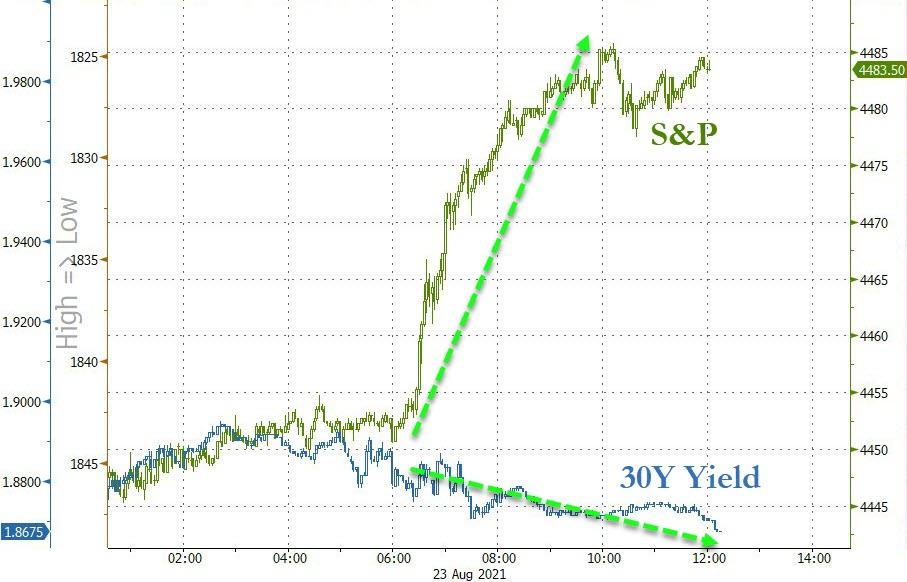
It seems something went awry in the markets today, as equities totally disconnected from the bond markets, as Bloomberg demonstrates in this chart leaving me pondering as to who will be right in the end.
2. ETFs in the Spotlight
In case you missed the announcement and description of this section, you can read it here again.
It features some of the 10 broadly diversified domestic and sector ETFs from my HighVolume list as posted every Saturday. Furthermore, they are screened for the lowest MaxDD% number meaning they have been showing better resistance to temporary sell offs than all others over the past year.
The below table simply demonstrates the magnitude with which these ETFs are fluctuating above or below their respective individual trend lines (%+/-M/A). A break below, represented by a negative number, shows weakness, while a break above, represented by a positive percentage, shows strength.
For hundreds of ETF choices, be sure to reference Thursday’s StatSheet.
For this current domestic “Buy” cycle, here’s how some our candidates have fared:
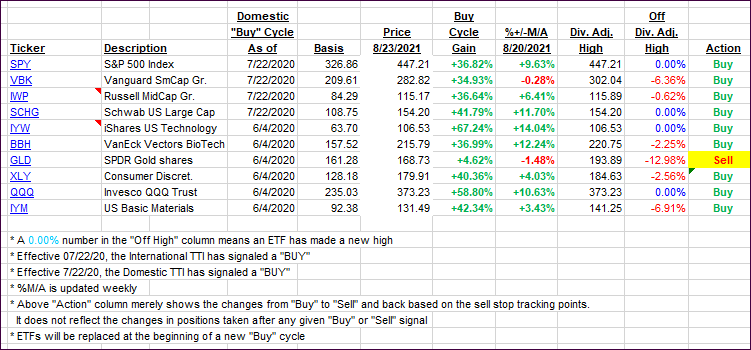
Click image to enlarge.
Again, the %+/-M/A column above shows the position of the various ETFs in relation to their respective long-term trend lines, while the trailing sell stops are being tracked in the “Off High” column. The “Action” column will signal a “Sell” once the -8% point has been taken out in the “Off High” column. For more volatile sector ETFs, the trigger point is -10%.
3. Trend Tracking Indexes (TTIs)
Our TTIs gained nicely as the bullishness prevailed across all markets.
This is how we closed 08/23/2021:
Domestic TTI: +9.36% above its M/A (prior close +8.55%)—Buy signal effective 07/22/2020.
International TTI: +4.97% above its M/A (prior close +3.84%)—Buy signals effective 07/22/2020.
Disclosure: I am obliged to inform you that I, as well as my advisory clients, own some of the ETFs listed in the above table. Furthermore, they do not represent a specific investment recommendation for you, they merely show which ETFs from the universe I track are falling within the specified guidelines.
All linked charts above are courtesy of Bloomberg via ZeroHedge.
Contact Ulli