Below, please find the latest High-Volume ETF Cutline report, which shows how far above or below their respective long-term trend lines (39-week SMA) my currently tracked ETFs are positioned.
This report covers the HV ETF Master List from Thursday’s StatSheet and includes 312 High Volume ETFs, defined as those with an average daily volume of more than $5 million, of which currently 22 (last week 41) are hovering in bullish territory. The yellow line separates those ETFs that are positioned above their trend line (%M/A) from those that have dropped below it.
In case you are not familiar with some of the terminology used in the reports, please read the Glossary of Terms. If you missed the original post about the Cutline approach, you can read it here.
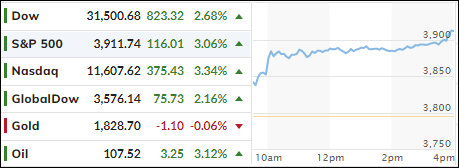
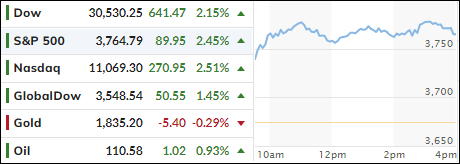
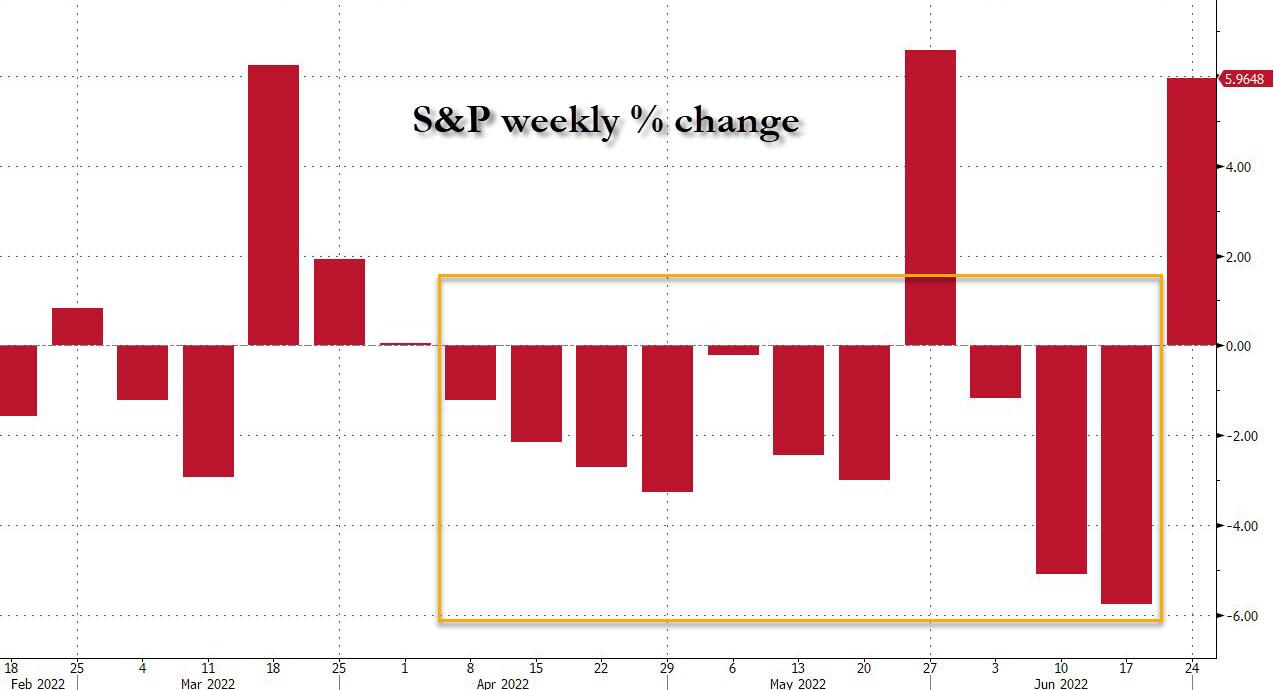
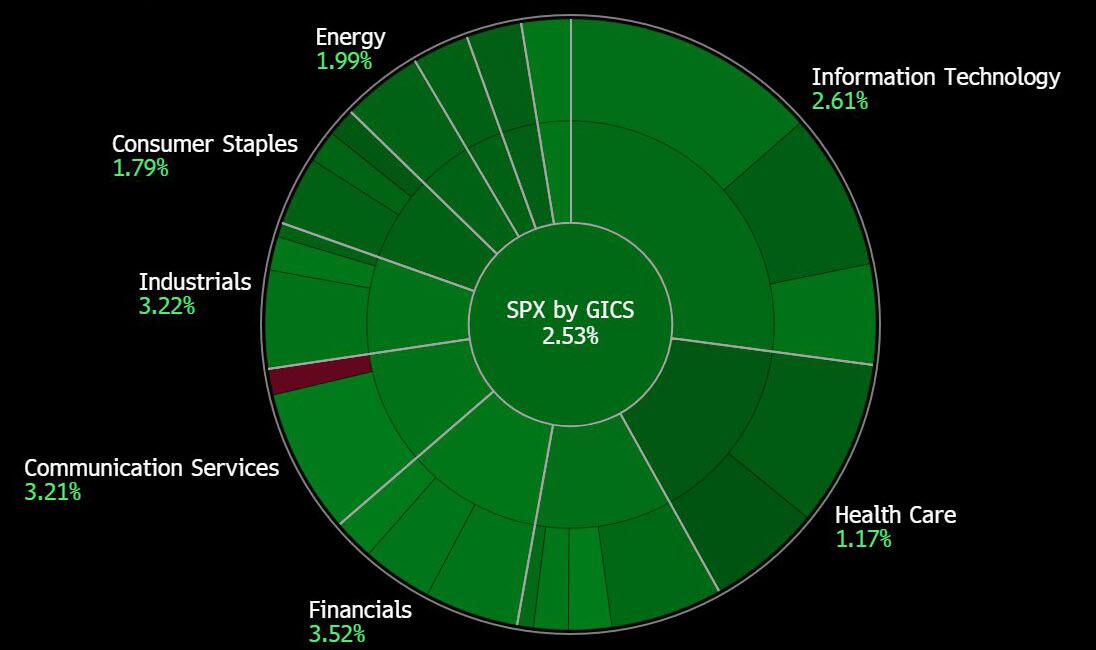
After the recent thrashing, the major indexes finally managed to close the first week out of the last four with a win. Gains were broad, as the markets seemed to have found some stability and strung together a nice relief rally.
Given the oversold conditions, after a rough first half of the year, during which all indexes plunged into bear market territory, a rebound comes as no surprise. Especially during the end of this quarter when the Russell and some $30 billion in pension funds finalize their rebalancing acts. This period is often marked by extreme volatility and heavy trading volume, neither one of which is indicative of future market direction.
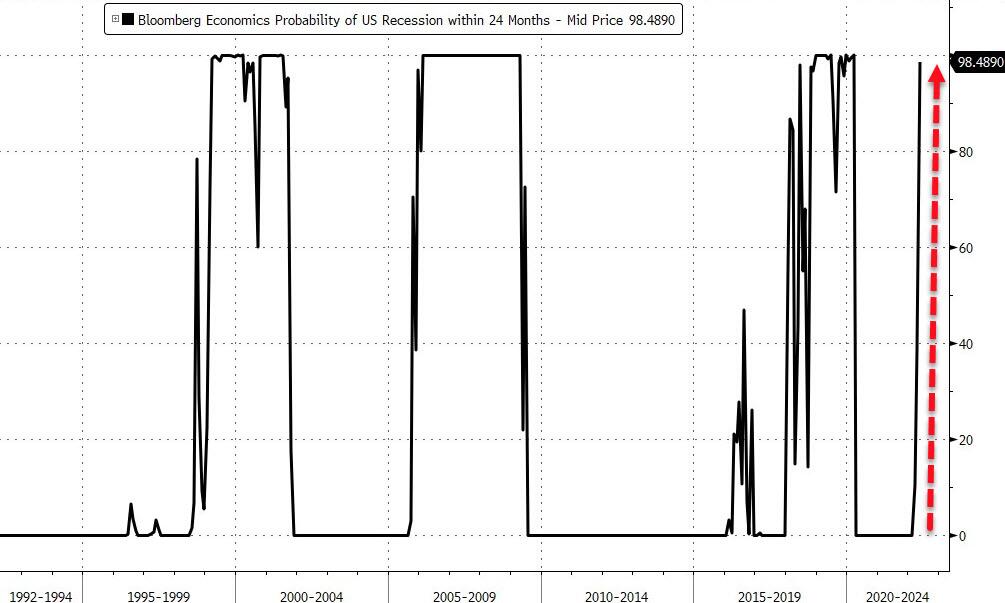
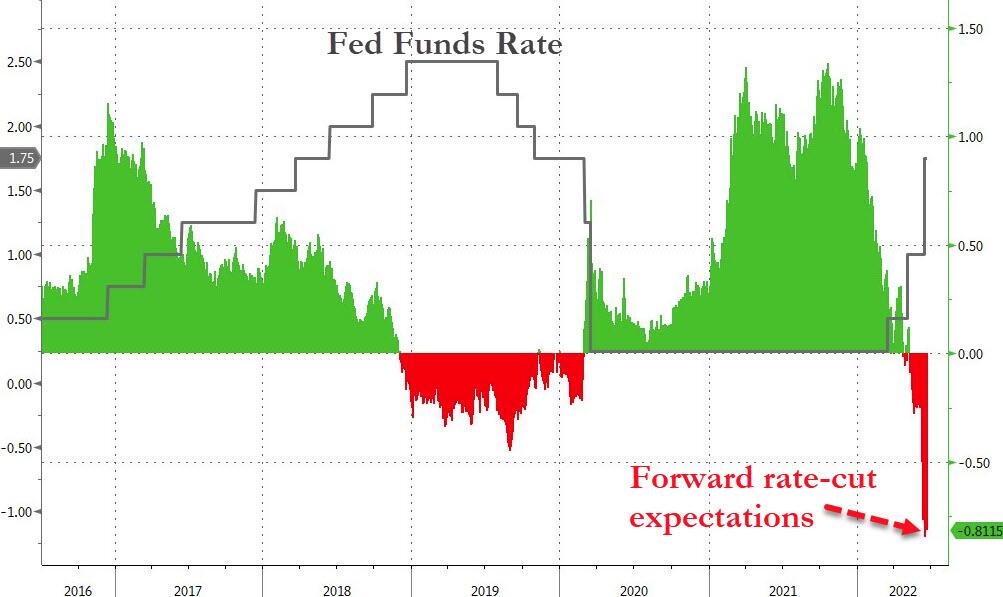
The odd thing is that the positive sentiment of the past couple of days is the result of growing concerns with global economic growth, which increases hope that the Fed will have to end its interest rate hiking process sooner than later and start lowering rates.
Bloomberg called it this way:
US equities are rallying on Friday, putting them on pace to wipe out the losses from last week, as recession fears calm, and a key economic data suggest inflation may be cooling.
ZeroHedge argued against that conclusion:
It’s a good headline, unfortunately it’s dead wrong, because while stocks did in fact snap a three-week losing streak and also averted being down for a record 11 out of 12 weeks…
… what prompted today’s furious short squeeze, because that’s what it was – a short squeeze of the most shorted names…
… was the market’s realization – helped by our explanation yesterday – that a recession means the Fed will end its hiking cycle much sooner than previously expected, most likely sometime around the mid-term election…
Just that potential of rates possibly having peaked was cause for the bulls to celebrate by ramping up stocks but forgetting that a recession will affect corporate earnings negatively and therefore stump stock prices.
However, in the era of “bad news is good news” everything is possible, even the remote chance that Fed head Powell might stick to his guns and seriously hike rates to battle inflation—recession be damned. Because if the folds, and lowers rates again as markets expect, hyperinflation will be our steady companion, along with a constantly devaluating dollar.
Next week, I expect some more quarter-end buying to support the indexes, with the S&P 500 possibly recouping its 4k level, but after we enter July, all bets are off.
1. From the universe of over 1,800 ETFs, I have selected only those with a trading volume of over $5 million per day (HV ETFs), so that liquidity and a small bid/ask spread are assured.
2. Trend Tracking Indexes (TTIs)
Buy or Sell decisions for Domestic and International ETFs (section 1 and 2), are made based on the respective TTI and its position either above or below its long-term M/A (Moving Average). A crossing of the trend line from below accompanied by some staying power above constitutes a “Buy” signal. Conversely, a clear break below the line constitutes a “Sell” signal. Additionally, I use an 12% trailing stop loss on all positions in these categories to control downside risk.
3. All other investment arenas do not have a TTI and should be traded based on the position of the individual ETF relative to its own respective trend line (%M/A). That’s why those signals are referred to as a “Selective Buy.” In other words, if an ETF crosses its own trendline to the upside, a “Buy” signal is generated. Here too, I recommend trailing sell stop of 12%, or less, depending on your risk tolerance.
If you are unfamiliar with some of the terminology, please see Glossary of Termsand new subscriber information in section 9.
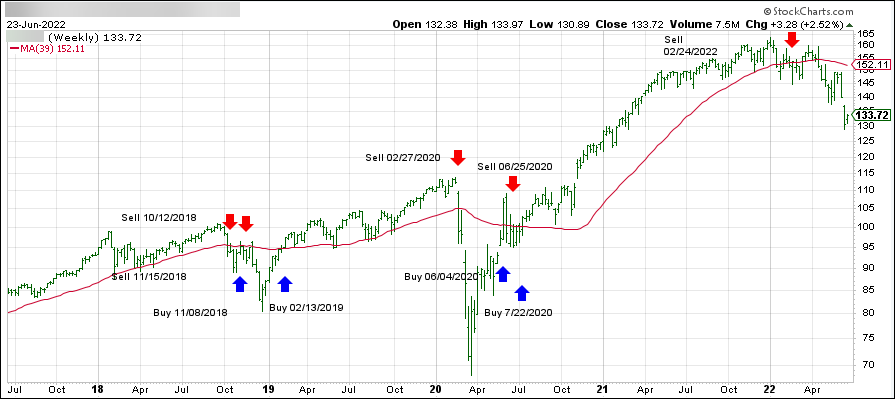
1. DOMESTIC EQUITY ETFs: SELL — since 02/24/2022
Click on chart to enlarge
Our main directional indicator, the Domestic Trend Tracking Index (TTI-green line in the above chart) has broken below its long-term trend line (red) by -12.83% and remains in “SELL” mode.
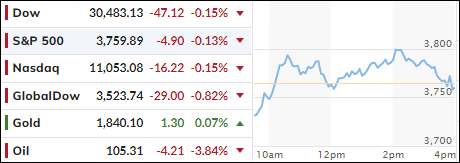
Bullish attempts to keep yesterday’s comeback alive ended up failing, as the major indexes surrendered early gains and ended up the hugging their respective unchanged lines with not much to show for.
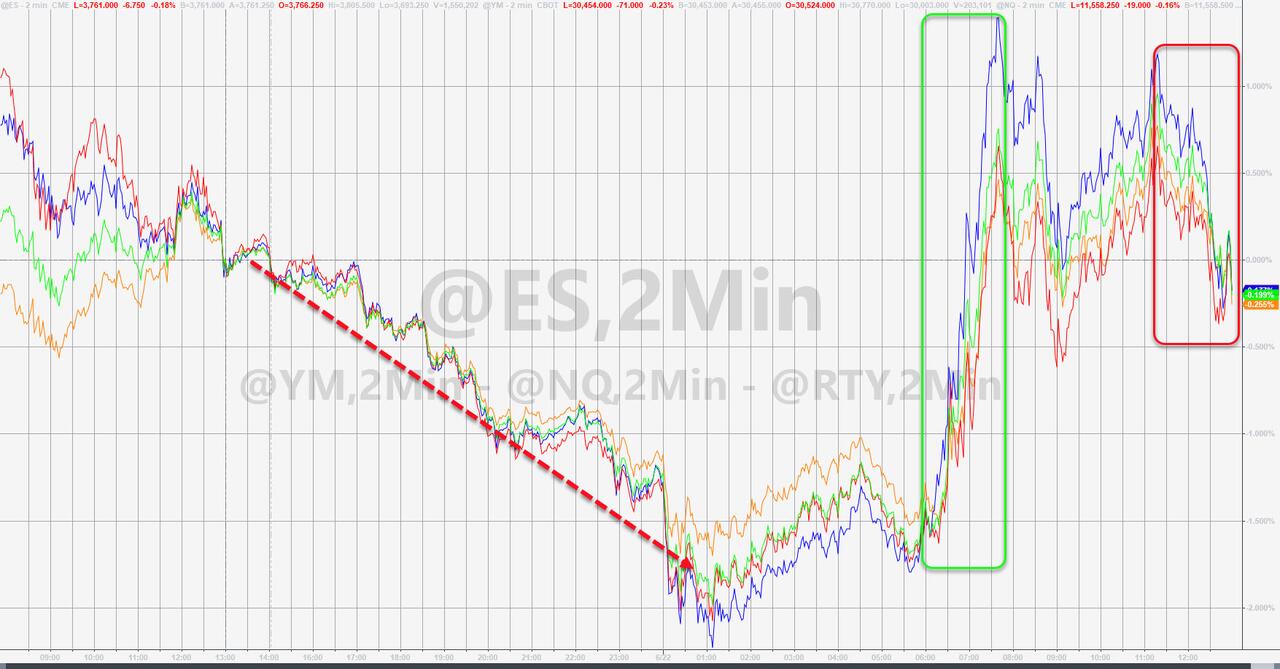
Initially, stocks had blasted higher, despite weakness in the futures markets. For a while, it looked like we were facing another “bad news is good news” scenario, as Fed President Harker opined that the “US economy might see a modest contraction in growth,” along with “we could have a couple of negative quarters.”
This negative talk was immediately translated as being a positive for the markets, as it would move the recession into the more immediate future, which would then result into inevitable rate cuts and a new QE program. That “should” translate into a revival of the bull market, or so the theory goes.
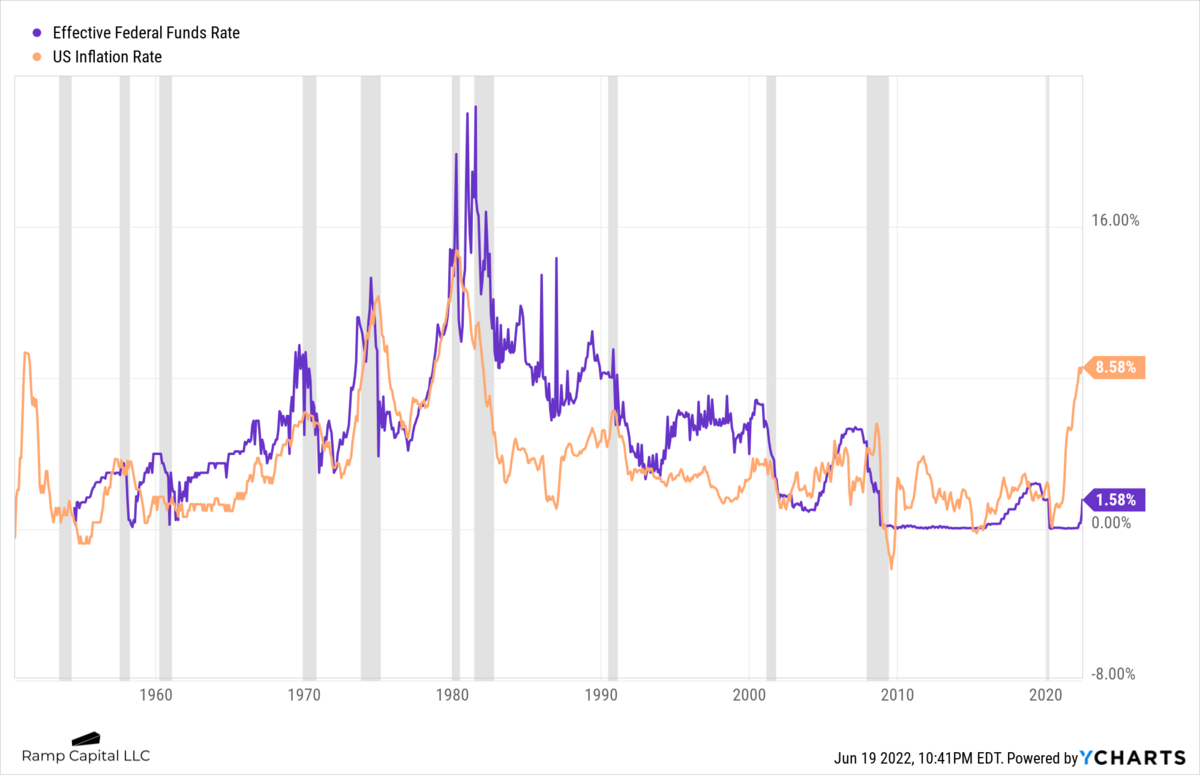
Regarding inflation, the Fed is way behind the curve and needs to implement a far more aggressive tightening cycle. Analyst Simon Ree tweeted this amazing stat:
Once inflation goes above 5%, it has never come back down without the Fed Funds rate exceeding the CPI.
As ZH explained, the problem is that the current CPI is 8.58% and the Fed Funds rate is only 1.58%. Graphically, it looks like this. That means the Fed would need to hike at least 7% until inflation would start to roll over and potentially allow for the so-called soft landing. Good luck with that…
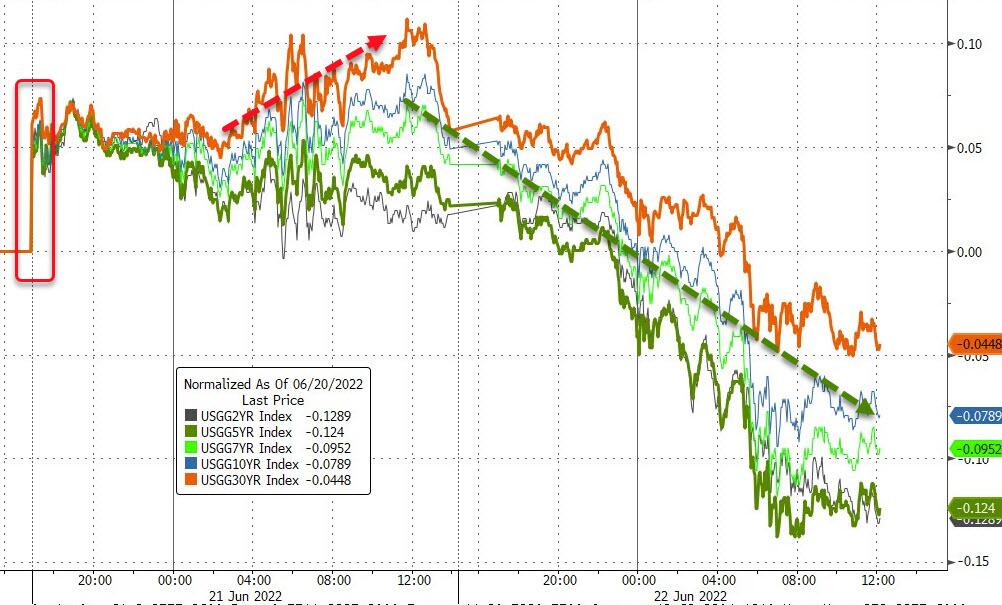
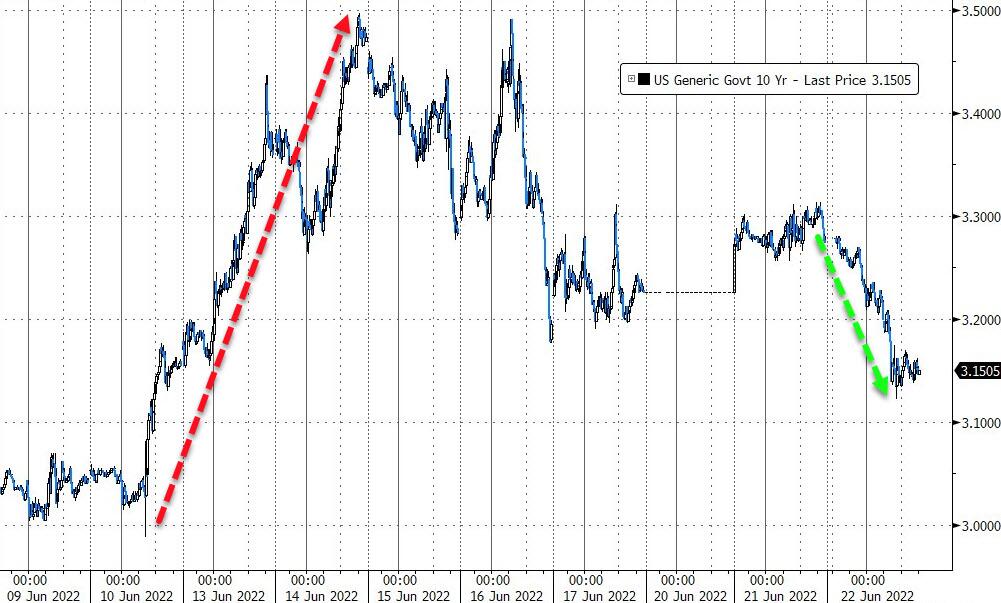
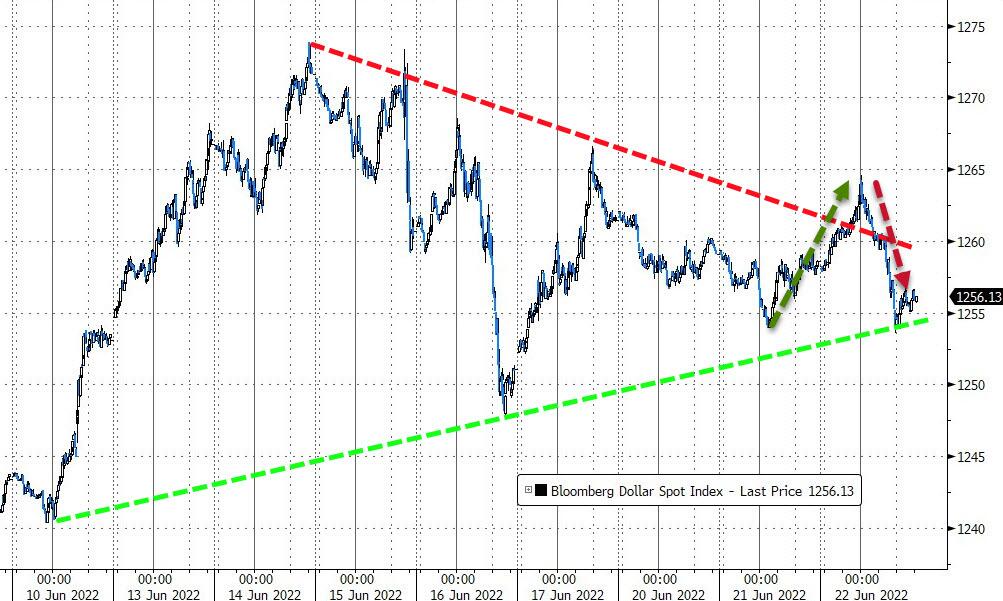
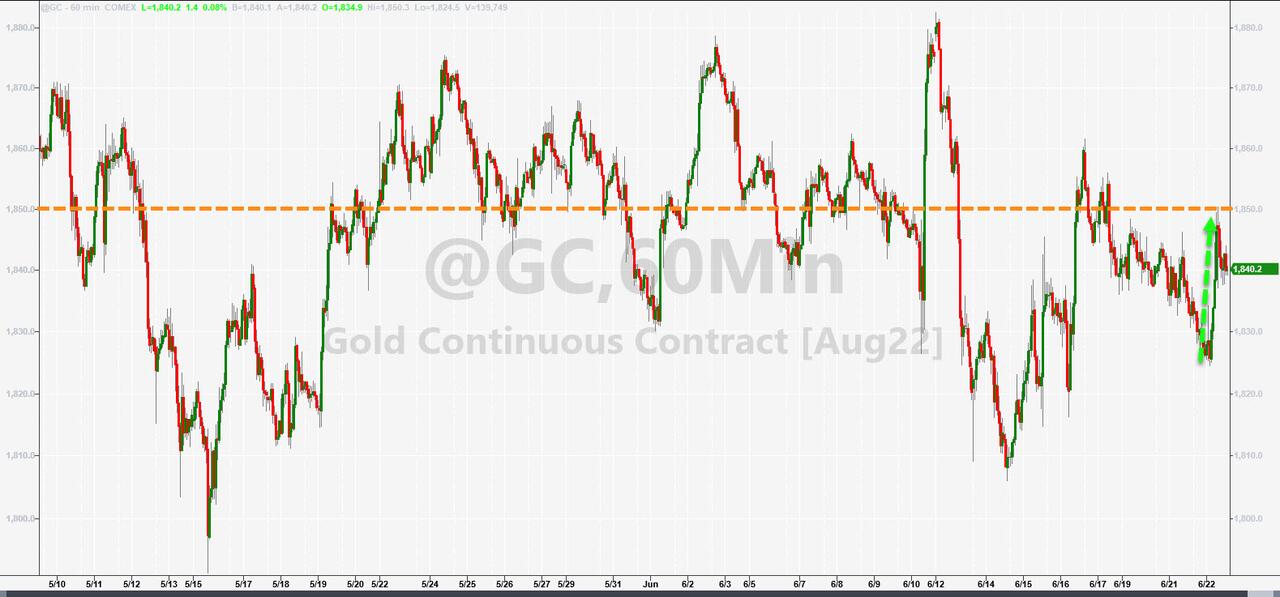
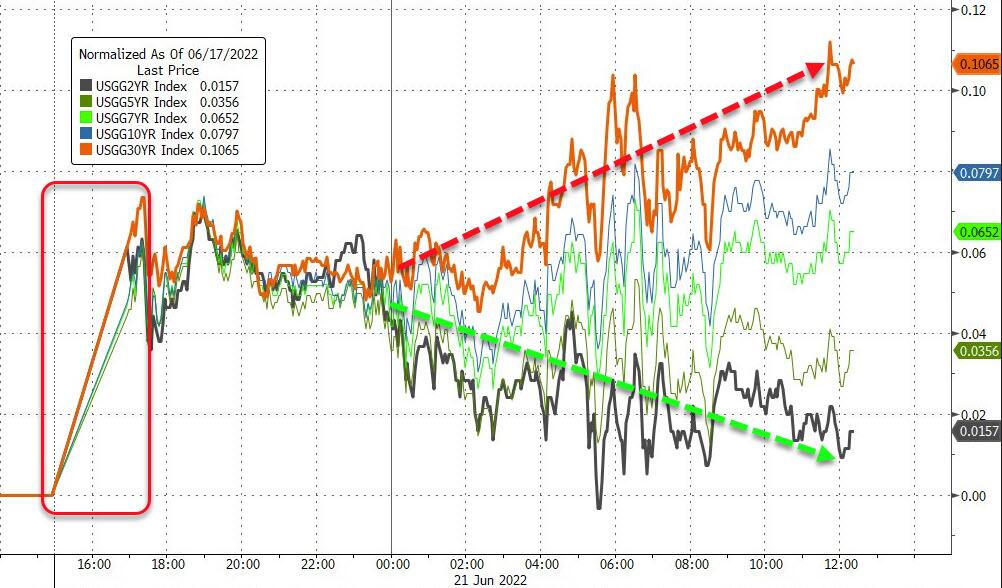
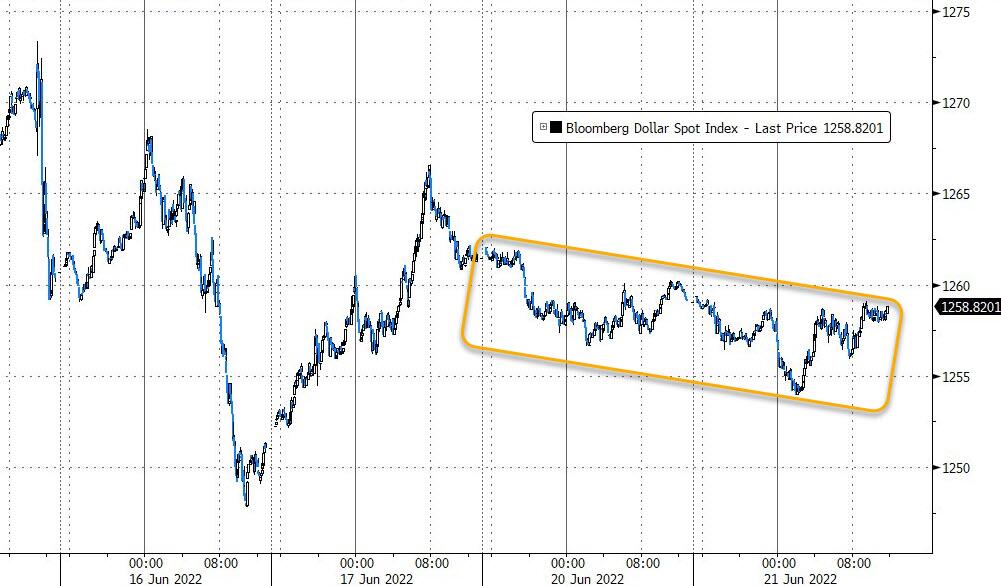
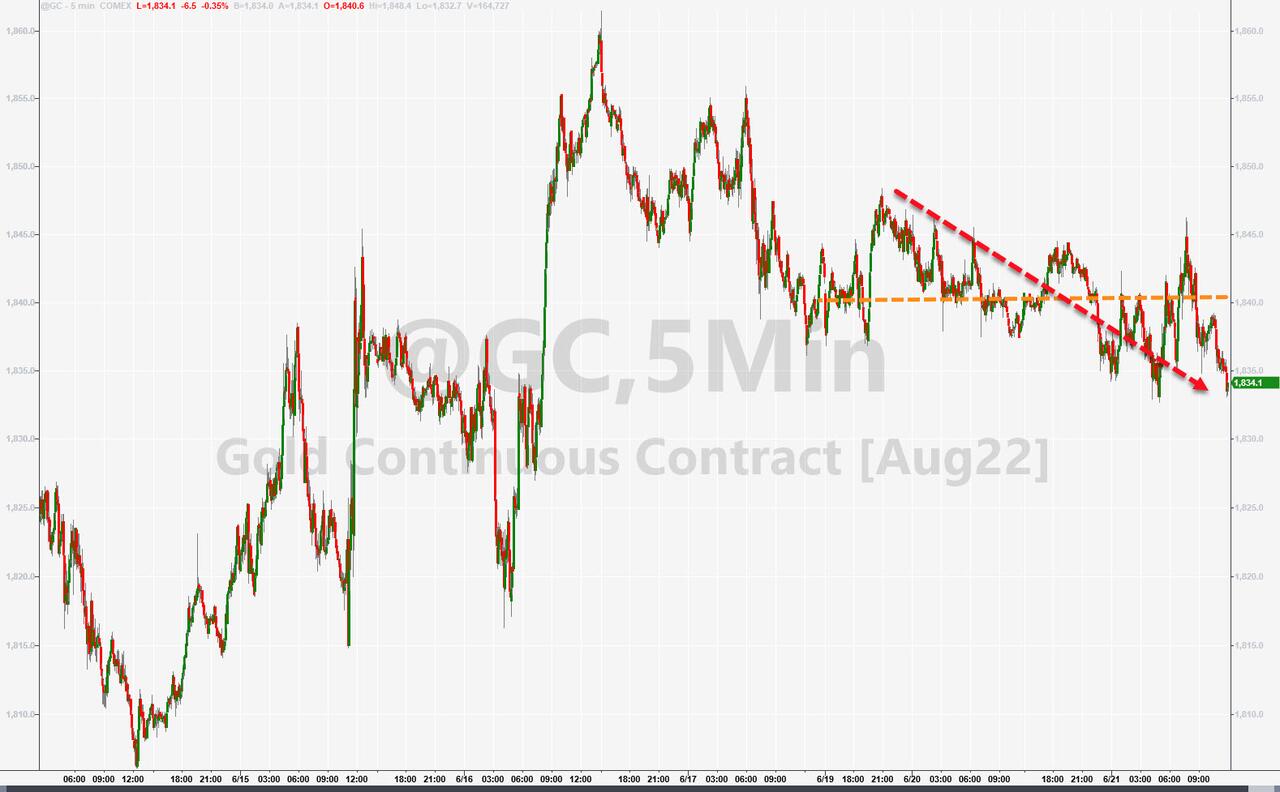
Despite falling bond yields, equities could not sustain any upward momentum. The 10-year plunged 12 bps to close at 3.16%. The US Dollar dumped after yesterday’s pump, while gold meandered aimlessly but closed a tad in the green.
Sure, we could see another short squeeze into the end of this quarter, but in my mind, its duration will be questionable.
It comes as no surprise that the major indexes would eventually manage a bounce back from the brutal losses not only YTD but also from last week, which saw the S&P 500 surrender -5.8%—its worst 5-day stretch since 2020.
A more aggressive stance on interest rate hikes by the Fed, and increasing odds of a recession, combined forces to give the bears the upper hand. Considering the ever-worsening economic numbers, any rebound may be short-lived, but opinions also abound that the sell off was way overdone.
For sure, rebounds or rallies into the end of any quarter occur with great regularity, which means we’ll have to wait till July to get a better handle on whether this is simply a dead-cat-bounce or a true bottom. I believe it’s the former and not the latter.
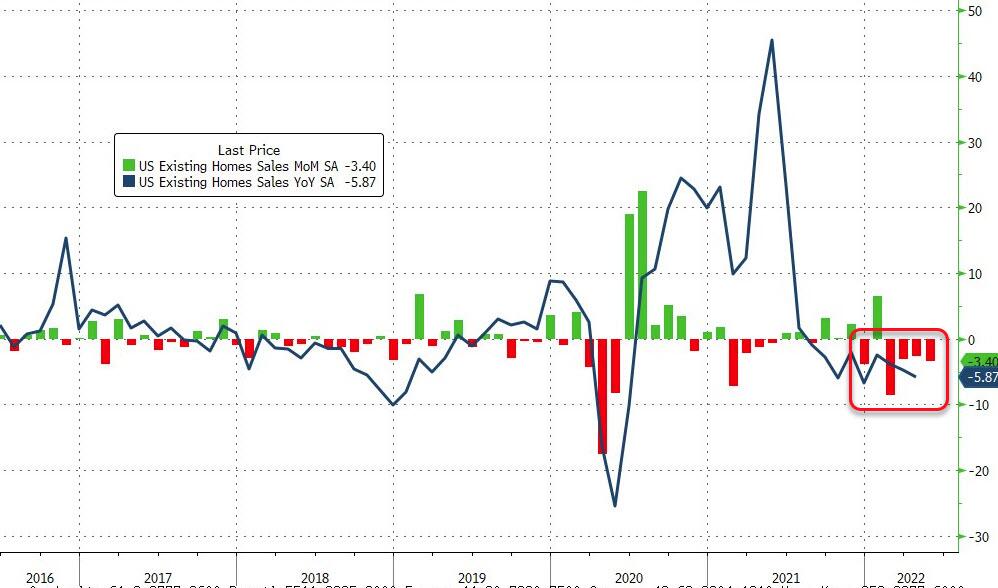
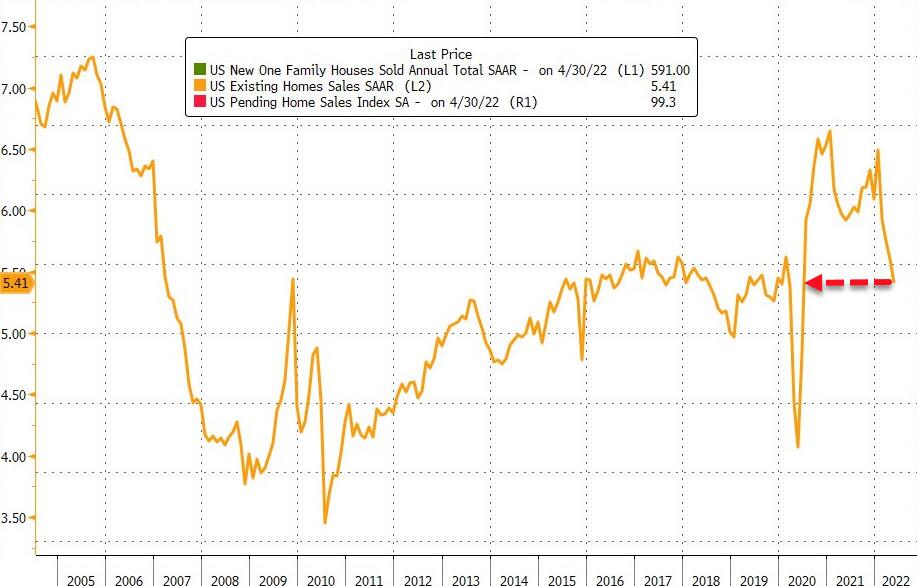
Looking at economic numbers, you must wonder what drove today’s rally. Existing Home Sales tumbled to a 2-year low, according to ZeroHedge, with the NAR warning that “worse is to come.”
Adding to that negativity was a deteriorating Chicago’s National Activity index. As a result, we can see that the Economic Surprise index keeps worsening. Bond yields were mixed with the 10-year adding 6 bps to close at 3.30%. The US Dollar slid, but it was not enough to lend support to gold, as the precious metal lost -0.42%.
In the end, today was simply a reprieve for the buy-and-holders, but keep in mind that one bullish day does not indicate a directional trend change.
Below, please find the latest High-Volume ETF Cutline report, which shows how far above or below their respective long-term trend lines (39-week SMA) my currently tracked ETFs are positioned.
This report covers the HV ETF Master List from Thursday’s StatSheet and includes 312 High Volume ETFs, defined as those with an average daily volume of more than $5 million, of which currently 22 (last week 41) are hovering in bullish territory. The yellow line separates those ETFs that are positioned above their trend line (%M/A) from those that have dropped below it.