Gambling On A Market Bottom

Ulli Market Commentary Contact

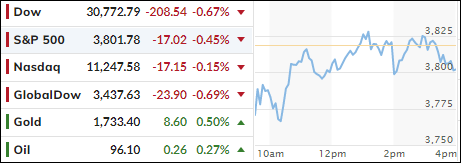
[Chart courtesy of MarketWatch.com]

  1. Moving the markets

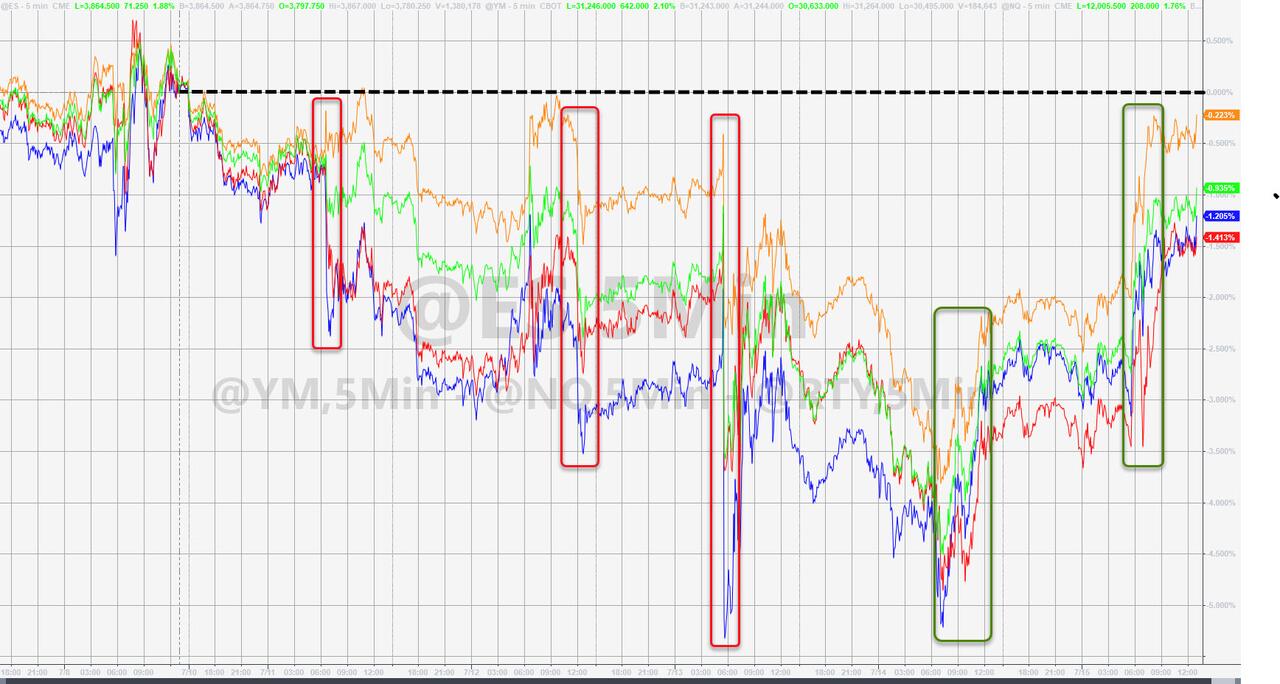
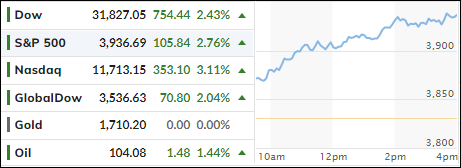
After experiencing bobbing, weaving and some head fakes, traders finally stepped up to the plate and put some money on the betting table that markets might have finally found a bottom.

Bullish sentiment received some support from strong earnings, which appeared to show that companies are adapting to economic challenges better than feared after the horrific 2nd quarter.

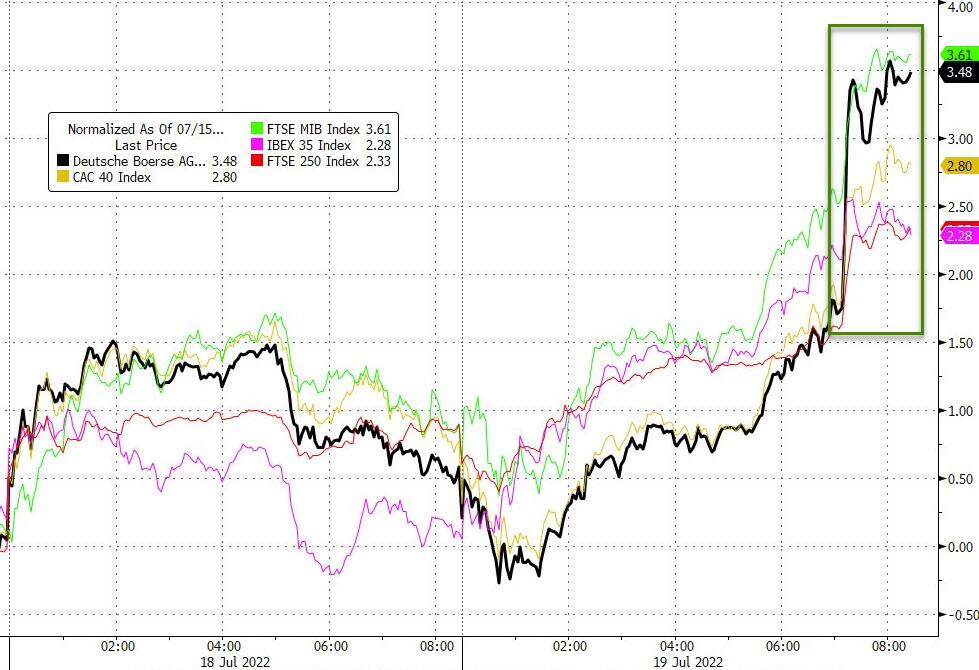
The charge was led by news out of Europe that the Russian gas flows via the Nord Stream 1 pipeline are seen starting on Thursday, after its scheduled maintenance, but at less than its capacity. That is the exact opposite of yesterday’s news report, which said that no gas flows were planned in the immediate future. We’ll see if today’s news was nothing but a rumor.

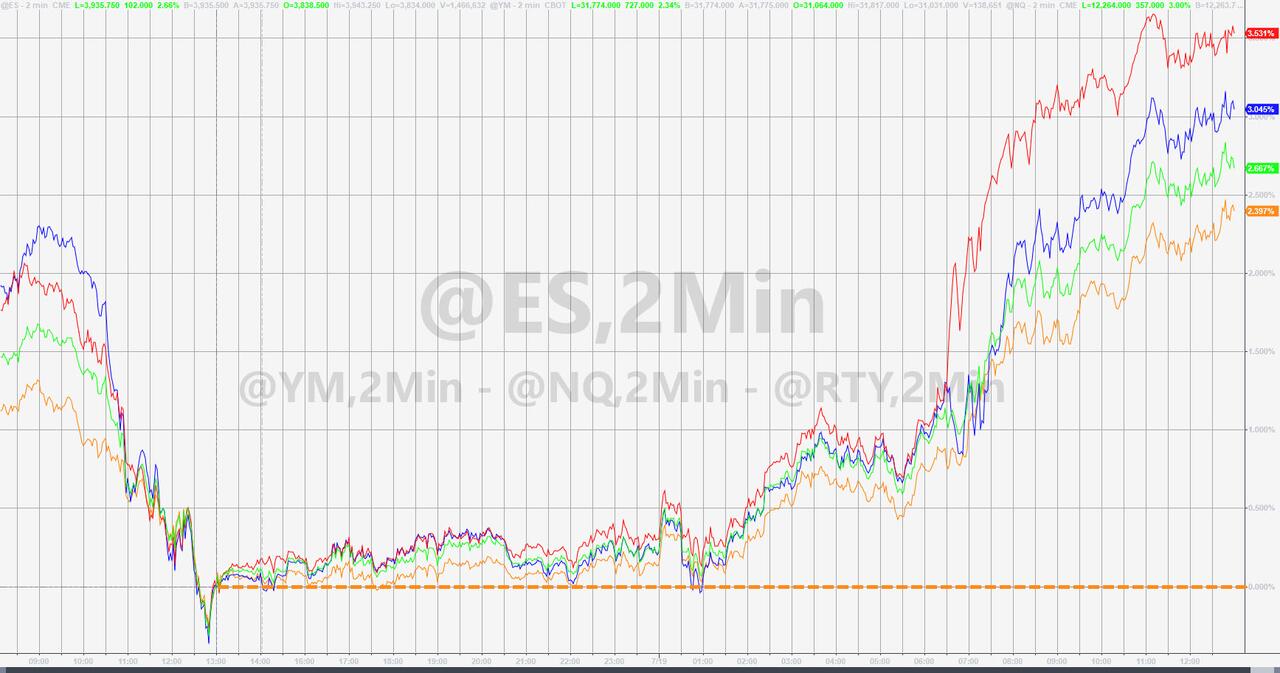
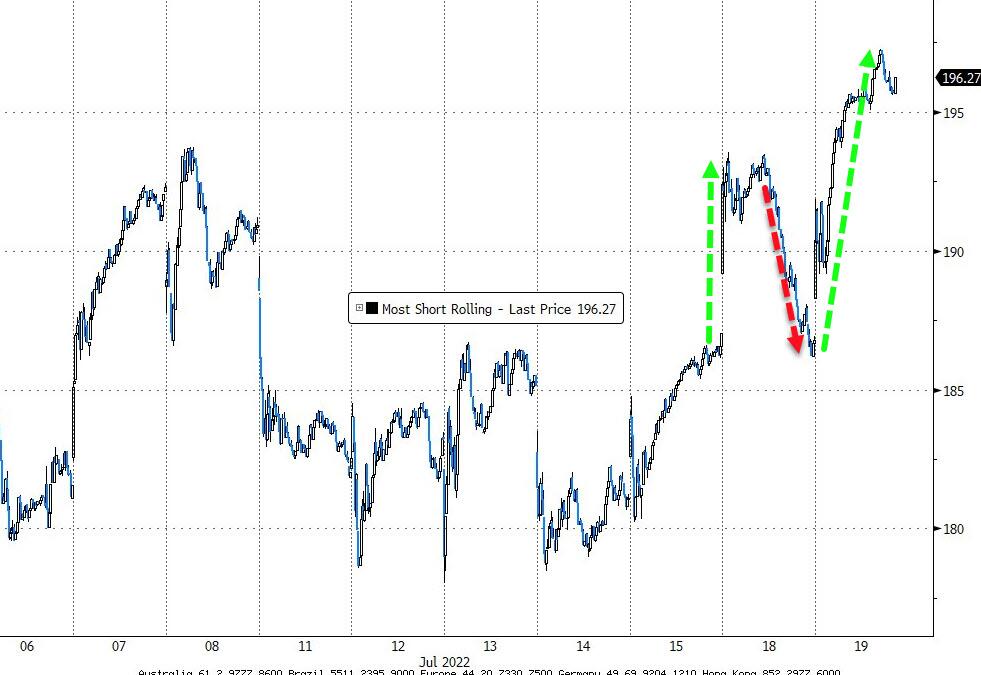
Be that as it may, the markets benefited, at least for the day, and the rally continued unrelenting for a change. Even ugly housing data, showing single-family home starts and permits crash, as ZH reported, did not put a dent in today’s market ramp, as another degree of support came from a gigantic short squeeze.  

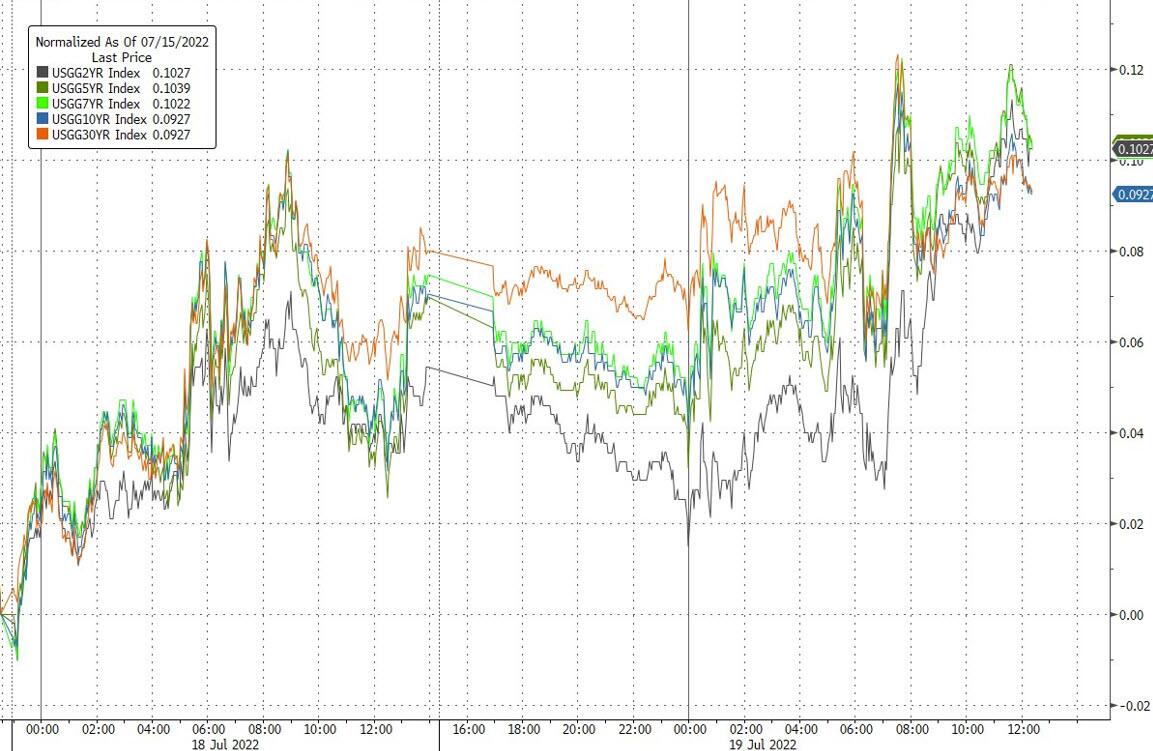
This Ramp-A-Thon knew no boundaries, as higher bond yields could not slow down the bullish effort either. And the 10-year conquering its 3% level and closing at 3.03% had no negative consequences on equities also.

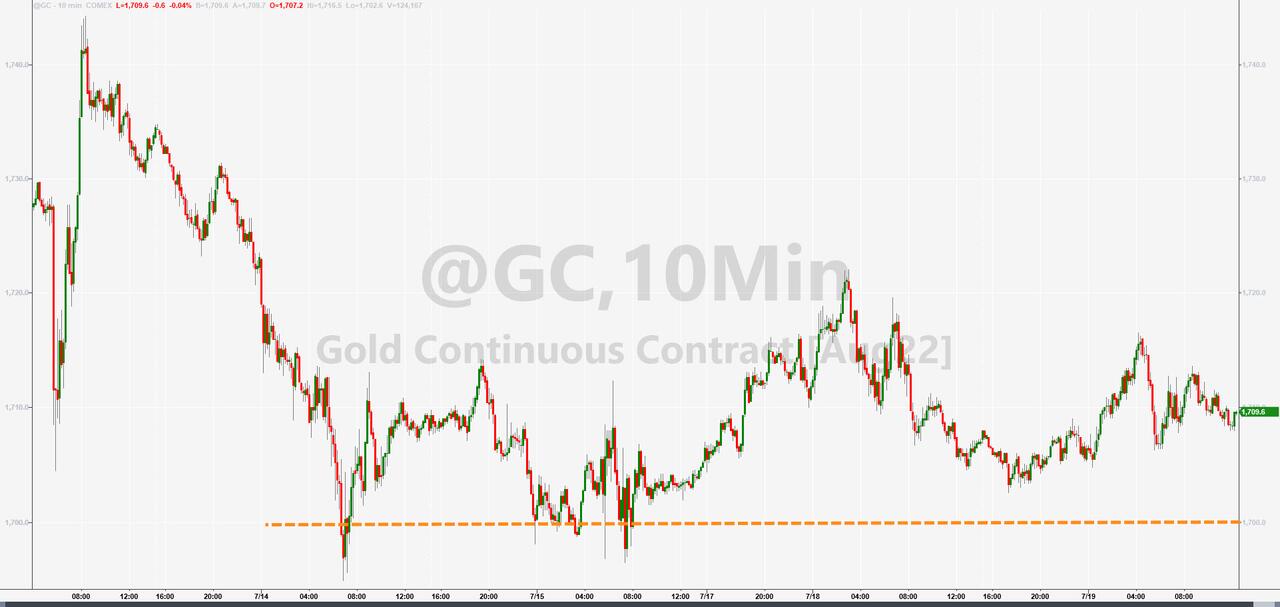
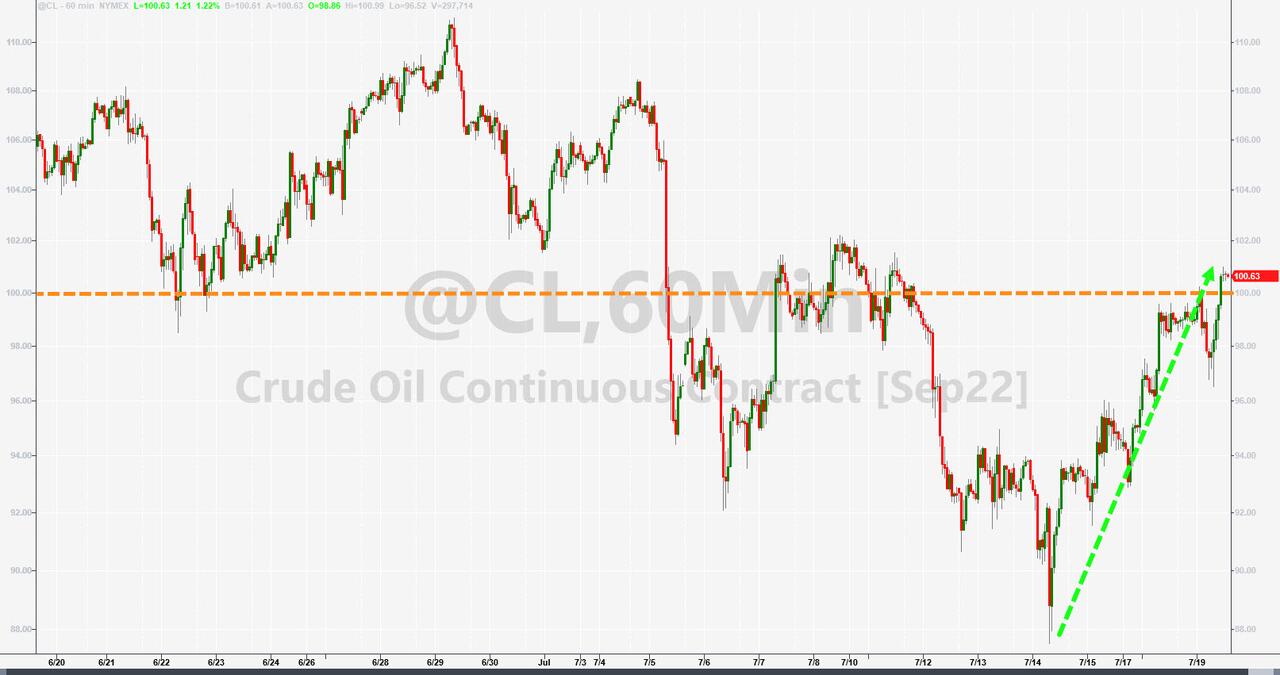
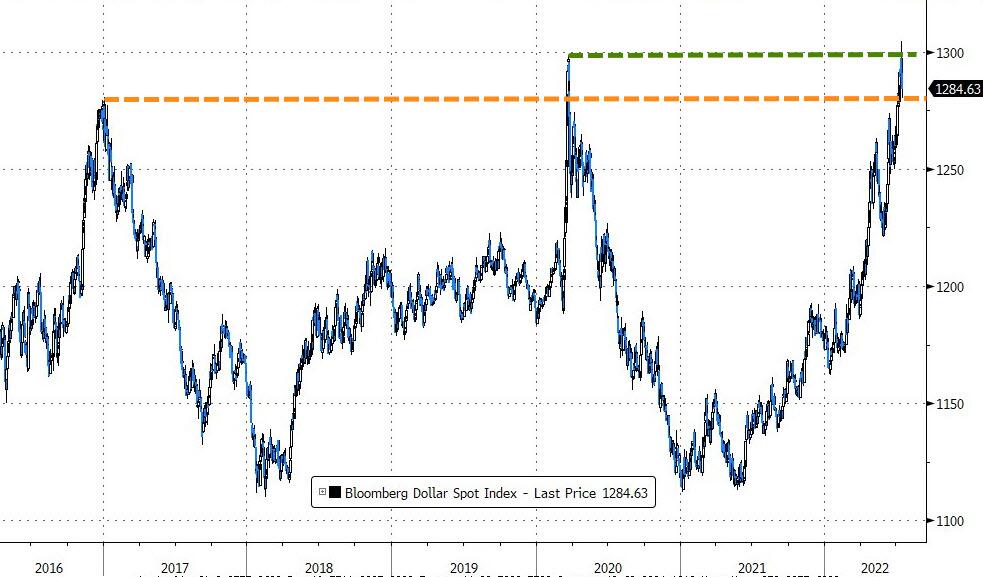
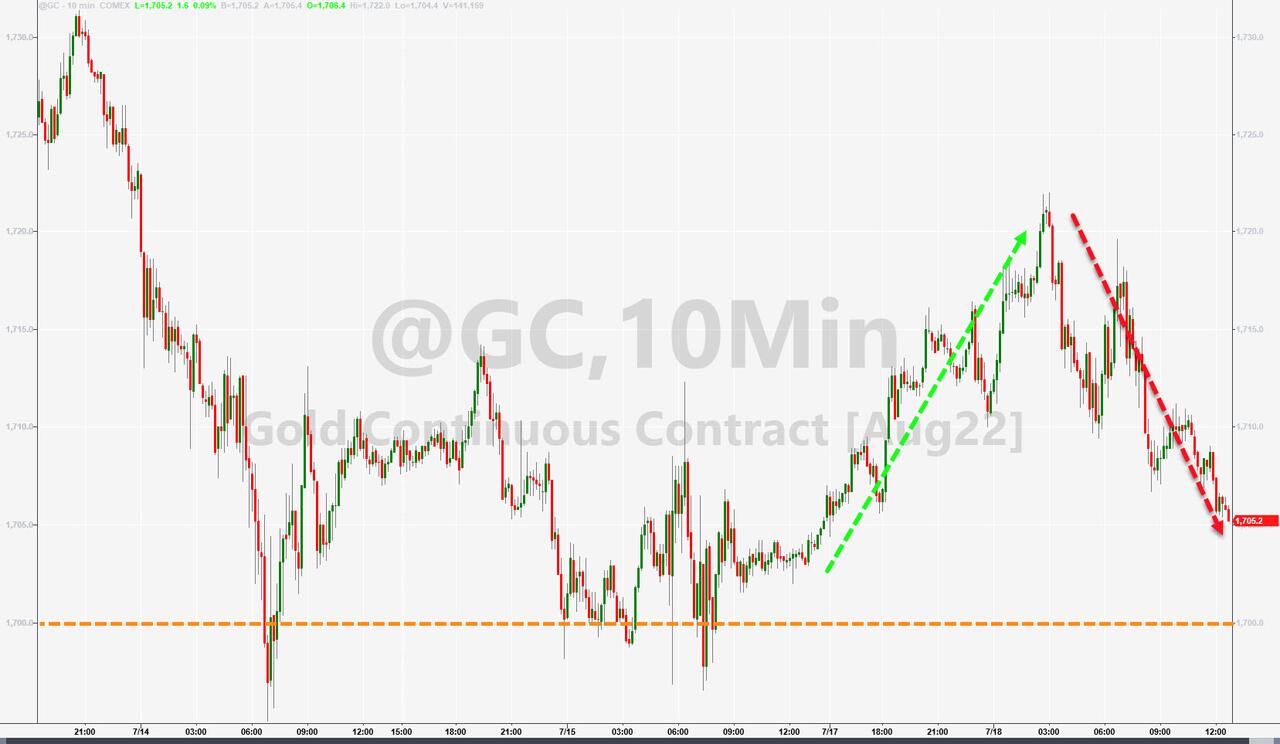
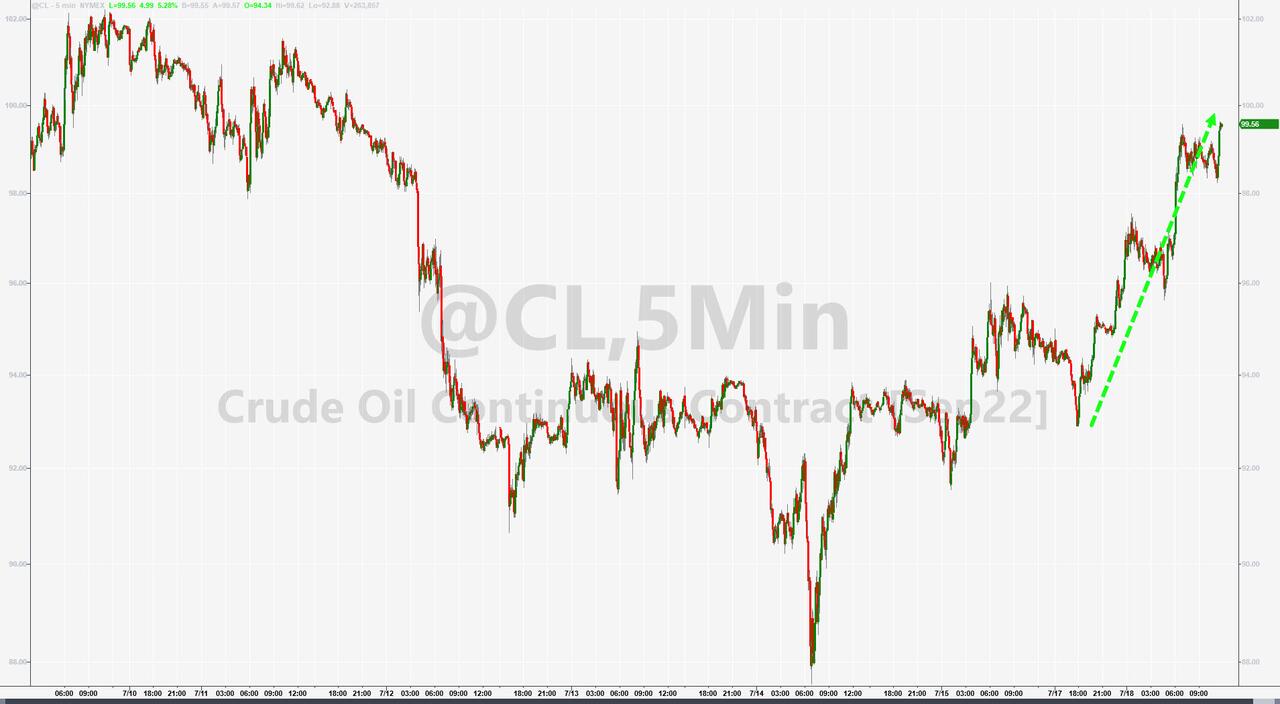
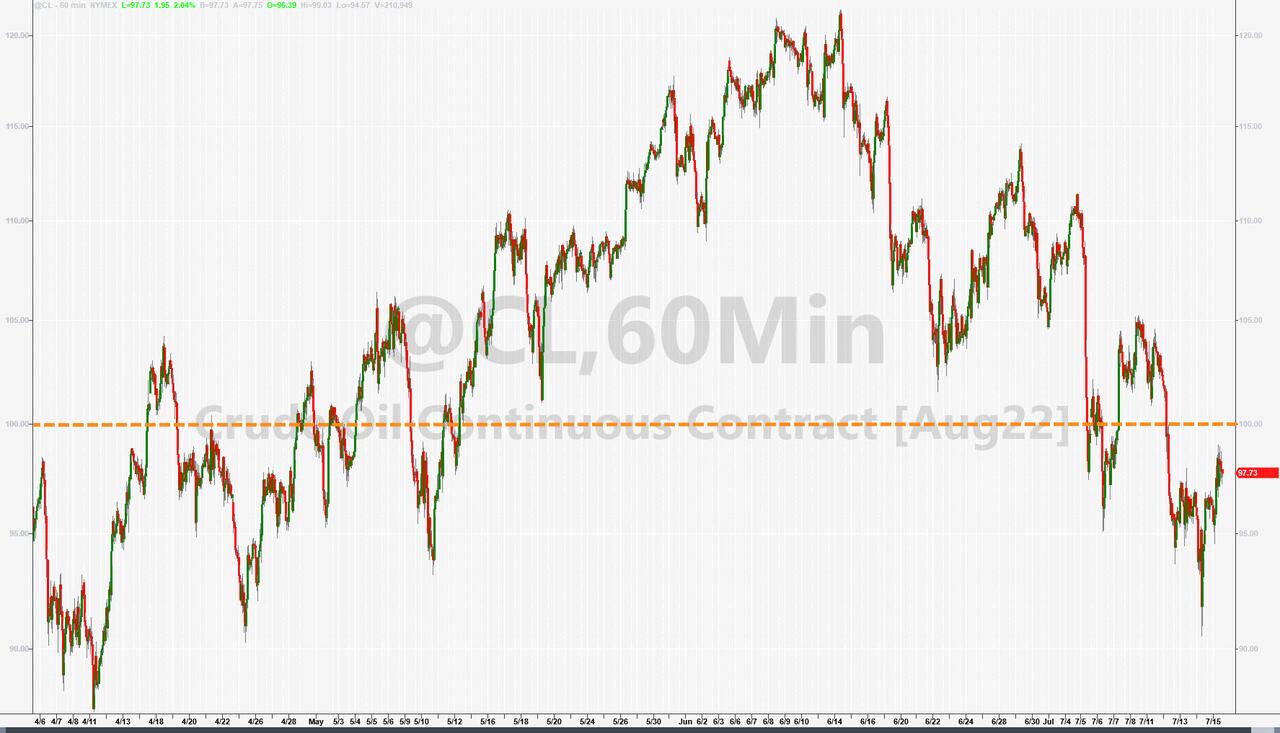
The US Dollar slumped for the 3rd day in a row and closed at two-week lows, while gold ended the session slightly higher, and Crude Oil recaptured its $100 level.  

I think we’ll find out within the next couple of weeks, if we have a resumption of the bull market or of this was simply another dead-cat-bounce in an ongoing bear market.

Read More
Head Fake!

Ulli Market Commentary Contact

[Chart courtesy of MarketWatch.com]

  1. Moving the markets

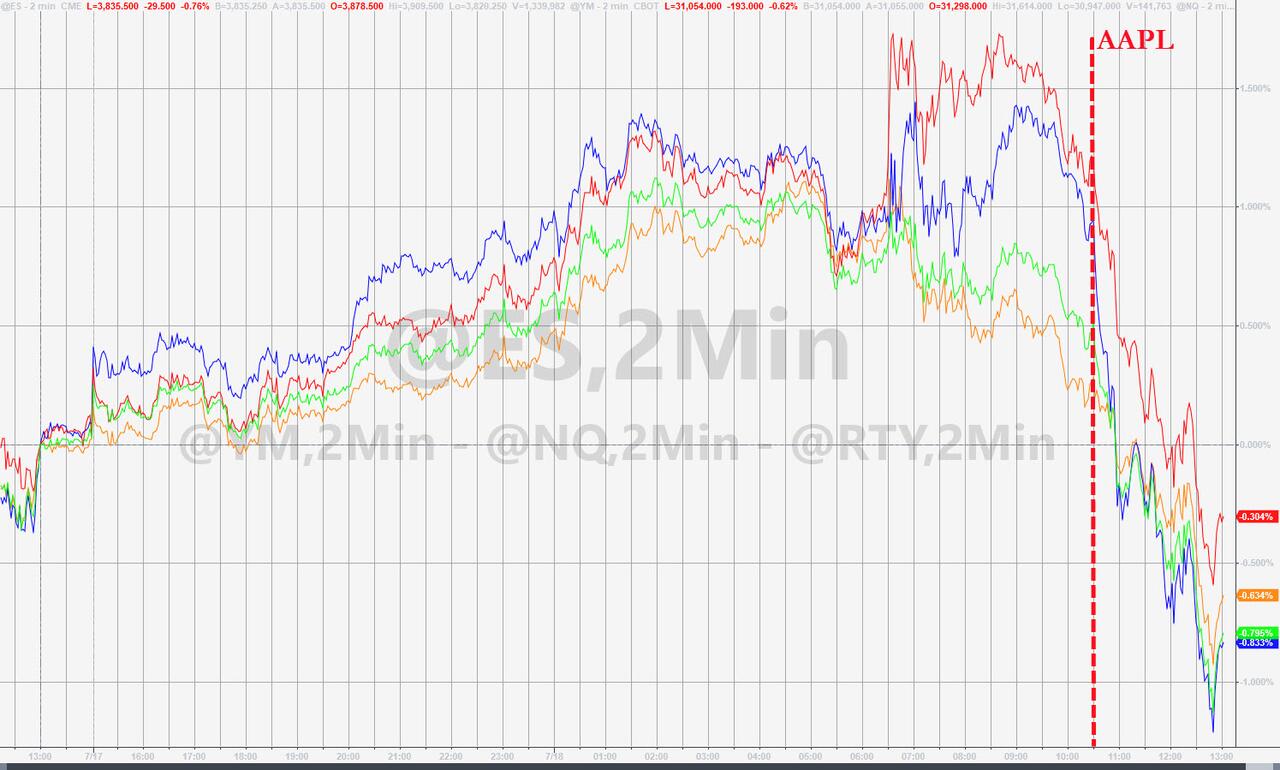
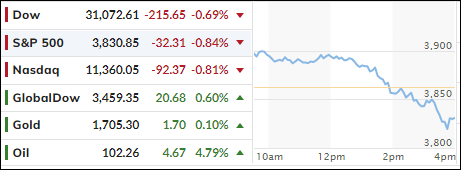
After Friday’s rebound, the markets followed through to the upside this morning, as positive earnings by banking powerhouse Goldman Sachs supported the bullish mood. But as we’ve seen many times in the past, sentiment lost steam, and south we went.

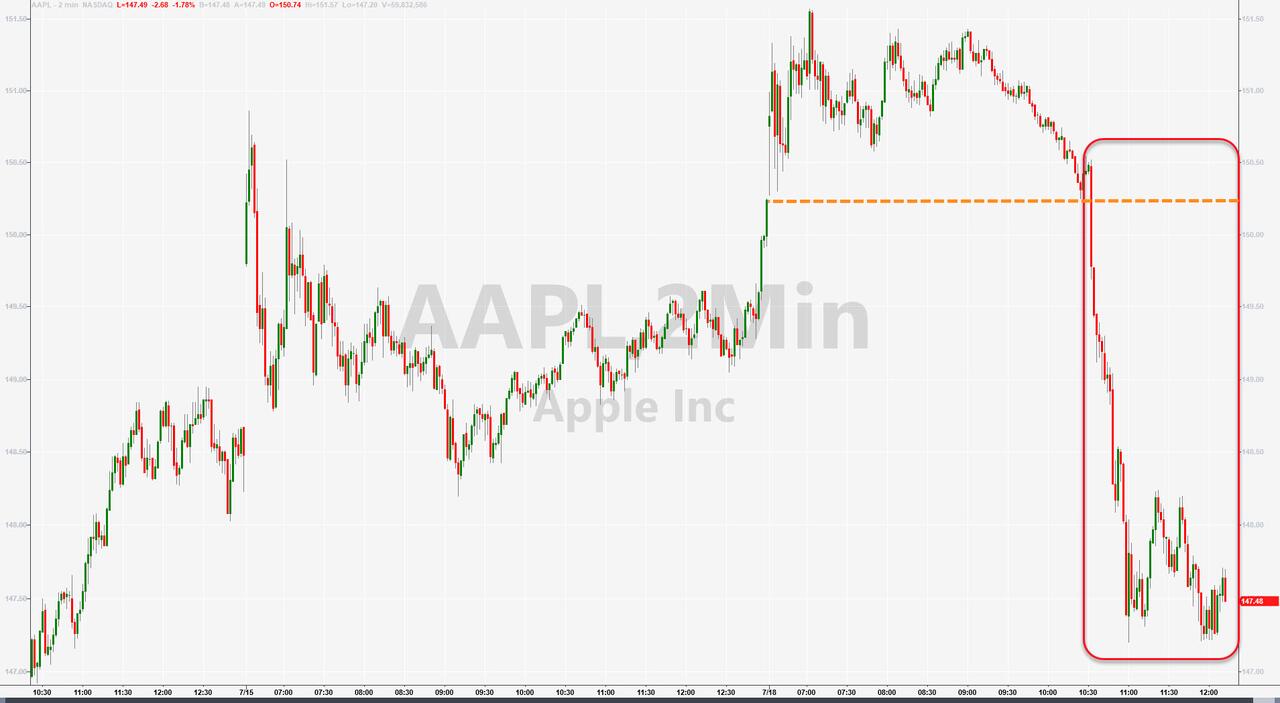
Contributing to that sudden sour mood was a report from Apple that it plans to slow hiring and spending on growth next year to better deal with a possible economic downturn. That took the starch out of the rally with the Dow not only giving up an almost 400-point gain but sinking into the red.

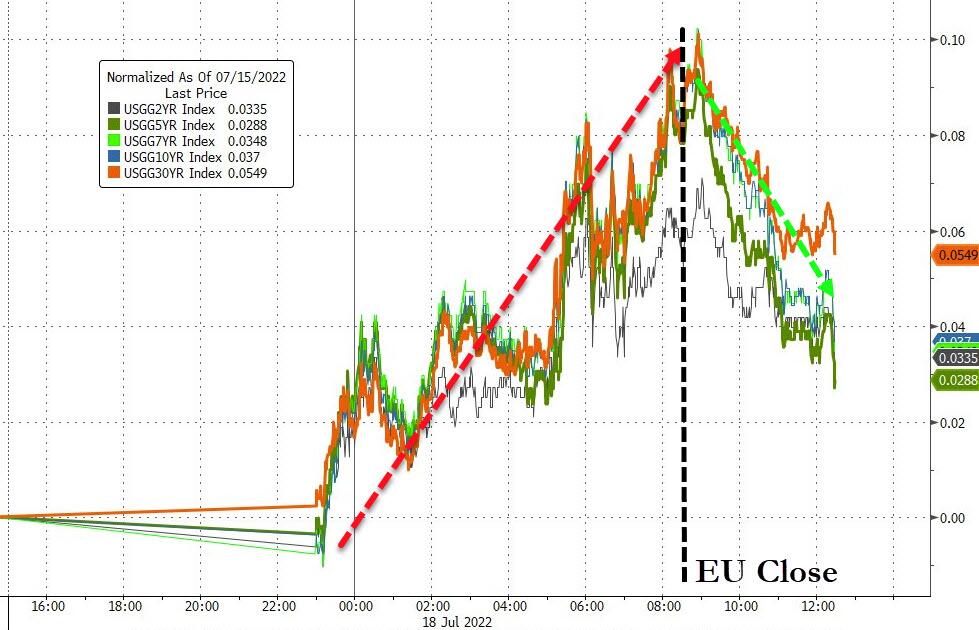
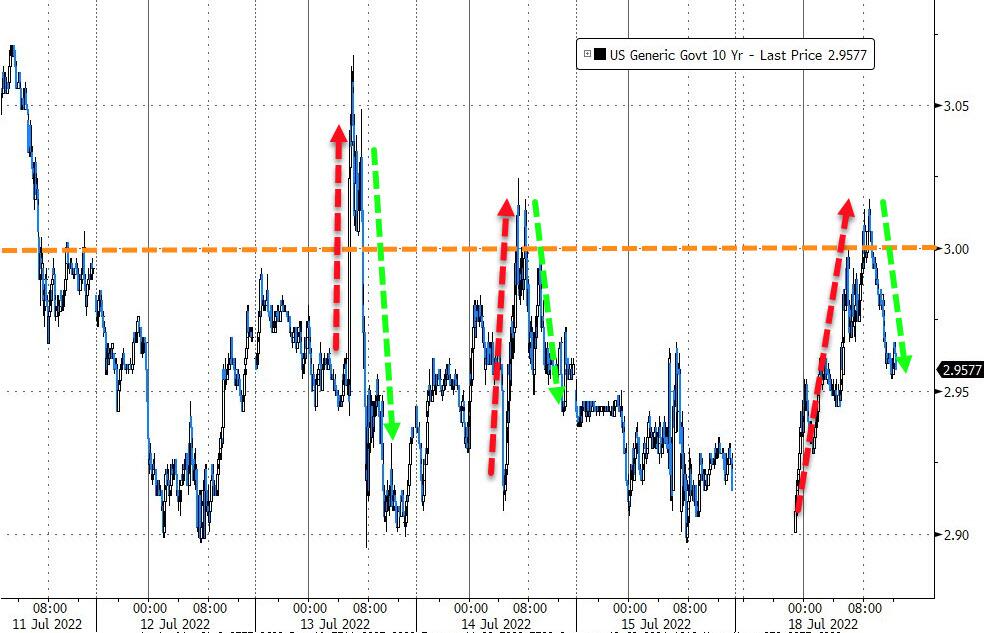
Bond yields rose, but the 10-year failed to climb back above its 3% level. The US Dollar touched its March 2020 highs but retreated and closed lower. Gold ripped and dipped and ended up a tad in the green.  

Crude oil prices surged back over $100, despite the current administration’s attempt to persuade the Saudis to produce more oil which, based on today’s response, did not work out too well.

Earnings season will now accelerate, and surprises, up and down, are pretty much guaranteed with future market direction being depended on the headline of the day.

Read More
ETFs On The Cutline – Updated Through 07/15/2022

Ulli ETFs on the Cutline Contact

Below, please find the latest High-Volume ETF Cutline report, which shows how far above or below their respective long-term trend lines (39-week SMA) my currently tracked ETFs are positioned.

This report covers the HV ETF Master List from Thursday’s StatSheet and includes 312 High Volume ETFs, defined as those with an average daily volume of more than $5 million, of which currently 17 (last week 21) are hovering in bullish territory. The yellow line separates those ETFs that are positioned above their trend line (%M/A) from those that have dropped below it.

Take a look:                                                                   

The HV ETF Master Cutline Report

In case you are not familiar with some of the terminology used in the reports, please read the Glossary of Terms. If you missed the original post about the Cutline approach, you can read it here.      

ETF Tracker Newsletter For July 15, 2022

Ulli ETF Tracker Contact

ETF Tracker StatSheet          

You can view the latest version here.

GAINING FOR THE DAY BUT SLIPPING FOR THE WEEK

[Chart courtesy of MarketWatch.com]

  1. Moving the markets

After four days of failed rebound attempts, the major indexes finally managed to squeeze out a gain for the day but ended up losing for the week in conjunction with the S&P 500 surrendering -0.92%.

Hope reigned supreme that the Fed might not deliver a full 1% interest rate hike later this month with traders wishing that we could be getting closer to the much-anticipated peak tightening.

Supporting bullish sentiment was preliminary retails sales data, which beat expectations. Also helping traders and algos alike were comments from Atlanta Fed President Bostic indicating he would “likely” not support a potentially higher rate move due to the negative influence on “undermining a lot of those things that are working well.”

On the other hand, the logic that strong retail sales could motivate a broad-based rally makes no sense to me, because that strong data point is exactly the reason for the Fed to continue its rate hikes. Otherwise, how else will they ever be able to slow down the economy and conquer inflation?  

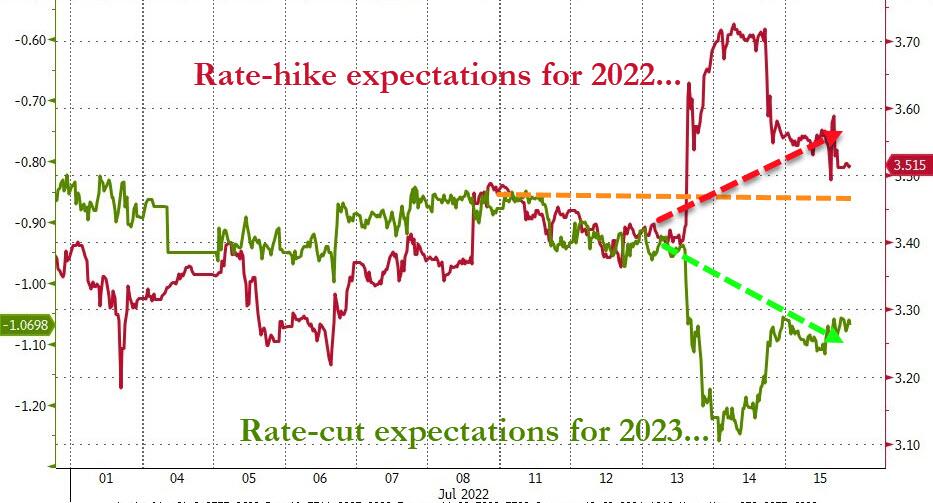
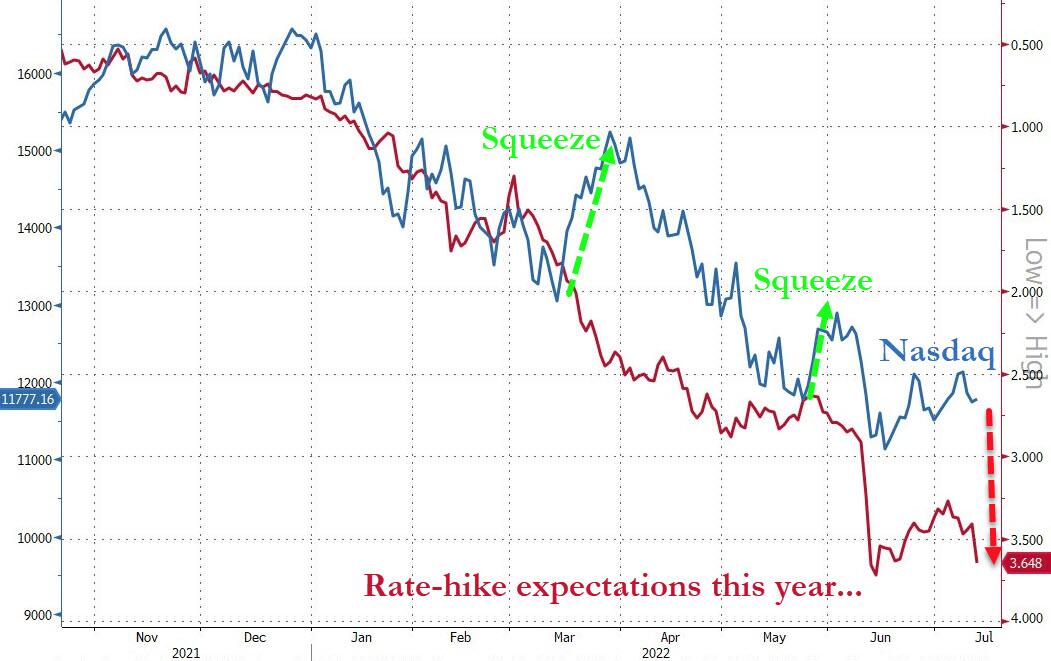
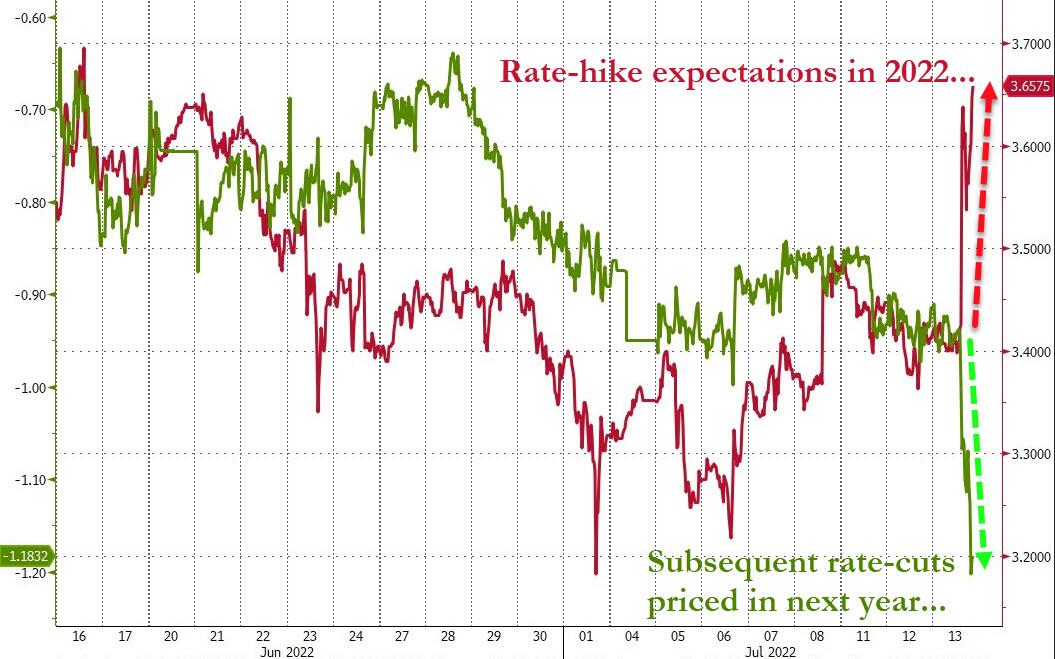
Yesterday’s ‘hot’ CPI reading of 9.1% clearly makes the case for more rate hikes. We have now a divergence with rate-hike expectations soaring and rate-cut expectations also soaring for next year, after the Fed “deepens the recession,” as ZeroHedge describes it.

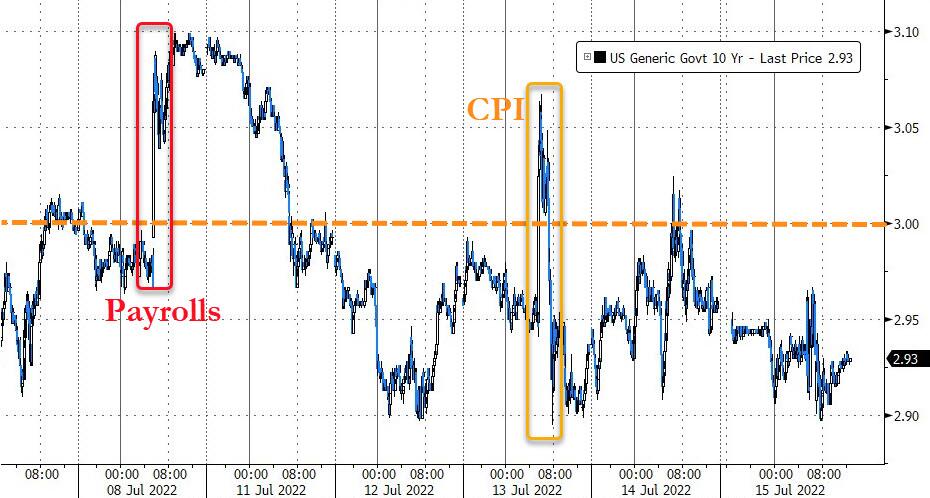
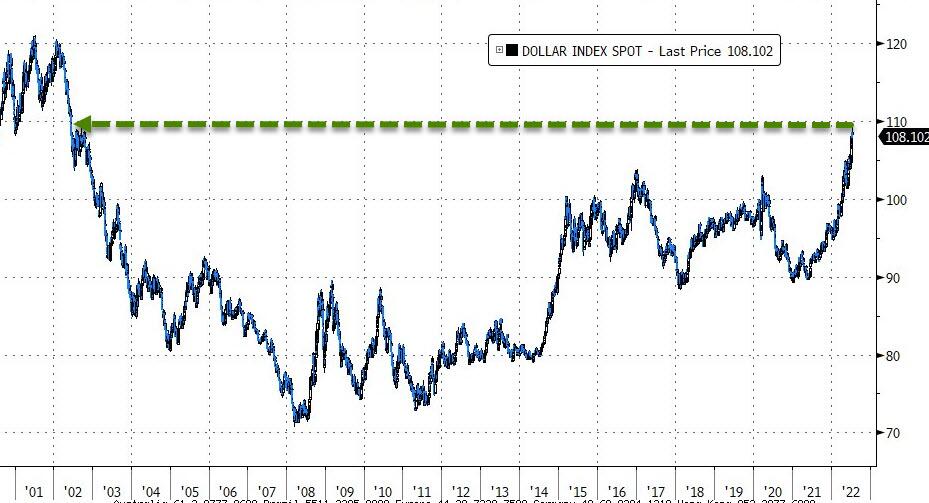
Bond yields were mixed this week with only the 2-year gaining, while all others retreated slightly. After much bobbing and weaving, the 10-year closed back below its 3% level. The US Dollar continued its rampage, closed higher for the 6th week in the last 7 and ended at its highest since 2002.

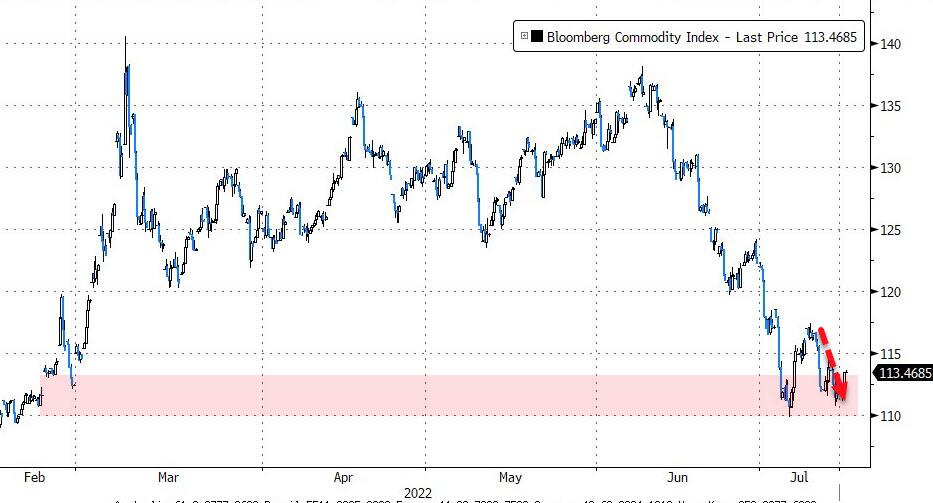
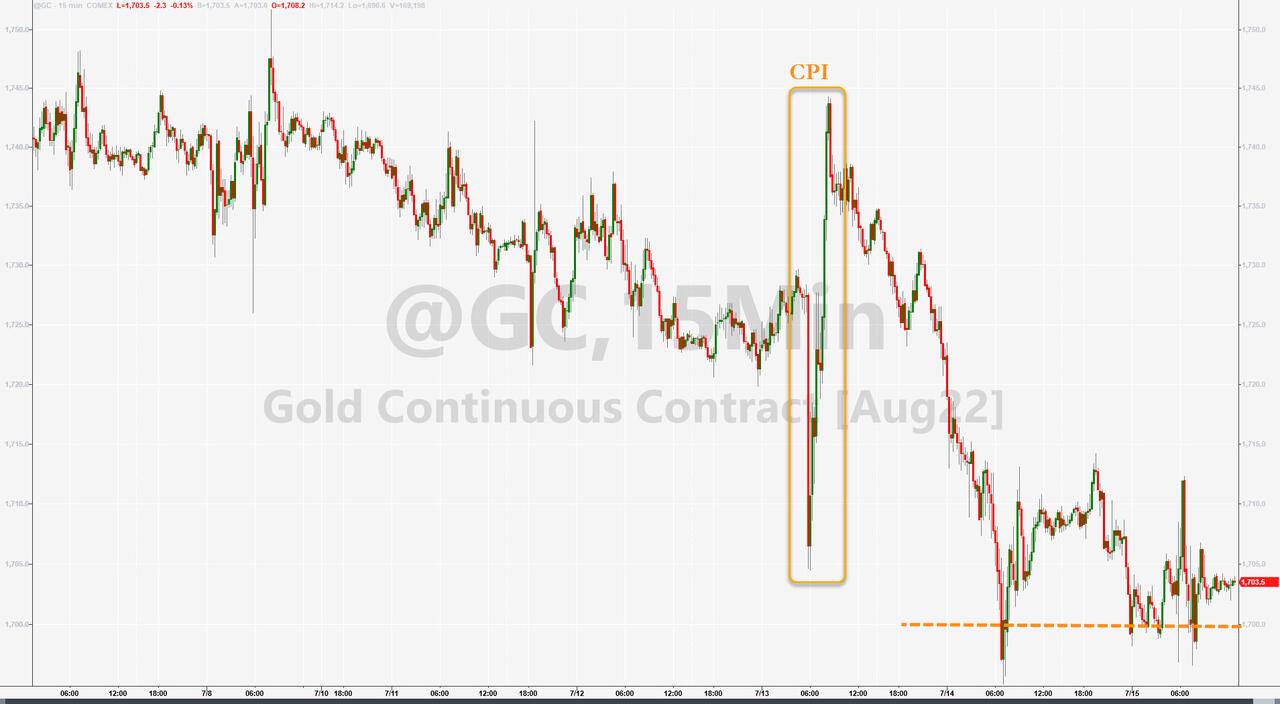
Commodities tumbled for their 5th straight week, as did gold, with the precious metal testing its $1,700 level. Crude oil prices struggled as well and ended the week below $100.

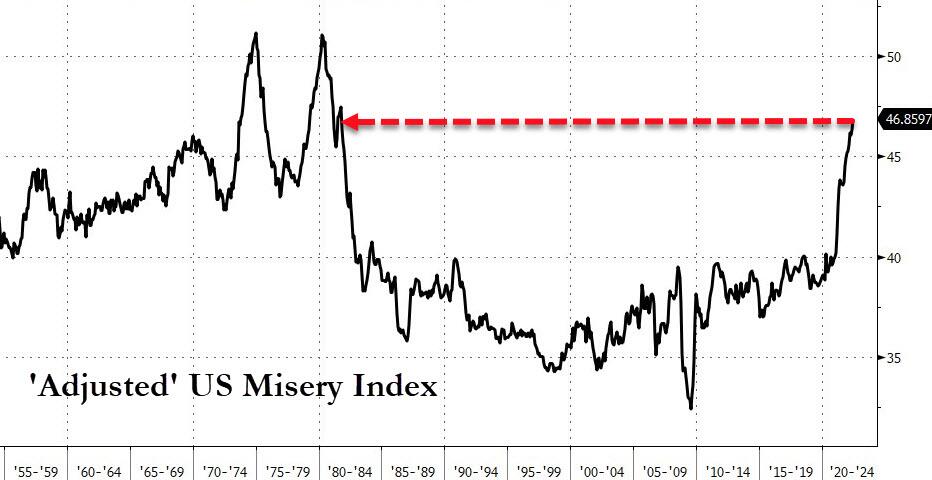
In the end, the misery index says it all, since it is now at its highest since Carter was President.

Ouch!

Read More
Weekly StatSheet For The ETF Tracker Newsletter – Updated Through 07/14/2022

Ulli ETF StatSheet Contact

ETF Data updated through Thursday, July 14, 2022

Methodology/Use of this StatSheet:

1. From the universe of over 1,800 ETFs, I have selected only those with a trading volume of over $5 million per day (HV ETFs), so that liquidity and a small bid/ask spread are assured.

2. Trend Tracking Indexes (TTIs)

Buy or Sell decisions for Domestic and International ETFs (section 1 and 2), are made based on the respective TTI and its position either above or below its long-term M/A (Moving Average). A crossing of the trend line from below accompanied by some staying power above constitutes a “Buy” signal. Conversely, a clear break below the line constitutes a “Sell” signal. Additionally, I use an 12% trailing stop loss on all positions in these categories to control downside risk.

3. All other investment arenas do not have a TTI and should be traded based on the position of the individual ETF relative to its own respective trend line (%M/A). That’s why those signals are referred to as a “Selective Buy.” In other words, if an ETF crosses its own trendline to the upside, a “Buy” signal is generated. Here too, I recommend trailing sell stop of 12%, or less, depending on your risk tolerance.

If you are unfamiliar with some of the terminology, please see Glossary of Terms and new subscriber information in section 9.     

1. DOMESTIC EQUITY ETFs: SELL — since 02/24/2022

Click on chart to enlarge

Our main directional indicator, the Domestic Trend Tracking Index (TTI-green line in the above chart) has broken below its long-term trend line (red) by -12.02% and remains in “SELL” mode.  

Read More
CPI Shock: Markets Tank, Crank, And Tank

Ulli Market Commentary Contact

[Chart courtesy of MarketWatch.com]

  1. Moving the markets

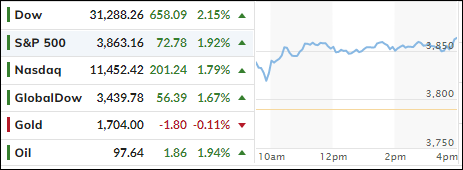
A hotter-than expected inflation report showed that the CPI rose 9.1% YoY in June, which was higher than May’s 8.6% reading, that had been the biggest increase since 1981. Economists expected an 8.8% print.

Even the Core CPI, which excludes food and energy, came in at 5.9% and topped the 5.7% estimate. On a monthly basis, the CPI was up 1.3% compared to hopes of 1.1%. Finally, some traders and investors are waking up to the fact that inflation has not yet reached its peak—far from it, in my opinion.

Initial market reaction was fast and furious with the Dow dropping over 400 points before staging a comeback. The reason for that sudden rebound was a report in the WSJ by Fed leaker Timiraos that a suddenly much feared 100bps rate hike in two weeks may not be realistic but a 75bps was.

That sent equities almost into a vertical ascent with the S&P 500 and the Nasdaq briefly seeing green numbers. However, Atlanta Fed President Bostic pulled the rug out from under this rally with quotes like this:

“Everything is in play.”

Asked if that included by raising rates by a full percentage point, he replied:

“it would mean everything.”

That destroyed any hope or confidence the WSJ article had created, so the major indexes headed back south but closed off their worst levels for the session.

It means rate hike expectations are rising this year, with subsequent rate cuts virtually guaranteed in 2023, as the Fed will bail us out of a deep recession, as ZeroHedge put it.

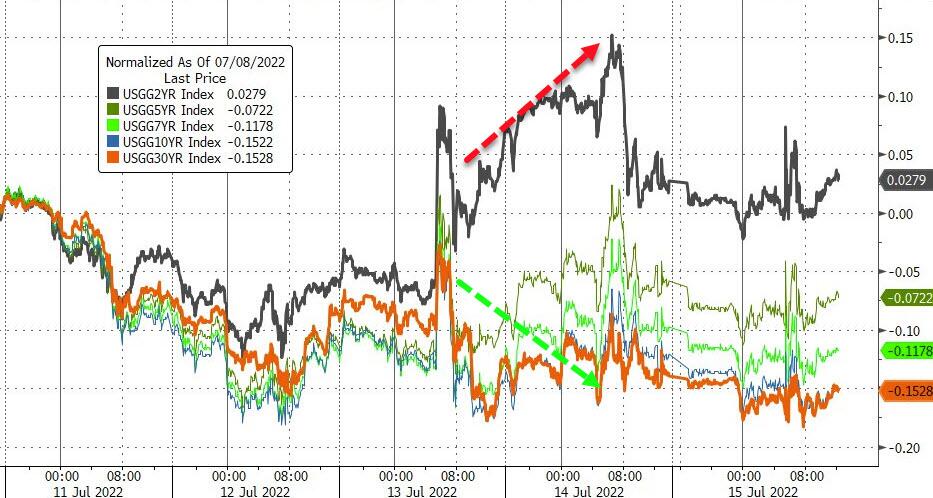
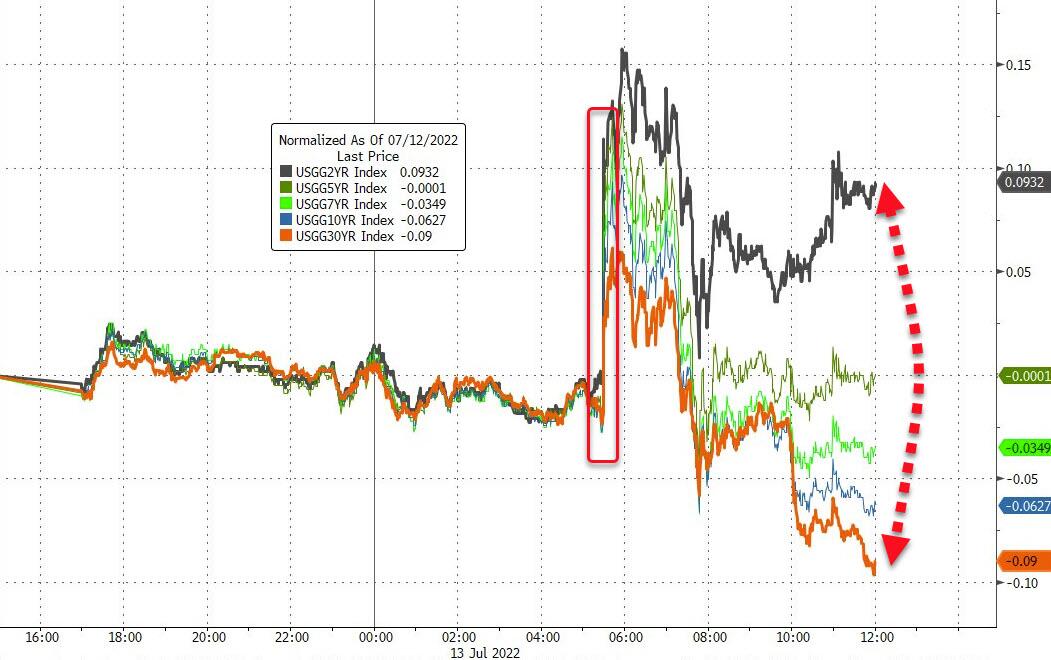
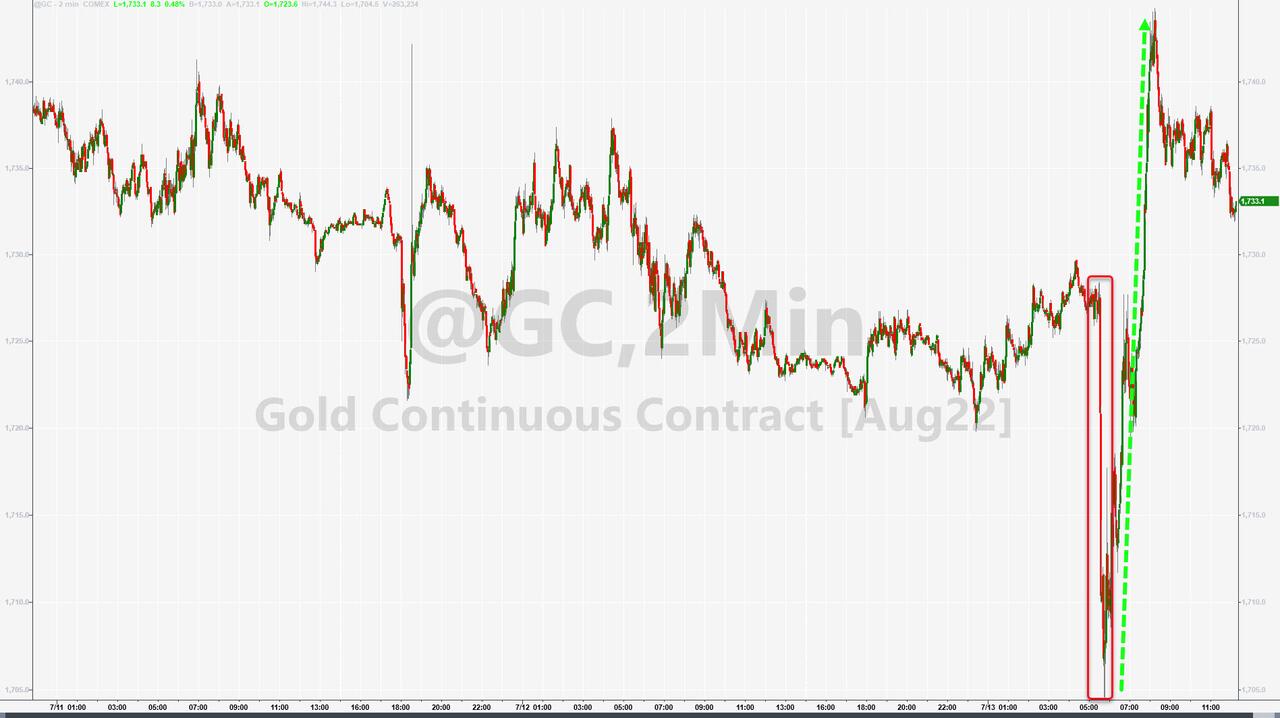
Bond yields spiked following the release of the CPI report, then dropped with only the 2-year yield closing higher. Gold rode its own roller coaster. The precious metal first puked then spiked and closed with modest gains.

ZH summed up the current environment like this:

  • Stocks are still bipolar, and squeeze driven, as well as hoping beyond hope that the subsequent easing, after The Fed pushes the economy into recession, will save the day…

 Hmm…

Read More