
- Moving the markets
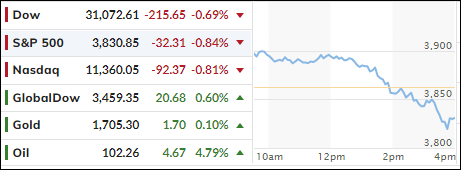
After Friday’s rebound, the markets followed through to the upside this morning, as positive earnings by banking powerhouse Goldman Sachs supported the bullish mood. But as we’ve seen many times in the past, sentiment lost steam, and south we went.
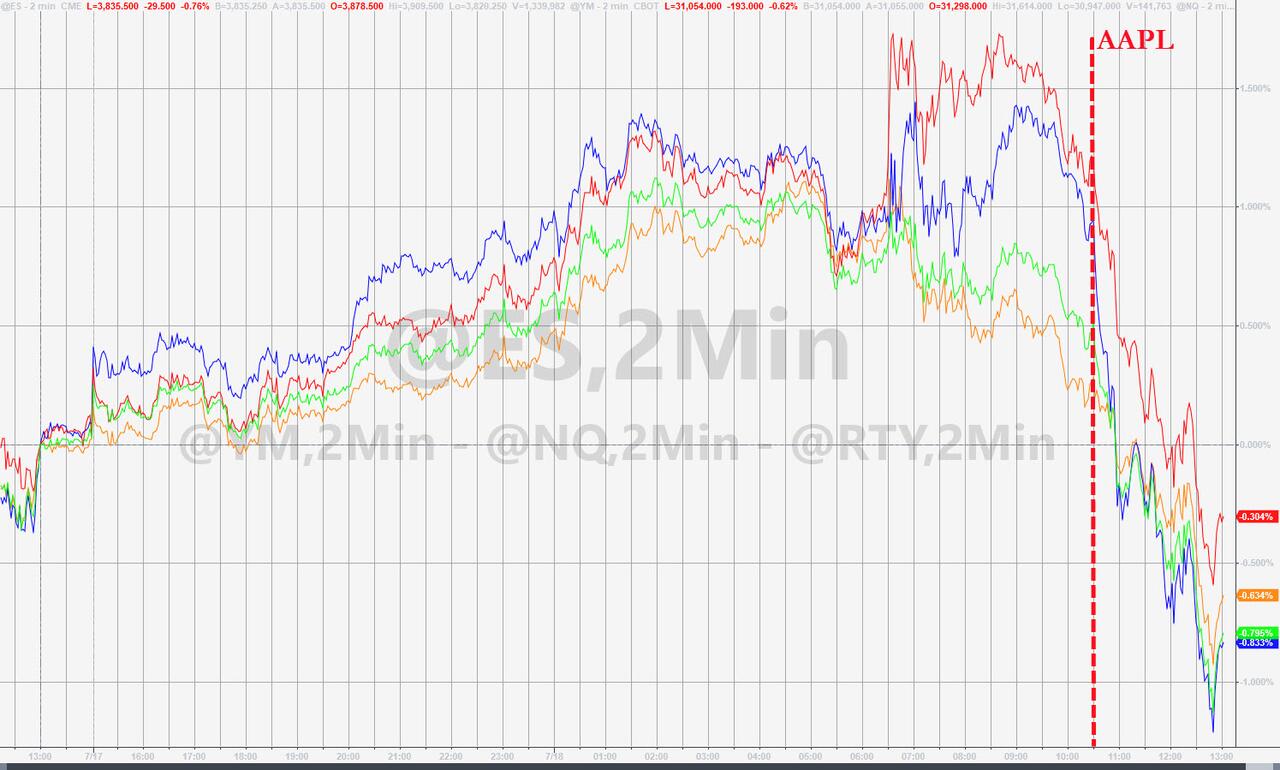
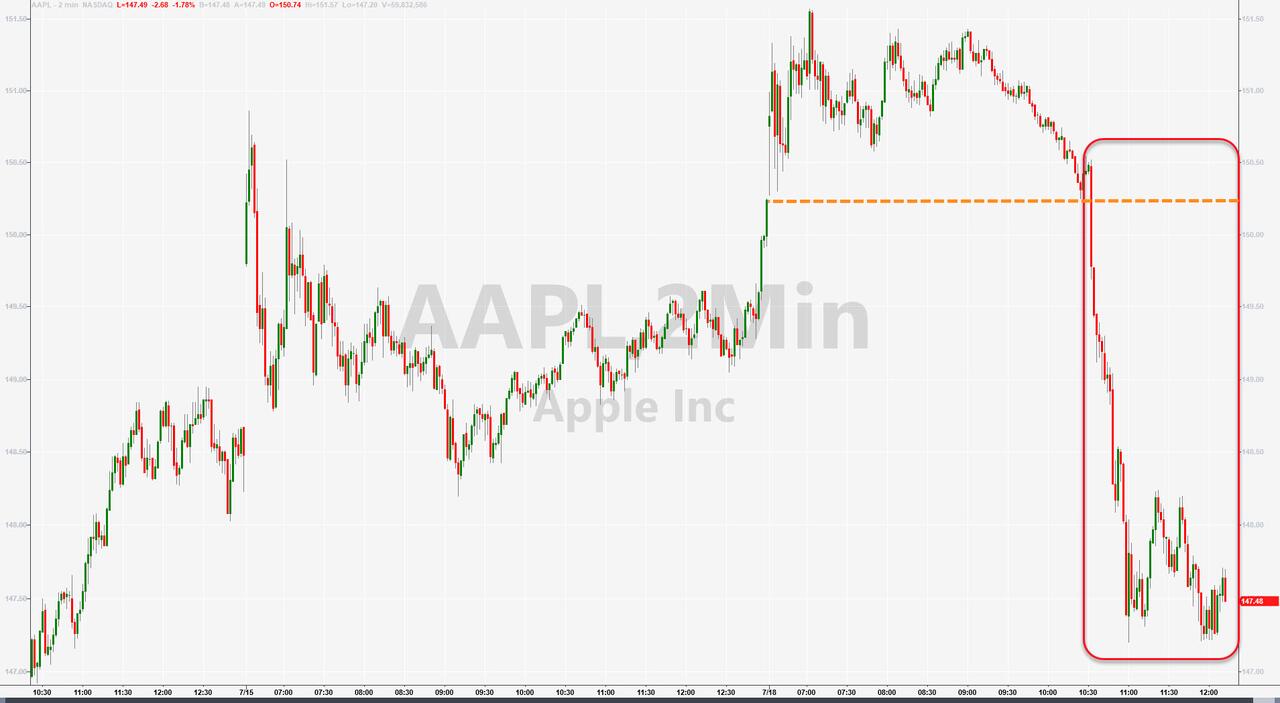
Contributing to that sudden sour mood was a report from Apple that it plans to slow hiring and spending on growth next year to better deal with a possible economic downturn. That took the starch out of the rally with the Dow not only giving up an almost 400-point gain but sinking into the red.
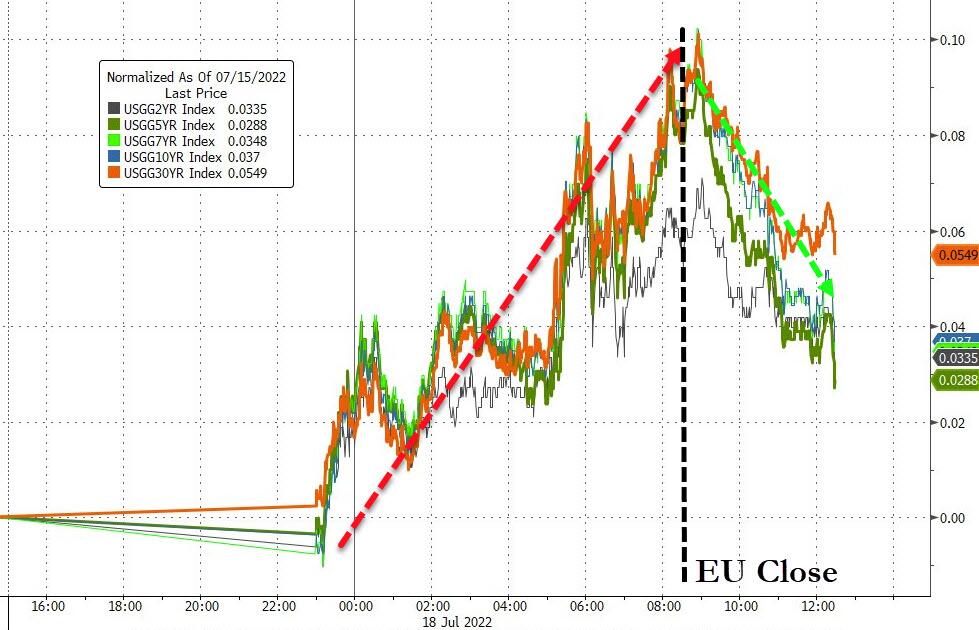
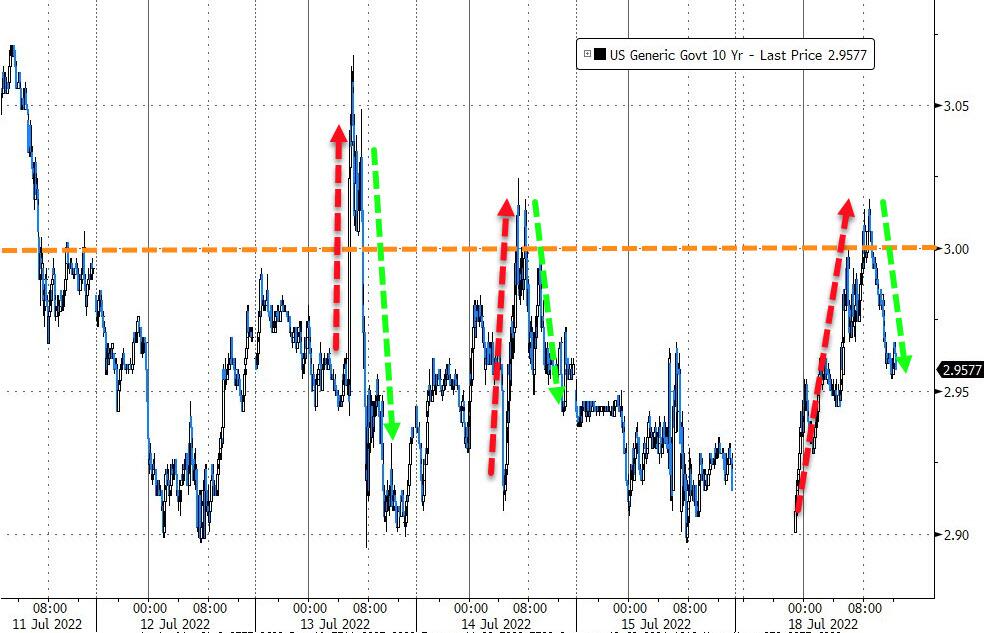
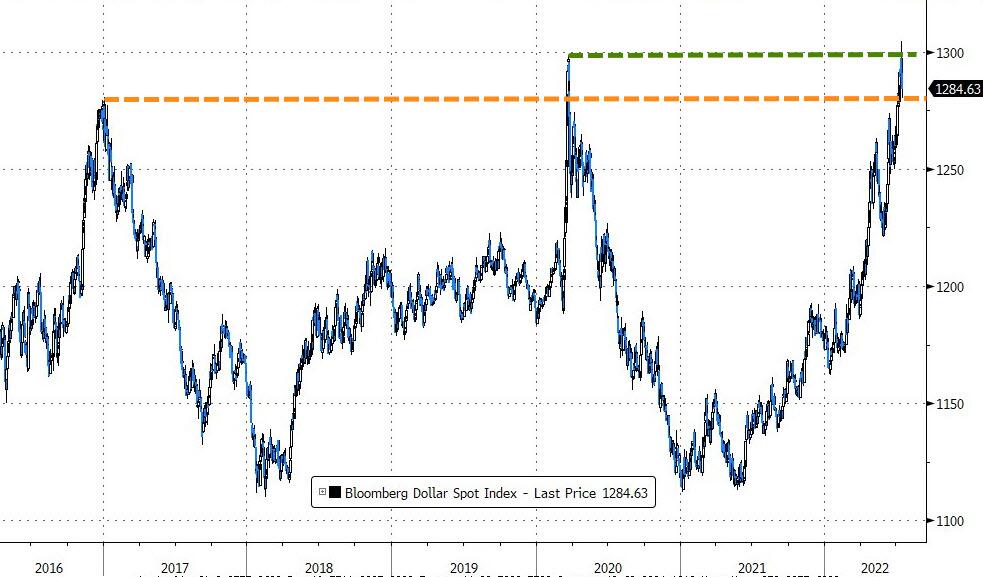
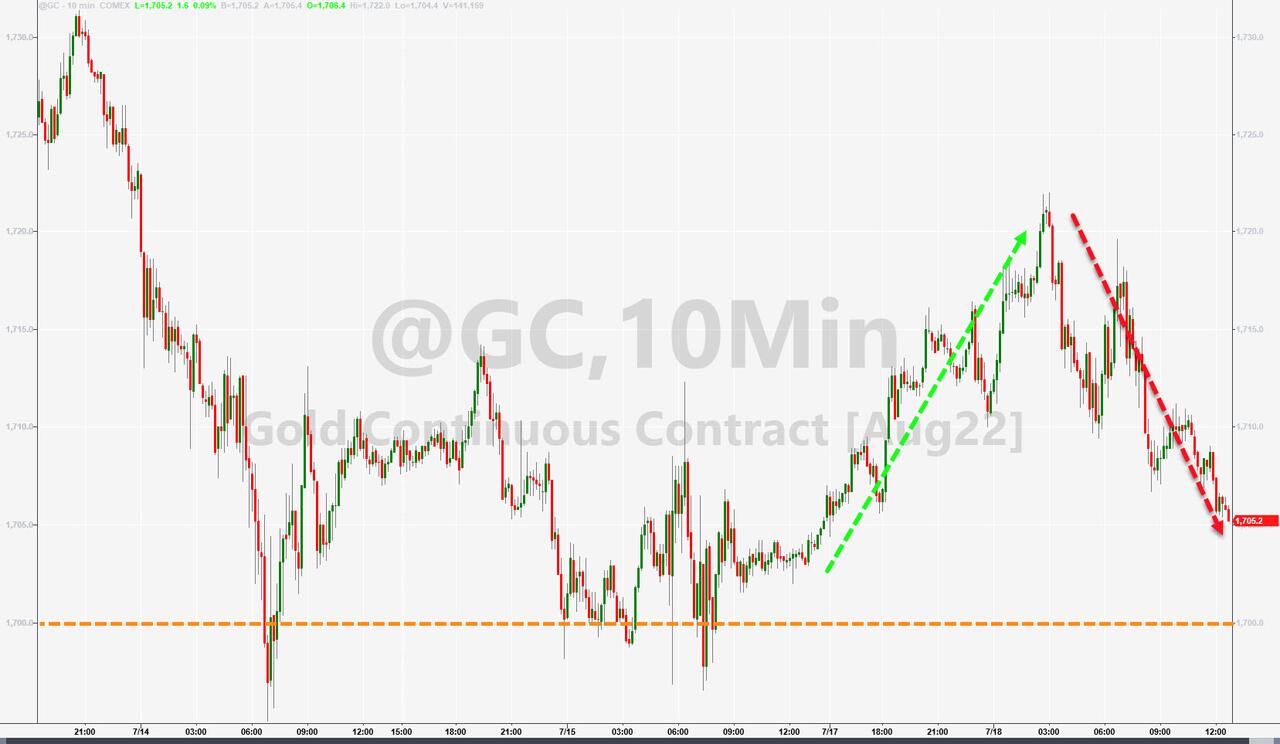
Bond yields rose, but the 10-year failed to climb back above its 3% level. The US Dollar touched its March 2020 highs but retreated and closed lower. Gold ripped and dipped and ended up a tad in the green.
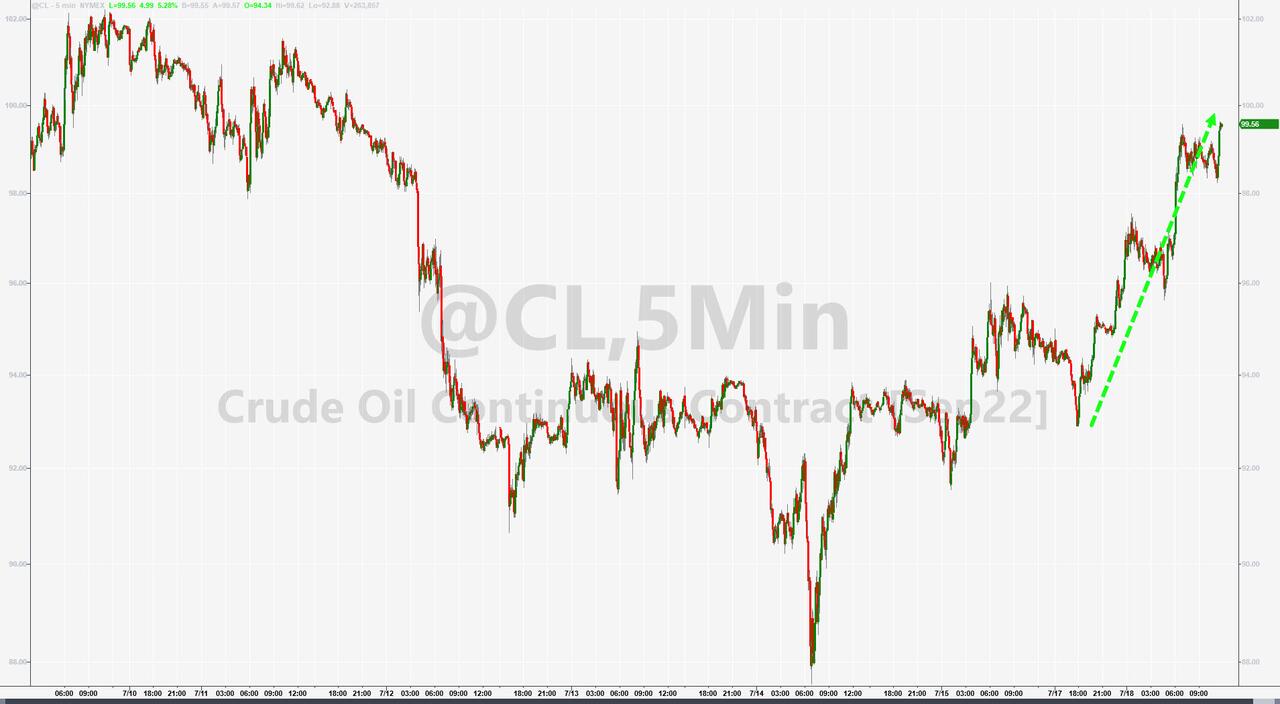
Crude oil prices surged back over $100, despite the current administration’s attempt to persuade the Saudis to produce more oil which, based on today’s response, did not work out too well.
Earnings season will now accelerate, and surprises, up and down, are pretty much guaranteed with future market direction being depended on the headline of the day.
2. ETFs in the Spotlight
In case you missed the announcement and description of this section, you can read it here again.
It features some of the 10 broadly diversified domestic and sector ETFs from my HighVolume list as posted every Saturday. Furthermore, they are screened for the lowest MaxDD% number meaning they have been showing better resistance to temporary sell offs than all others over the past year.
The below table simply demonstrates the magnitude with which these ETFs are fluctuating above or below their respective individual trend lines (%+/-M/A). A break below, represented by a negative number, shows weakness, while a break above, represented by a positive percentage, shows strength.
For hundreds of ETF choices, be sure to reference Thursday’s StatSheet.
For this closed-out domestic “Buy” cycle (2/24/2022), here’s how some of our candidates have fared:
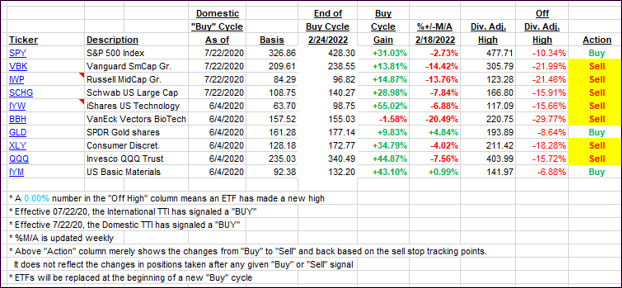
Click image to enlarge.
Again, the %+/-M/A column above shows the position of the various ETFs in relation to their respective long-term trend lines, while the trailing sell stops are being tracked in the “Off High” column. The “Action” column will signal a “Sell” once the -12% point has been taken out in the “Off High” column, which has replaced the prior -8% to -10% limits.
3. Trend Tracking Indexes (TTIs)
Our TTIs improved a tad despite the markets retreating.
This is how we closed 07/18/2022:
Domestic TTI: -10.45% below its M/A (prior close -12.02%)—Sell signal effective 02/24/2022.
International TTI: -12.62% below its M/A (prior close -14.81%)—Sell signal effective 03/08/2022.
Disclosure: I am obliged to inform you that I, as well as my advisory clients, own some of the ETFs listed in the above table. Furthermore, they do not represent a specific investment recommendation for you, they merely show which ETFs from the universe I track are falling within the specified guidelines.
All linked charts above are courtesy of Bloomberg via ZeroHedge.
Contact Ulli