
- Moving the markets
After experiencing bobbing, weaving and some head fakes, traders finally stepped up to the plate and put some money on the betting table that markets might have finally found a bottom.
Bullish sentiment received some support from strong earnings, which appeared to show that companies are adapting to economic challenges better than feared after the horrific 2nd quarter.
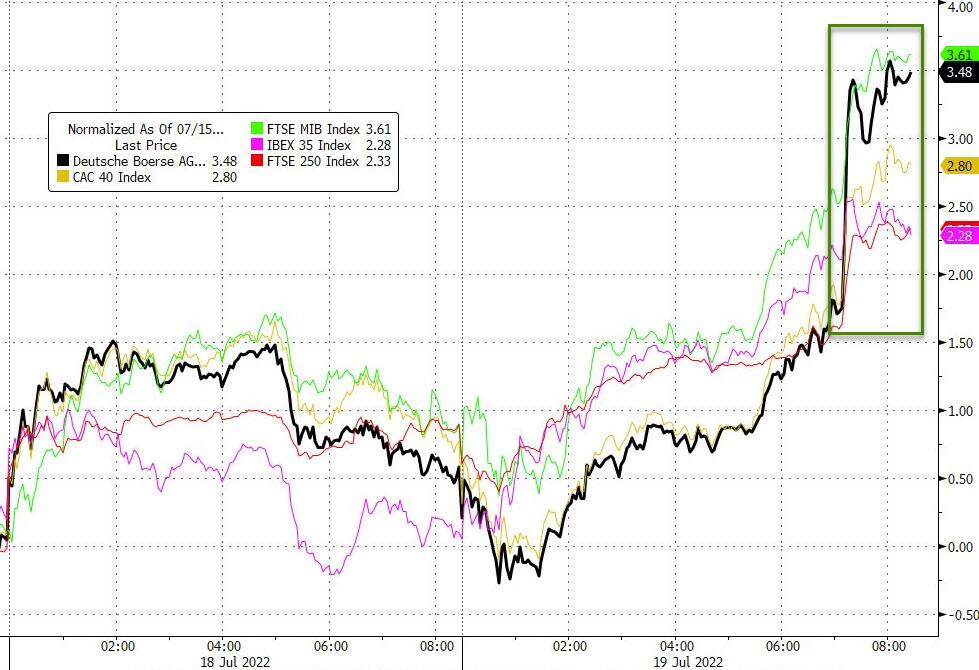
The charge was led by news out of Europe that the Russian gas flows via the Nord Stream 1 pipeline are seen starting on Thursday, after its scheduled maintenance, but at less than its capacity. That is the exact opposite of yesterday’s news report, which said that no gas flows were planned in the immediate future. We’ll see if today’s news was nothing but a rumor.
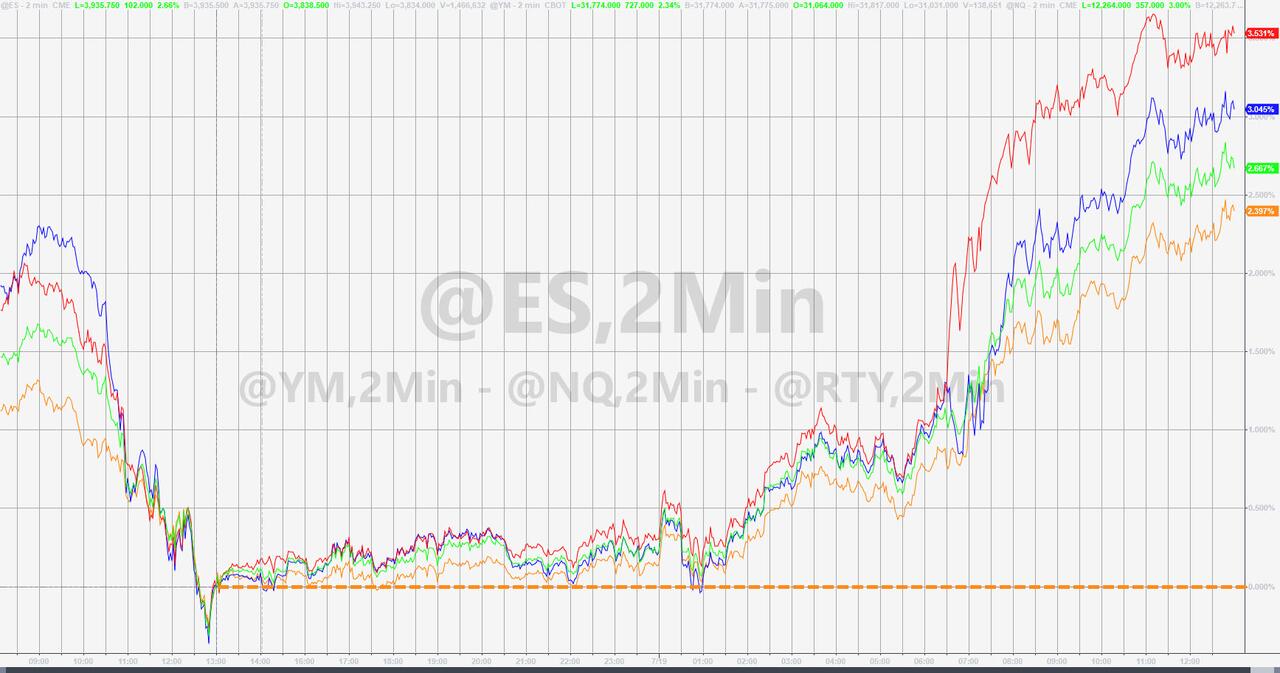
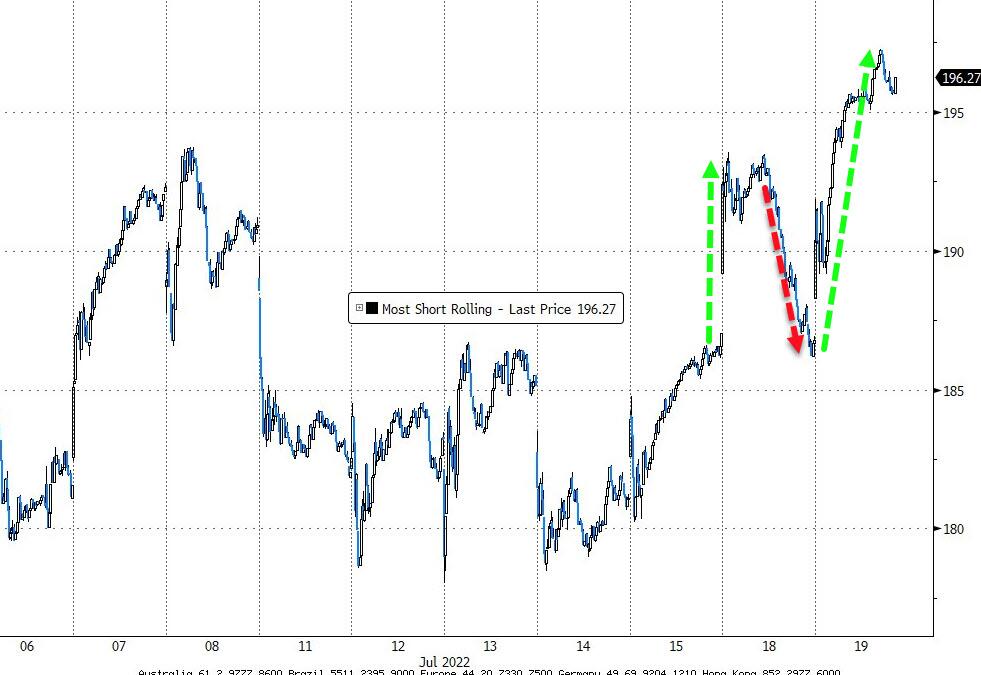
Be that as it may, the markets benefited, at least for the day, and the rally continued unrelenting for a change. Even ugly housing data, showing single-family home starts and permits crash, as ZH reported, did not put a dent in today’s market ramp, as another degree of support came from a gigantic short squeeze.
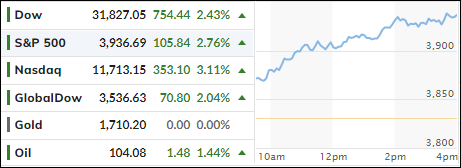
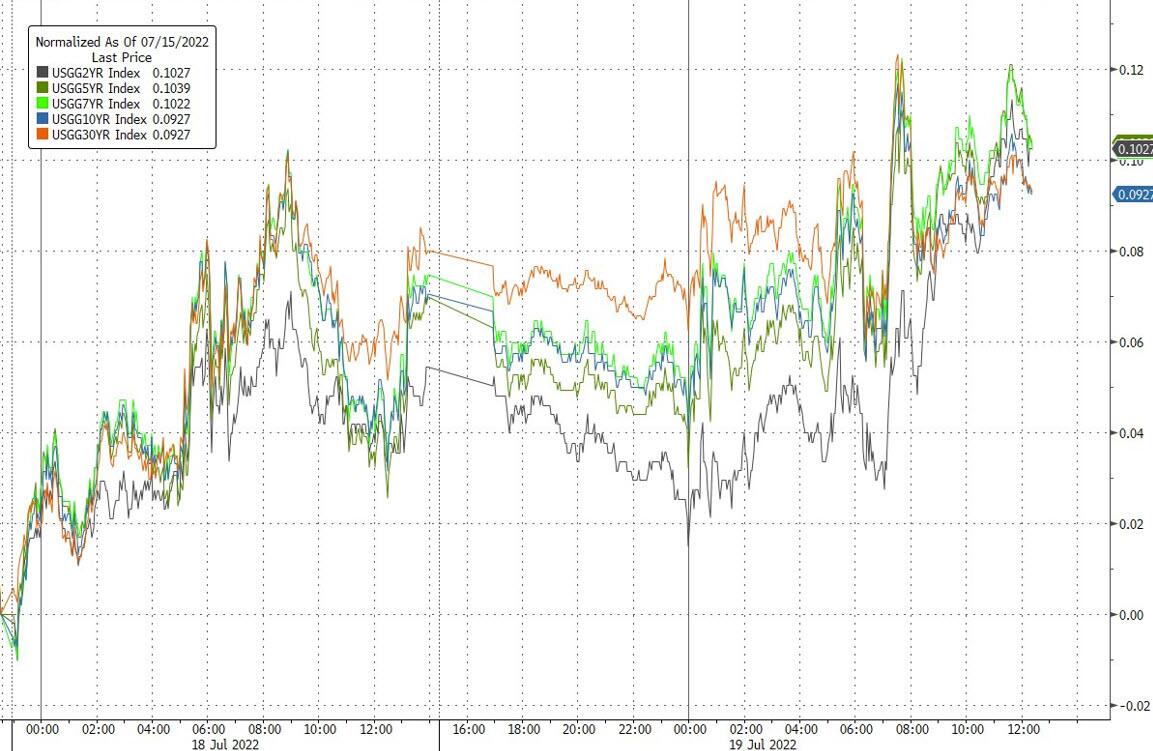
This Ramp-A-Thon knew no boundaries, as higher bond yields could not slow down the bullish effort either. And the 10-year conquering its 3% level and closing at 3.03% had no negative consequences on equities also.
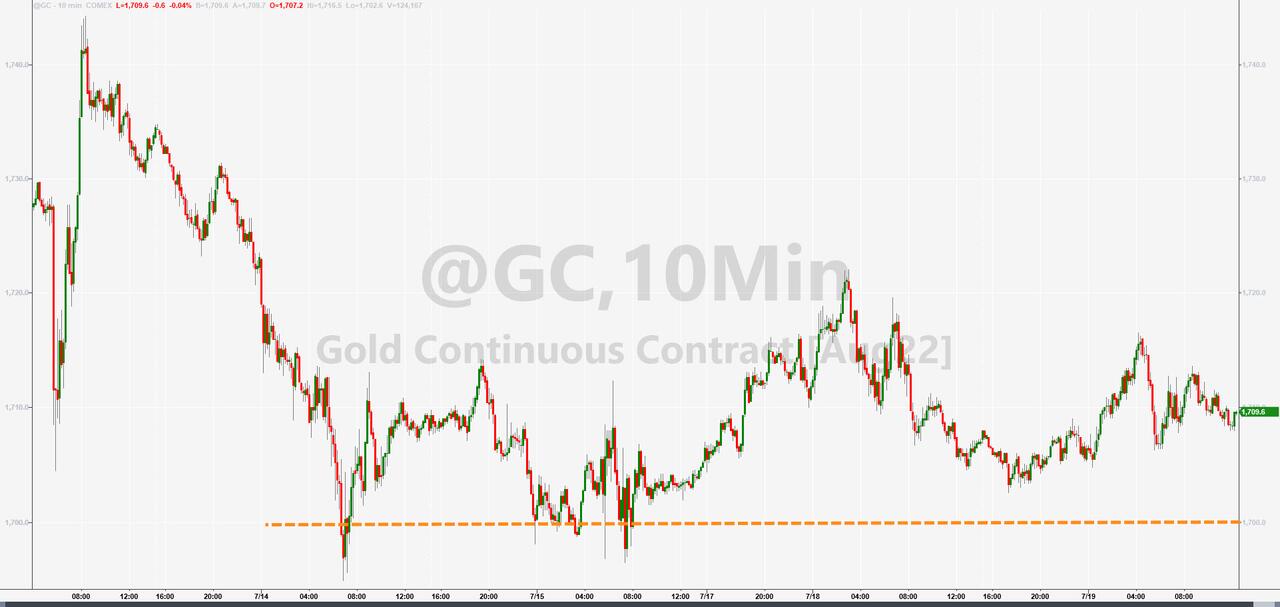
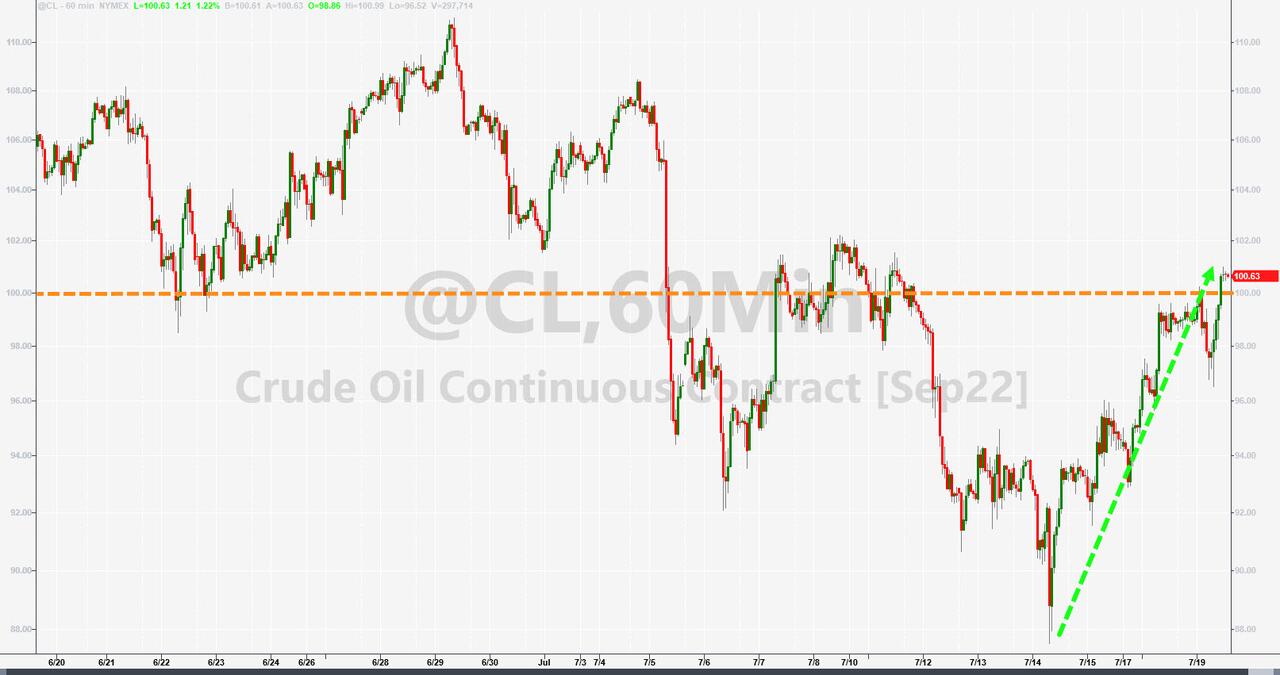
The US Dollar slumped for the 3rd day in a row and closed at two-week lows, while gold ended the session slightly higher, and Crude Oil recaptured its $100 level.
I think we’ll find out within the next couple of weeks, if we have a resumption of the bull market or of this was simply another dead-cat-bounce in an ongoing bear market.
2. ETFs in the Spotlight
In case you missed the announcement and description of this section, you can read it here again.
It features some of the 10 broadly diversified domestic and sector ETFs from my HighVolume list as posted every Saturday. Furthermore, they are screened for the lowest MaxDD% number meaning they have been showing better resistance to temporary sell offs than all others over the past year.
The below table simply demonstrates the magnitude with which these ETFs are fluctuating above or below their respective individual trend lines (%+/-M/A). A break below, represented by a negative number, shows weakness, while a break above, represented by a positive percentage, shows strength.
For hundreds of ETF choices, be sure to reference Thursday’s StatSheet.
For this closed-out domestic “Buy” cycle (2/24/2022), here’s how some of our candidates have fared. Keep in mind that our Domestic Trend Tracking Index (TTI) signaled a “Sell” on that date, which overrode the existing “Buys” shown for SPY and IYM:
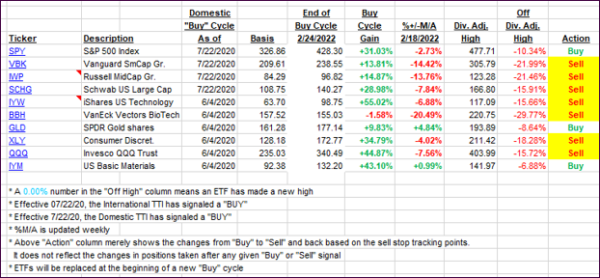
Click image to enlarge.
Again, the %+/-M/A column above shows the position of the various ETFs in relation to their respective long-term trend lines, while the trailing sell stops are being tracked in the “Off High” column. The “Action” column will signal a “Sell” once the -12% point has been taken out in the “Off High” column, which has replaced the prior -8% to -10% limits.
3. Trend Tracking Indexes (TTIs)
Our TTIs made great progress, as an early rally was sustained throughout the session.
This is how we closed 07/19/2022:
Domestic TTI: -7.88% below its M/A (prior close -10.45%)—Sell signal effective 02/24/2022.
International TTI: -10.66% below its M/A (prior close -12.62%)—Sell signal effective 03/08/2022.
Disclosure: I am obliged to inform you that I, as well as my advisory clients, own some of the ETFs listed in the above table. Furthermore, they do not represent a specific investment recommendation for you, they merely show which ETFs from the universe I track are falling within the specified guidelines.
All linked charts above are courtesy of Bloomberg via ZeroHedge.
Contact Ulli