Walmart Cuts Forecast—Punishes Stocks

Ulli Market Commentary Contact

[Chart courtesy of MarketWatch.com]

  1. Moving the markets

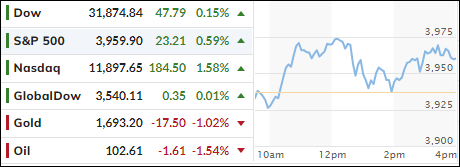
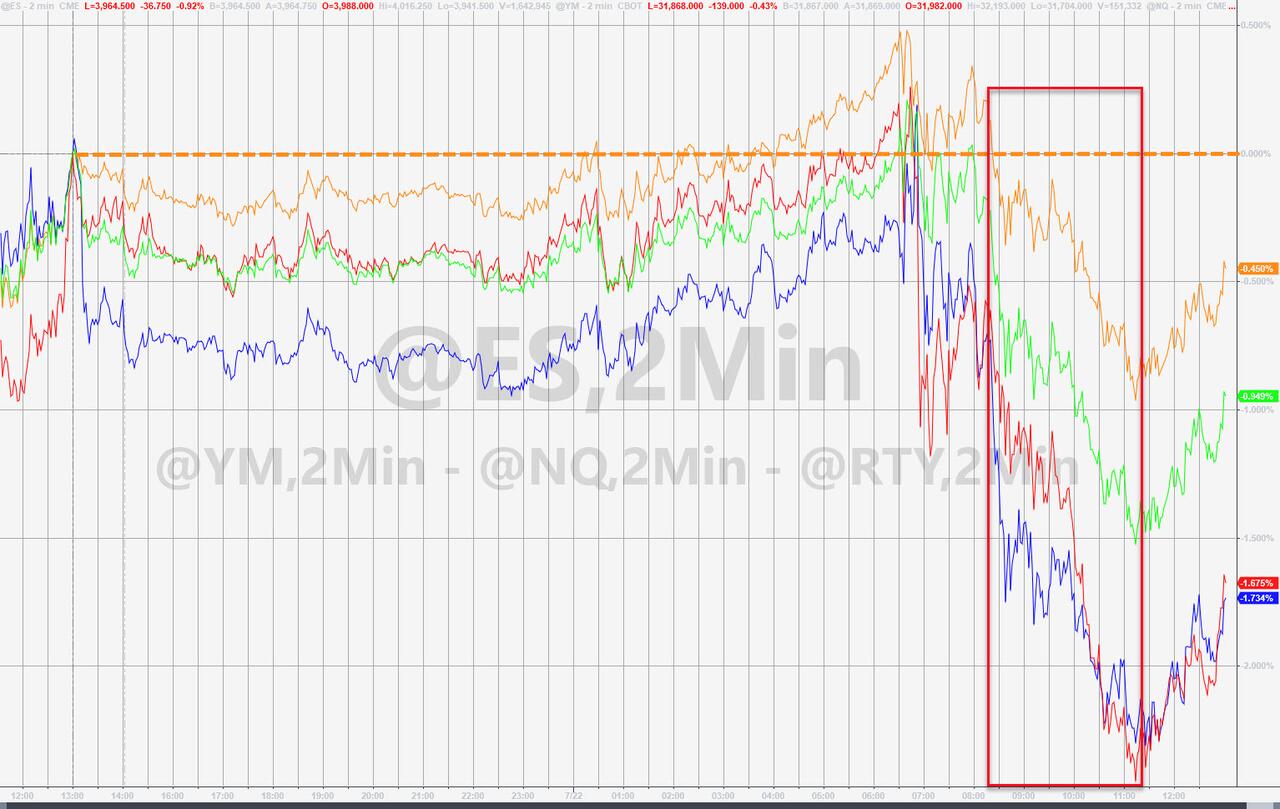
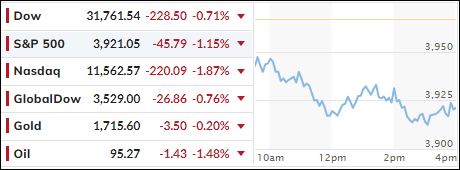
After the close yesterday, Walmart came out and cut its earnings forecast, which pulled all retailers lower in the afterhours trading session, as fears mounted that consumer spending, or rather the lack thereof, will now not be the driver to keep the U.S. out of a recession.

That sour mood carried into today’s red opening and worsened as the day went on with the major indexes closing broadly lower. The effect was that earnings expectations have been tempered with comments being of a cautionary nature, as the true effect of inflation has still to be recognized on a corporate level.

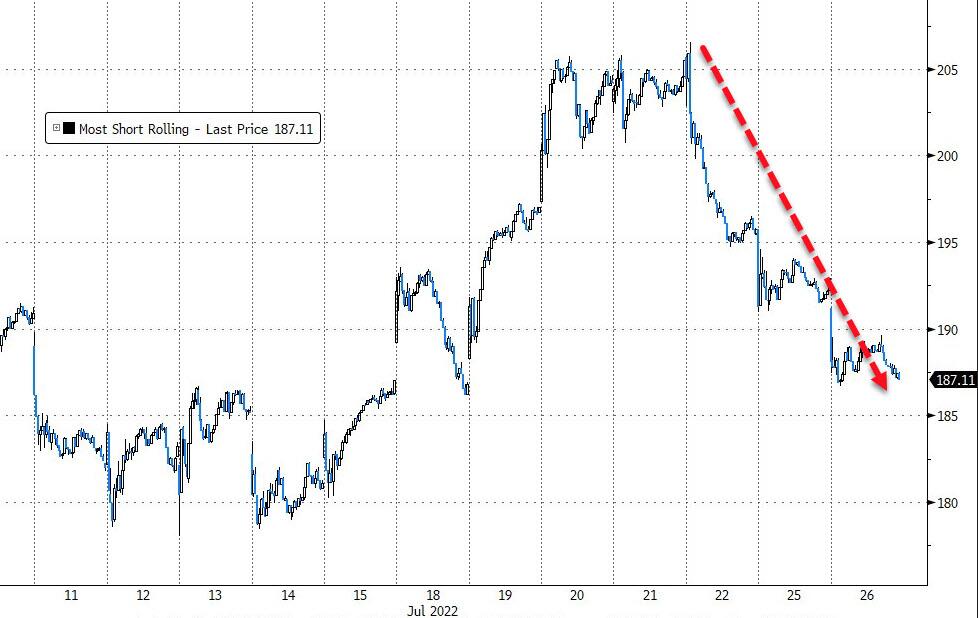
Markets received no directional help, because the always reliable short squeeze was conspicuously absent, as plunging New Home Sales, sagging of homebuilder confidence and record low affordability made their presence felt.   

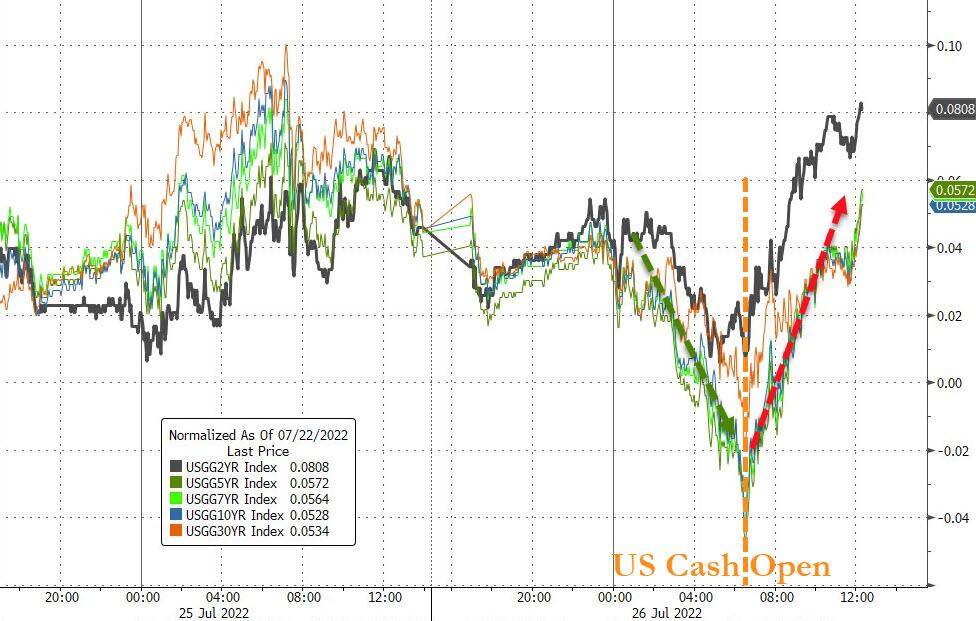
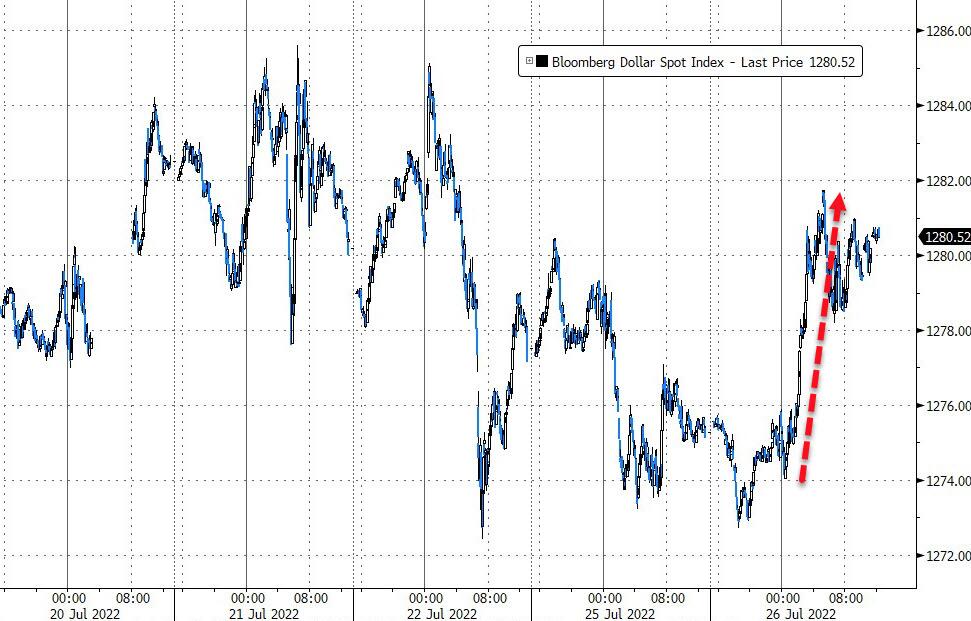
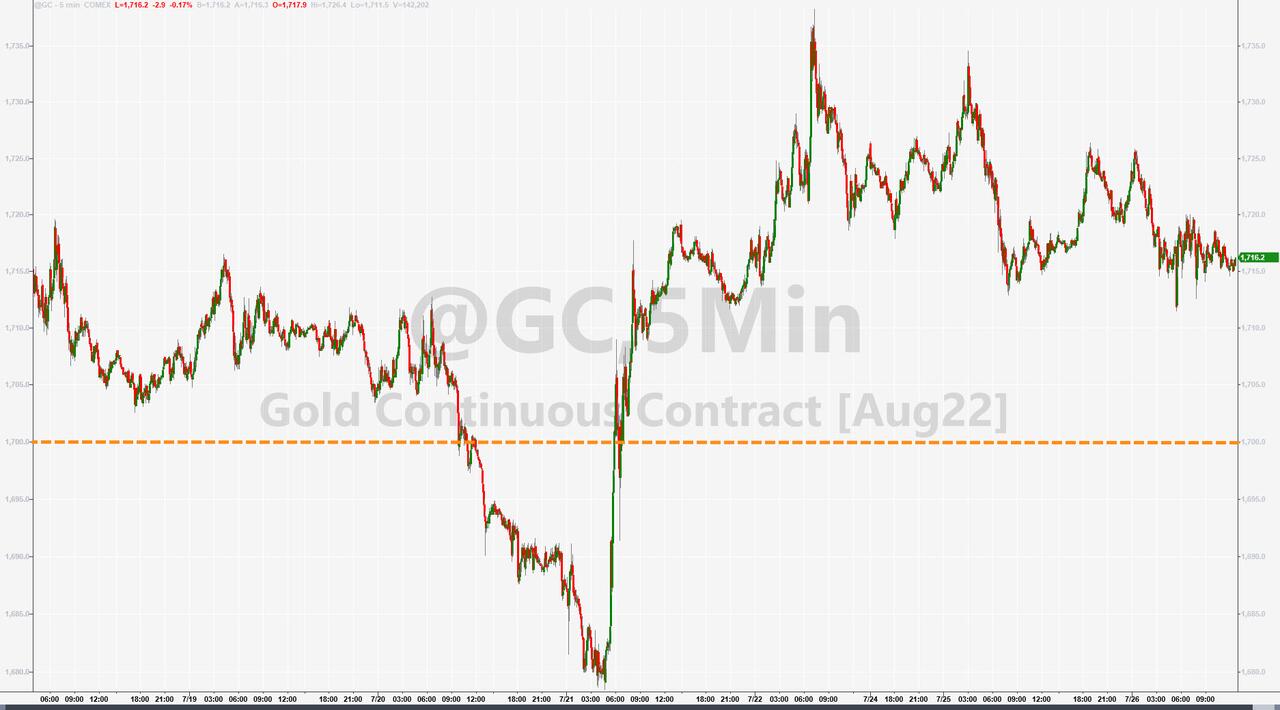
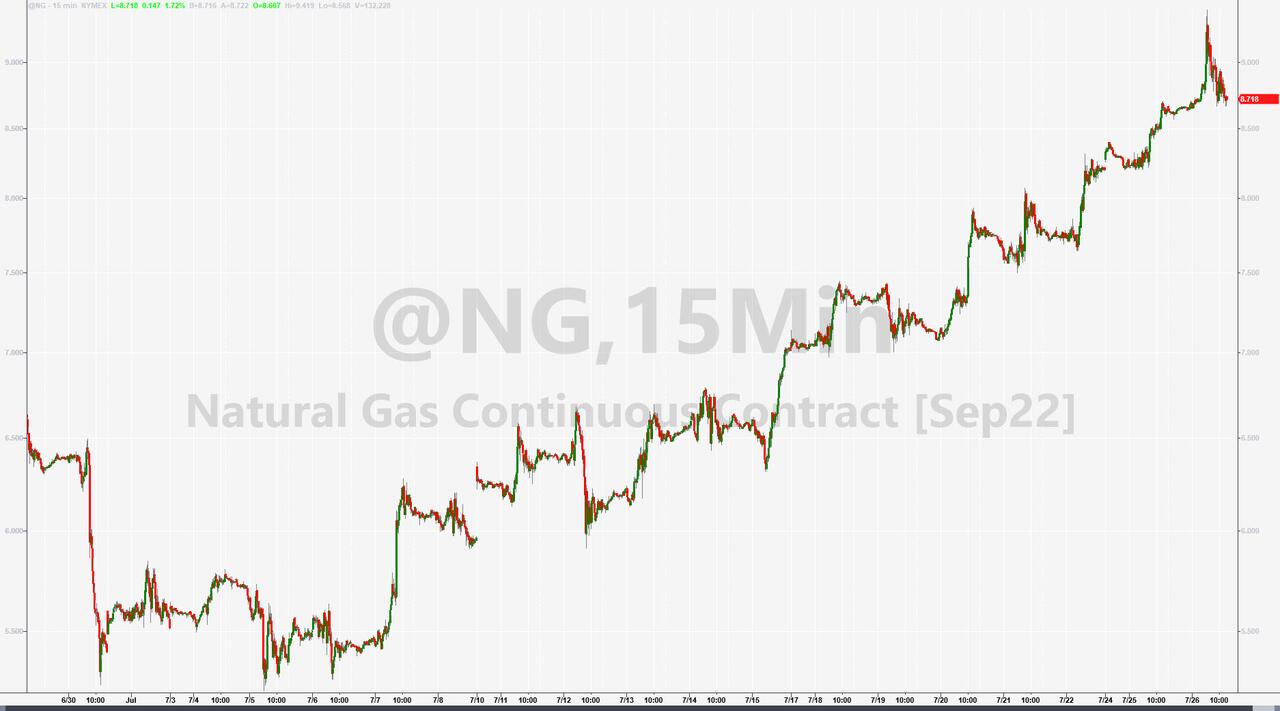
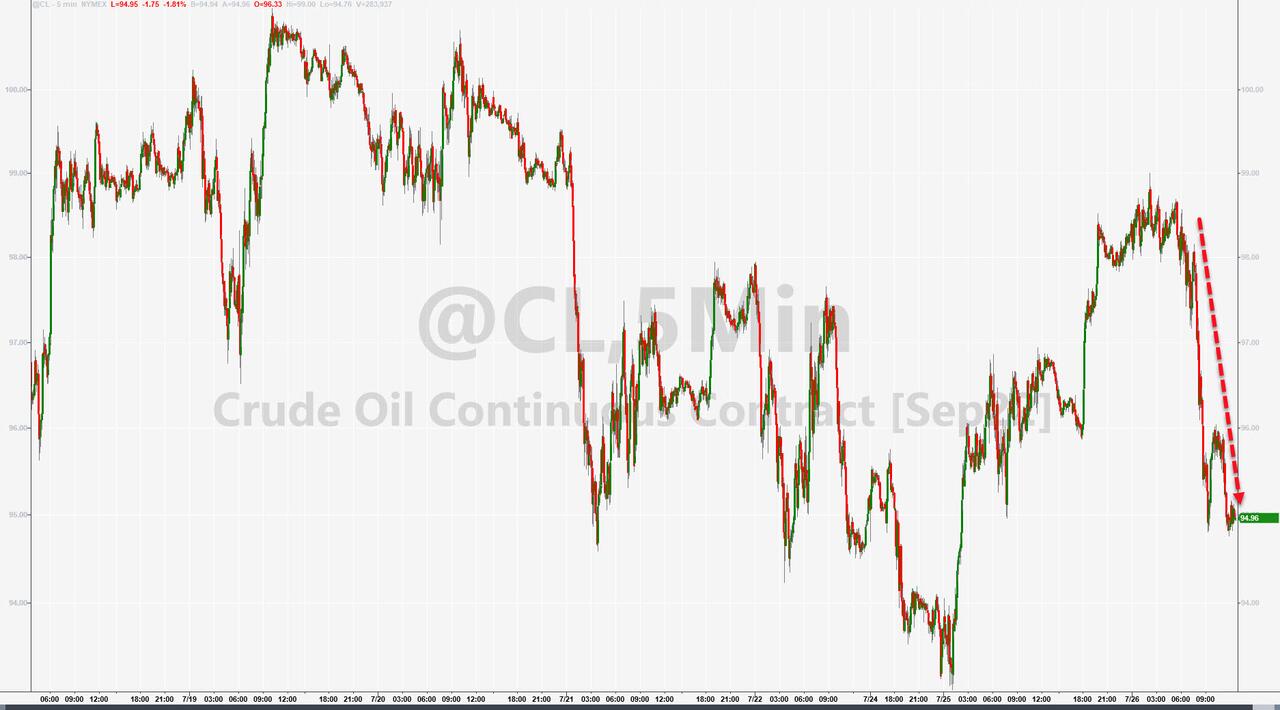
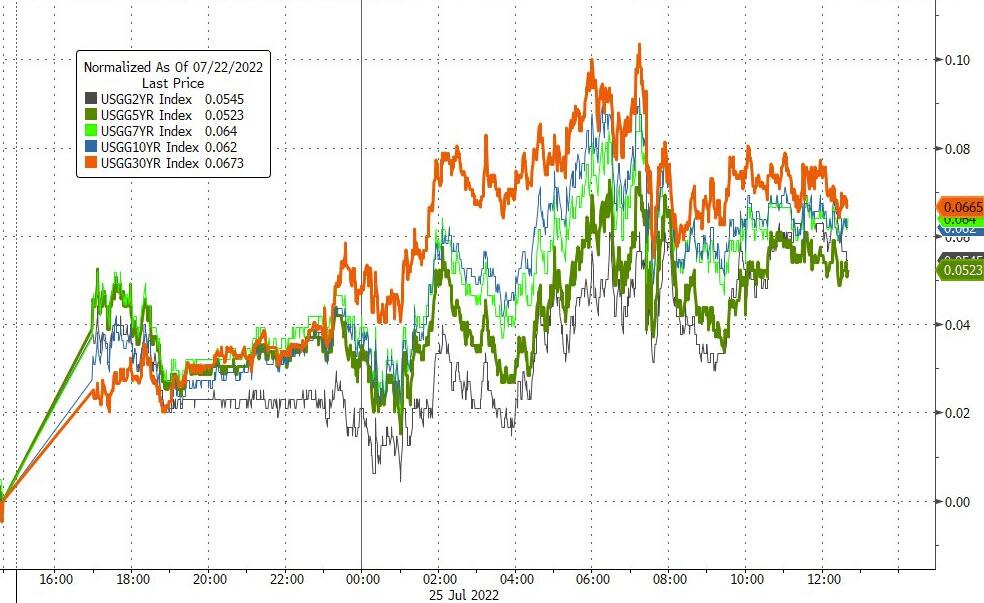
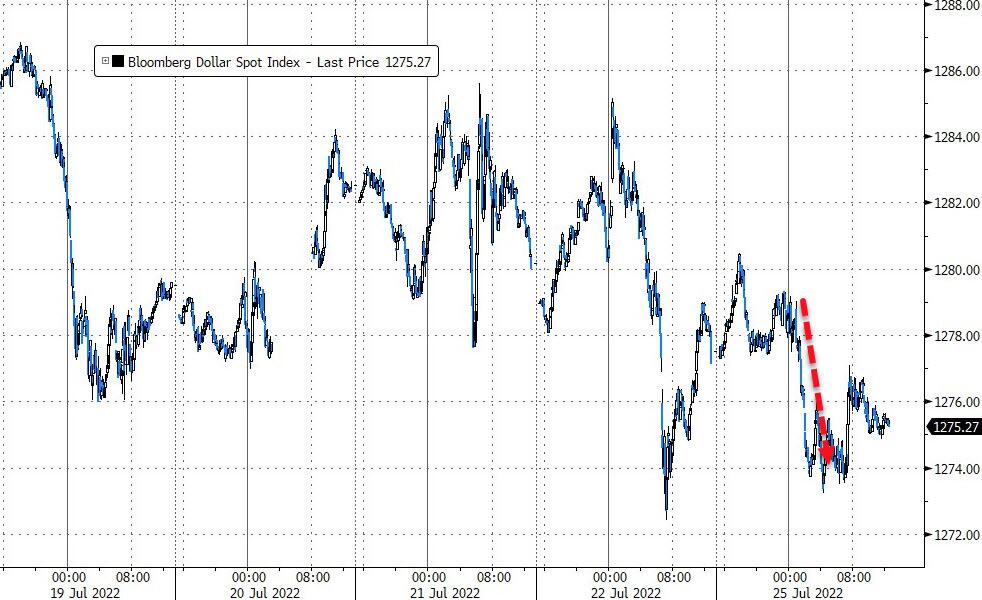
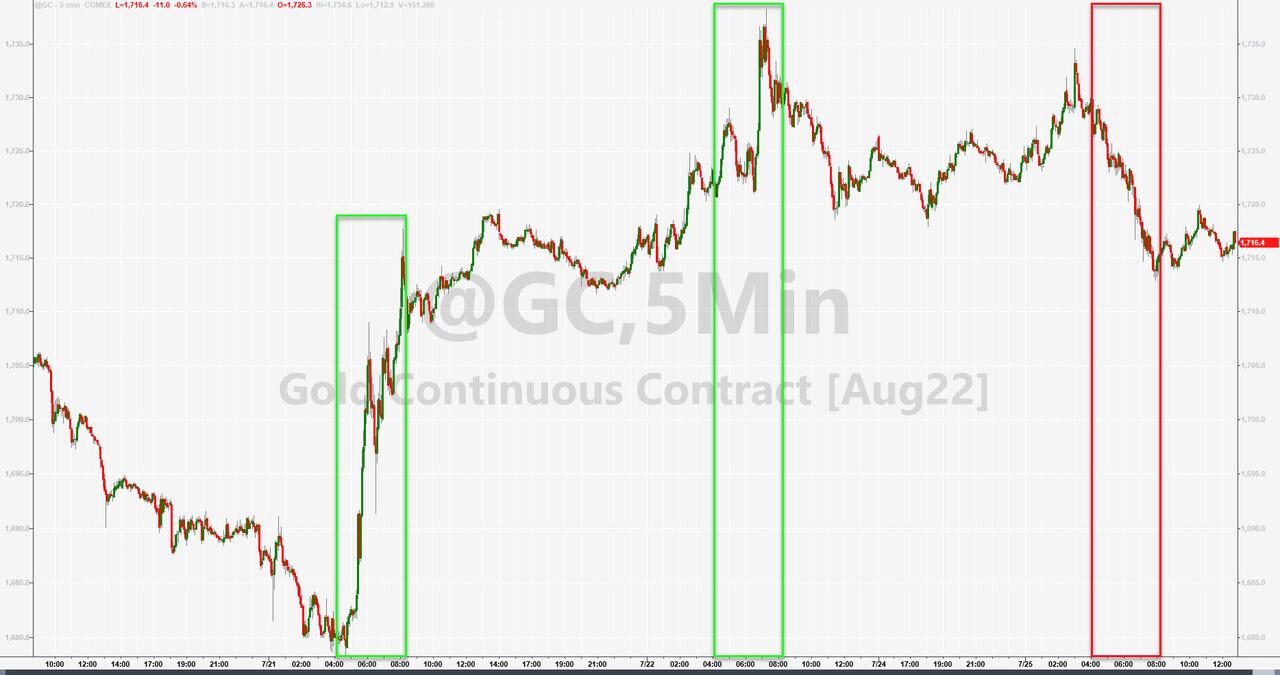
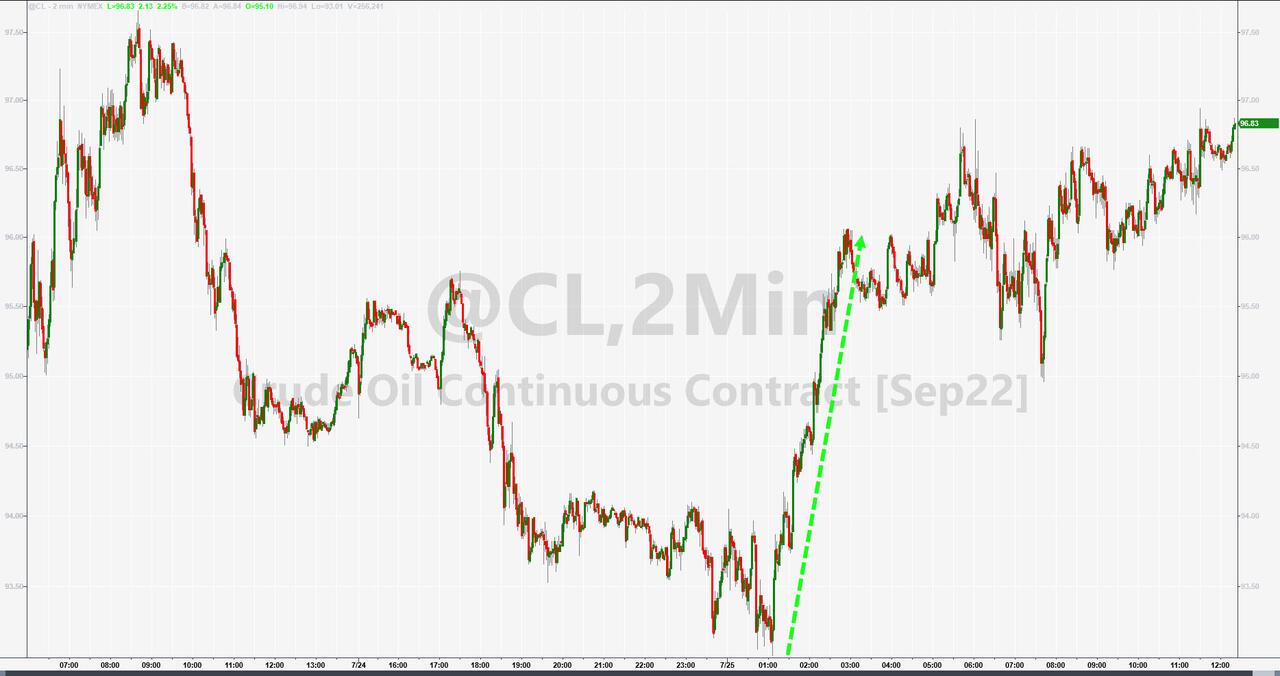
Bond yields rose moderately, the US Dollar bounced, while gold slipped a tad but held on to its $1,700 level. Natural Gas surged to 14-year highs, but Crude Oil slipped back towards the $95 level.   

As I am writing this afterhours, Microsoft just released its quarterly report card, which showed top- and bottom-line misses. The stock is currently down some 5%, which may not bode well for Wednesday’s opening.  

Tomorrow, however, the Fed’s announcement on interest rates will determine market direction.

Read More
Treading Water

Ulli Market Commentary Contact

[Chart courtesy of MarketWatch.com]

  1. Moving the markets

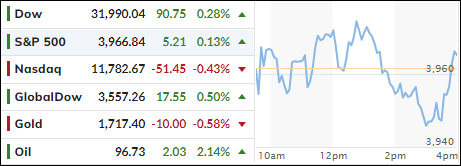
The major indexes fluttered throughout the session with no clear direction, because traders prepared themselves for the big events later this week. The next 4 trading days will be the busiest, as about one third of the S&P 500 members are scheduled to release their earnings reports.

The Fed will be on deck Wednesday with the world watching its decision on interest rates, or more specifically whether they will hike 75 or 100 bps. As important will be their outlook as to whether a moderate tone towards future hikes will prevail.

To top it off, Thursday’s GDP report will likely show a second consecutive quarter of declines, which means we will have officially entered recession territory, no matter how much the current administration is trying to move the goalposts via a new definition of what a recession is. For clarity, ZeroHedge posted this tongue in cheek comparison.

Bond yields rose moderately, but the 10-year remained below its psychologically important 3% level. The US Dollar dipped, as did gold, but Crude Oil bucked the trend, edged higher yet stayed below its $100 threshold.   

It promises to be a weak where anything is possible in terms of market direction.

Read More

ETFs On The Cutline – Updated Through 07/22/2022

Ulli ETFs on the Cutline Contact

Below, please find the latest High-Volume ETF Cutline report, which shows how far above or below their respective long-term trend lines (39-week SMA) my currently tracked ETFs are positioned.

This report covers the HV ETF Master List from Thursday’s StatSheet and includes 312 High Volume ETFs, defined as those with an average daily volume of more than $5 million, of which currently 23 (last week 17) are hovering in bullish territory. The yellow line separates those ETFs that are positioned above their trend line (%M/A) from those that have dropped below it.

Take a look:                                                                   

The HV ETF Master Cutline Report

In case you are not familiar with some of the terminology used in the reports, please read the Glossary of Terms. If you missed the original post about the Cutline approach, you can read it here.      

ETF Tracker Newsletter For July 22, 2022

Ulli ETF Tracker Contact

ETF Tracker StatSheet          

You can view the latest version here.

SLOPPY AND CHOPPY BUT HIGHER ON THE WEEK

[Chart courtesy of MarketWatch.com]

  1. Moving the markets

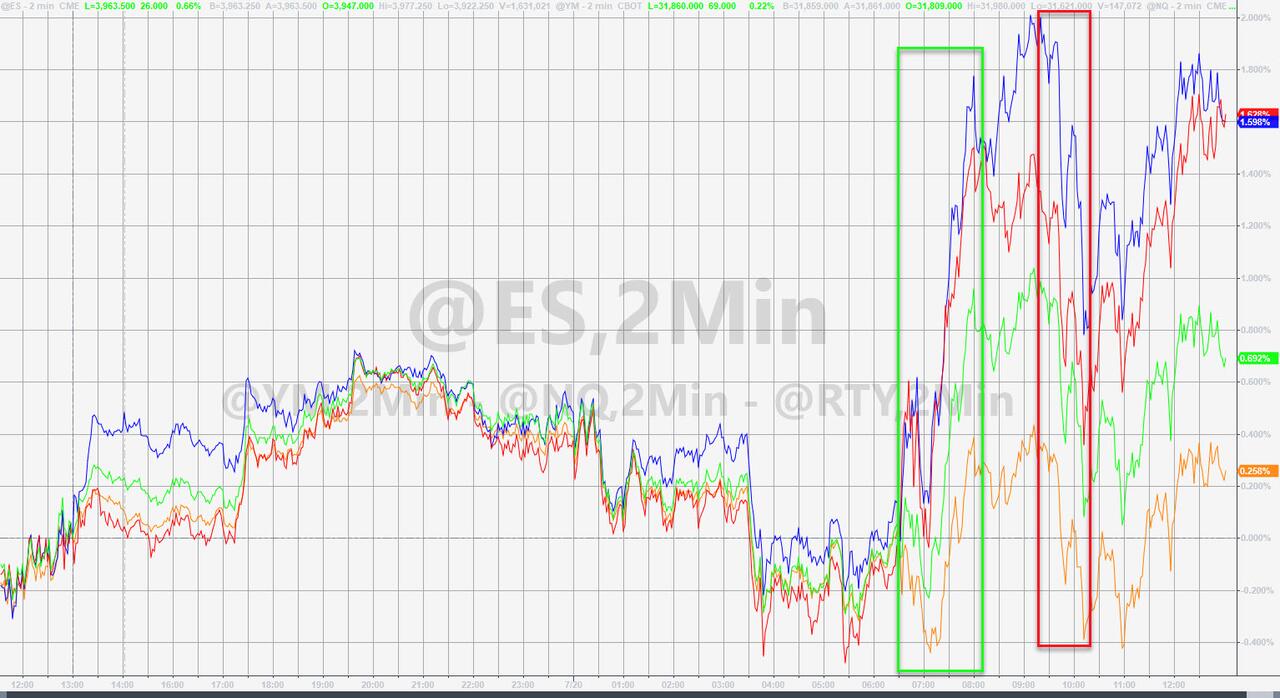
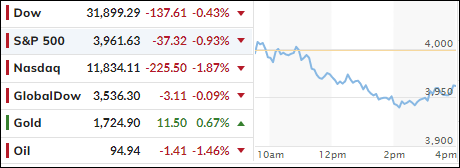
Despite a choppy and sloppy trading session, which caused the major indexes to surrender some of their recent hard-fought gains, they ended the week in the plus with the S&P 500 advancing around 2.2%.

Volatility reigned supreme, as poor quarterly results from social media darling SnapChat cut the advances of the Nasdaq short. We can expect more roller coaster rides with upside earnings surprises supporting the bullish theme, while disappointments will put the bears back in charge.

Not helping matters were a slew of analyst downgrades, which predominantly affected the tech space. Verizon was the worst performer in the Dow and dropped more than 7% due cutting its full-year forecast.

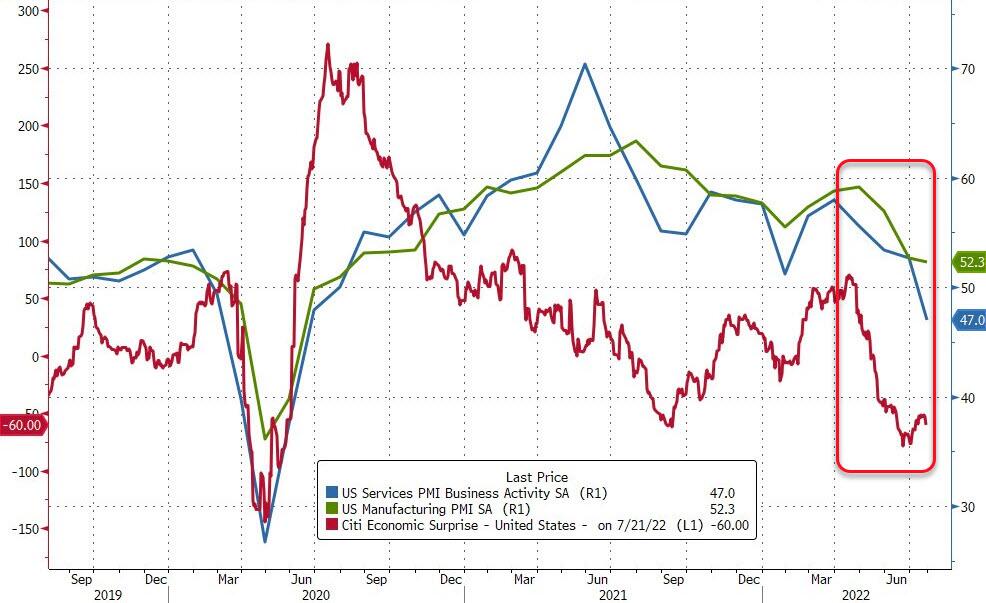
Poor economic data did not improve sentiment, because the PMI index, which measures US Service and Manufacturing, crashed into contraction mode, while the Citi Economic Surprise index continued on its southerly path. As ZH put it, we are seeing “a worrying deterioration in the economy.”

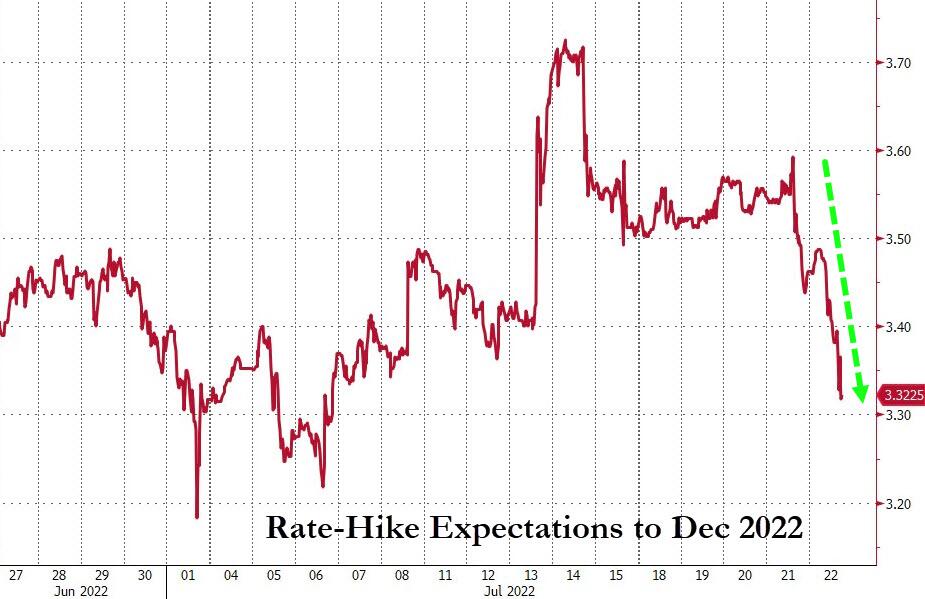
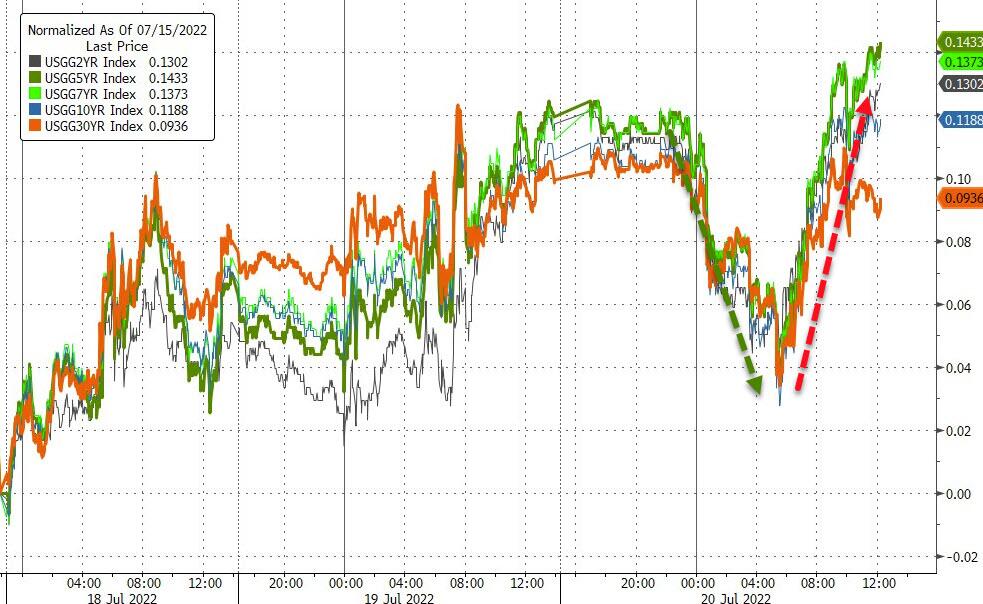
This sent market expectations for rate-hikes down dramatically for the week, with the odds of a 100bps hike next week having dropped to only 9%, as per Zero Hedge. Subsequently, bond yields dropped sharply with the 10-year losing 12 bps to close the day at 2.76%.

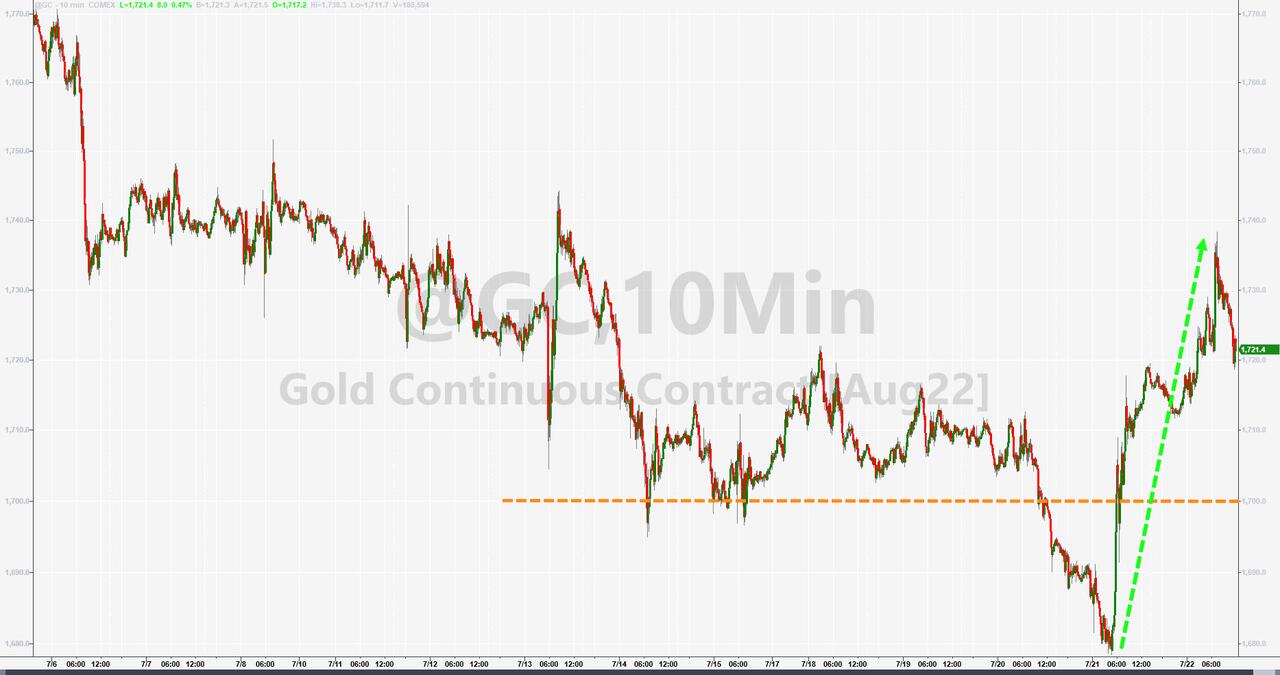
As yields sank, so did the US Dollar, the short squeeze simply faded into oblivion and Gold finally recaptured its $1,700 level but lost for the week.   

As we’ve seen, market direction can change on a dime depending on the latest headline news, which means we will need to see much more consistent upward momentum, until our Trend Tracking Indexes (section 3) will give the go ahead to move back into equities.  

Read More

Weekly StatSheet For The ETF Tracker Newsletter – Updated Through 07/21/2022

Ulli ETF StatSheet Contact

ETF Data updated through Thursday, July 21, 2022

Methodology/Use of this StatSheet:

1. From the universe of over 1,800 ETFs, I have selected only those with a trading volume of over $5 million per day (HV ETFs), so that liquidity and a small bid/ask spread are assured.

2. Trend Tracking Indexes (TTIs)

Buy or Sell decisions for Domestic and International ETFs (section 1 and 2), are made based on the respective TTI and its position either above or below its long-term M/A (Moving Average). A crossing of the trend line from below accompanied by some staying power above constitutes a “Buy” signal. Conversely, a clear break below the line constitutes a “Sell” signal. Additionally, I use an 12% trailing stop loss on all positions in these categories to control downside risk.

3. All other investment arenas do not have a TTI and should be traded based on the position of the individual ETF relative to its own respective trend line (%M/A). That’s why those signals are referred to as a “Selective Buy.” In other words, if an ETF crosses its own trendline to the upside, a “Buy” signal is generated. Here too, I recommend trailing sell stop of 12%, or less, depending on your risk tolerance.

If you are unfamiliar with some of the terminology, please see Glossary of Terms and new subscriber information in section 9.     

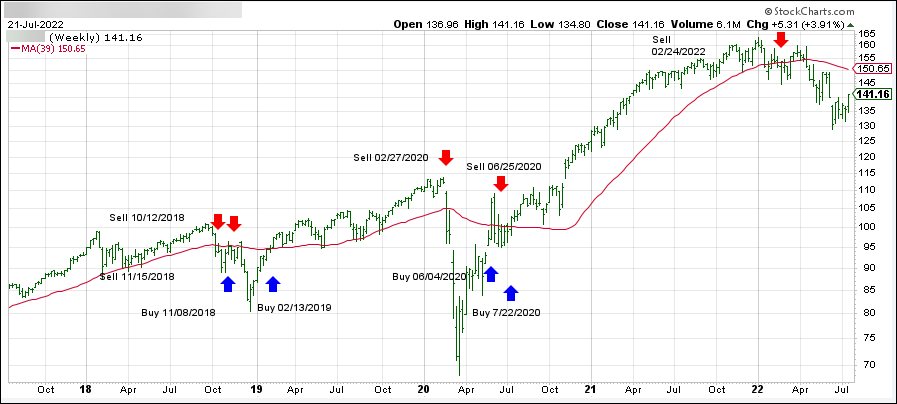
1. DOMESTIC EQUITY ETFs: SELL — since 02/24/2022

Click on chart to enlarge

Our main directional indicator, the Domestic Trend Tracking Index (TTI-green line in the above chart) has broken below its long-term trend line (red) by -6.54% and remains in “SELL” mode.  

Read More

Tech Dominates

Ulli Market Commentary Contact

[Chart courtesy of MarketWatch.com]

  1. Moving the markets

Despite and early sell-off, the major indexes found some footing, wobbled all day yet managed to produce another green close for the second straight day.

It was a tug-of-war between those traders who were scouring the latest corporate earnings for indications that profits remain on an upward trend, which would support higher stock prices in the future.

On the other hand, worries persist that market sentiment may be in limbo, until we get more clarity on a variety of high-profile issues, like the outlook for the economy, future Central Bank interest rate policy and the ever-present political battles with all its uncertainties.

Even ugly housing data and demand destruction in the energy sector, as ZH described it, were not able to put a damper on equities which, with the help of a short squeeze, although with less conviction than yesterday, managed to provide the impetus for keep the rally going.

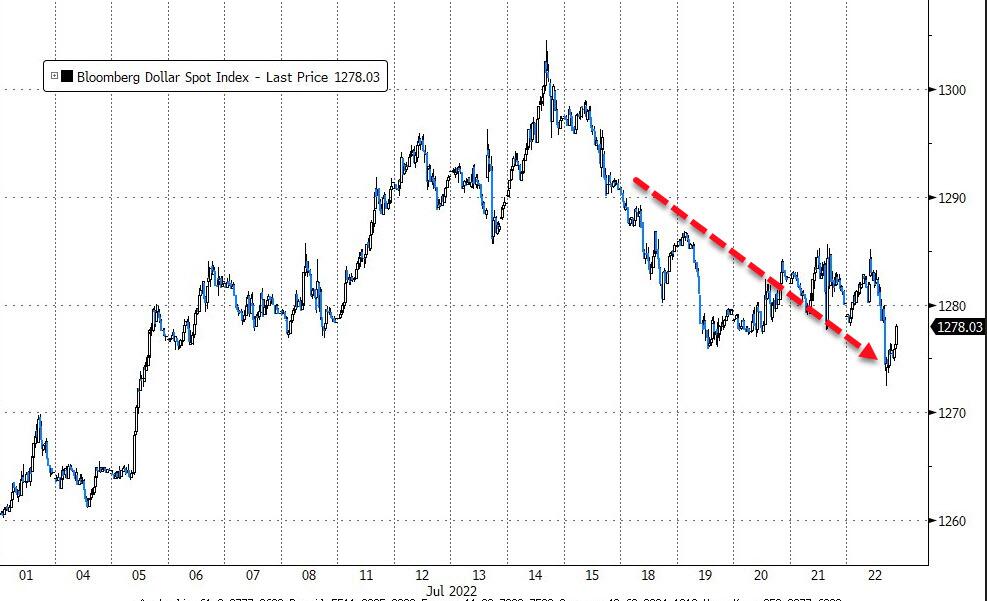
Bond yields inched up a tad and held the 10-year above its 3% level. Italy was in the limelight with their government collapsing, as their yields spiked to 3-week highs. The US Dollar rebounded a tad, after getting hammered over the past 7 days.

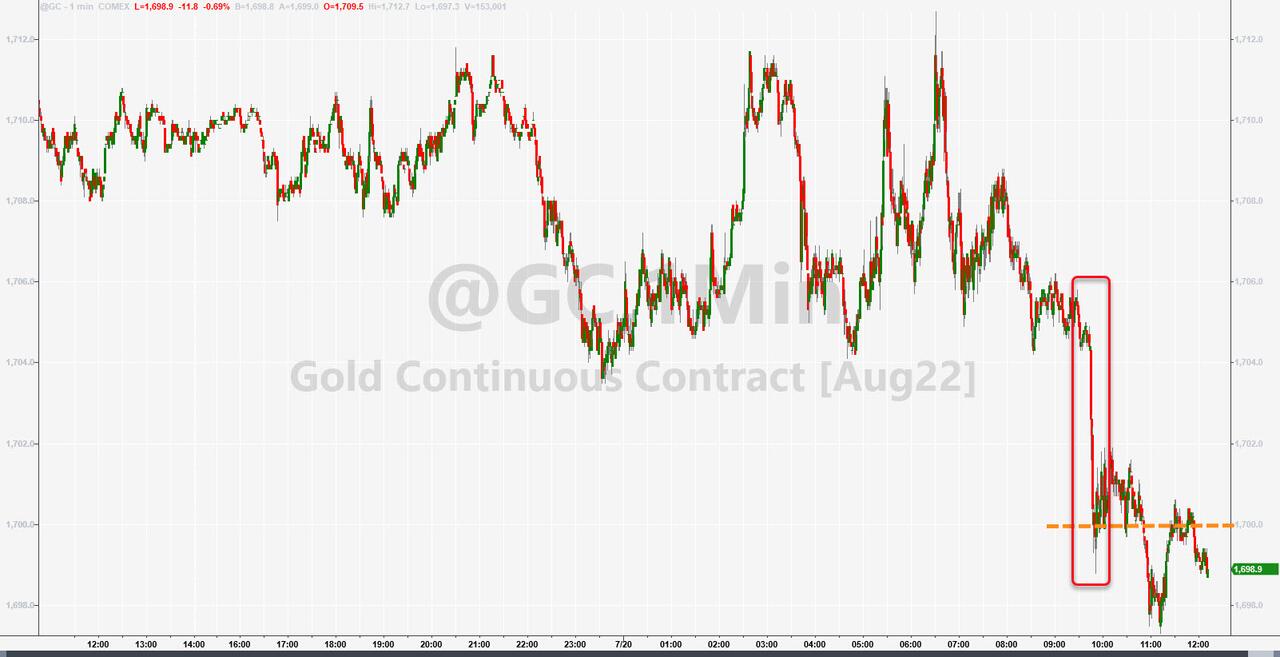
A big sell program in Europe did damage to Gold with the precious metal losing its $1,700 marker.

Uncertainty reigns, with Sam Stovall, chief investment strategist at CFRA Research, singing the same tune as I did yesterday:

History says, but does not guarantee, that yesterday was more likely a bear market bounce than the start of a new bull market.

Only time will tell.

Read More