
- Moving the markets
A hotter-than expected inflation report showed that the CPI rose 9.1% YoY in June, which was higher than May’s 8.6% reading, that had been the biggest increase since 1981. Economists expected an 8.8% print.
Even the Core CPI, which excludes food and energy, came in at 5.9% and topped the 5.7% estimate. On a monthly basis, the CPI was up 1.3% compared to hopes of 1.1%. Finally, some traders and investors are waking up to the fact that inflation has not yet reached its peak—far from it, in my opinion.
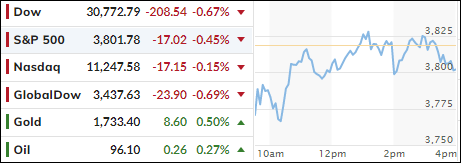
Initial market reaction was fast and furious with the Dow dropping over 400 points before staging a comeback. The reason for that sudden rebound was a report in the WSJ by Fed leaker Timiraos that a suddenly much feared 100bps rate hike in two weeks may not be realistic but a 75bps was.
That sent equities almost into a vertical ascent with the S&P 500 and the Nasdaq briefly seeing green numbers. However, Atlanta Fed President Bostic pulled the rug out from under this rally with quotes like this:
“Everything is in play.”
Asked if that included by raising rates by a full percentage point, he replied:
“it would mean everything.”
That destroyed any hope or confidence the WSJ article had created, so the major indexes headed back south but closed off their worst levels for the session.
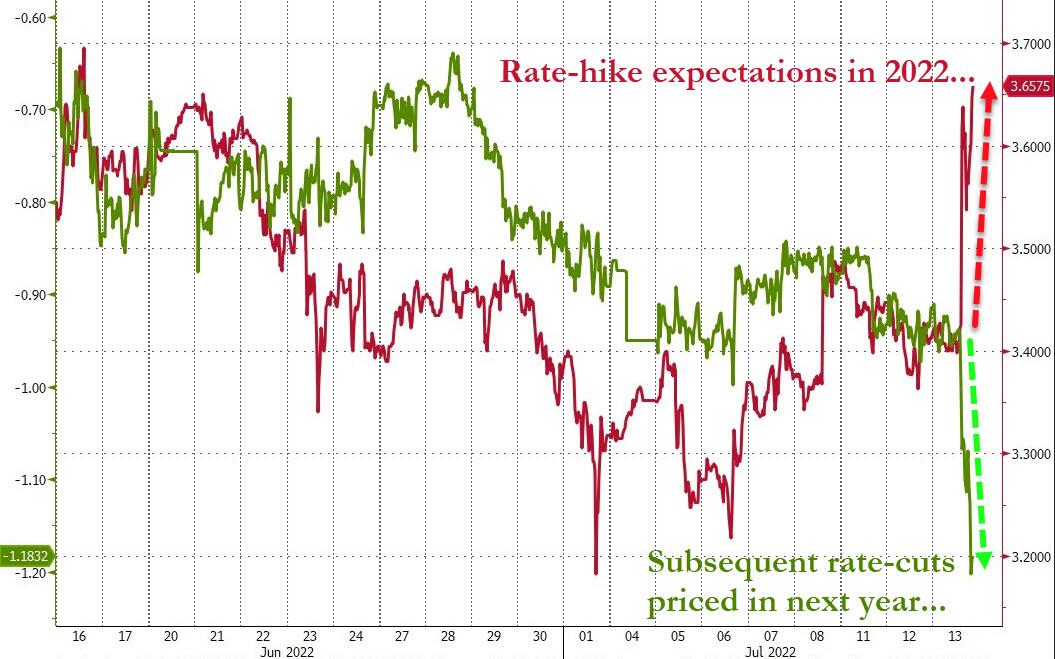
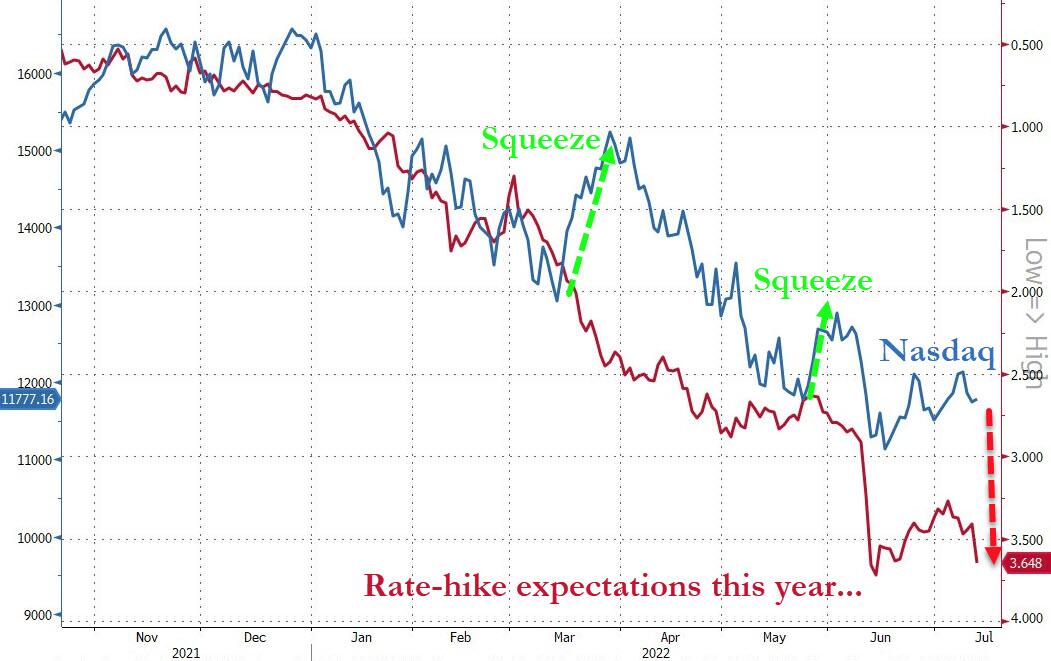
It means rate hike expectations are rising this year, with subsequent rate cuts virtually guaranteed in 2023, as the Fed will bail us out of a deep recession, as ZeroHedge put it.
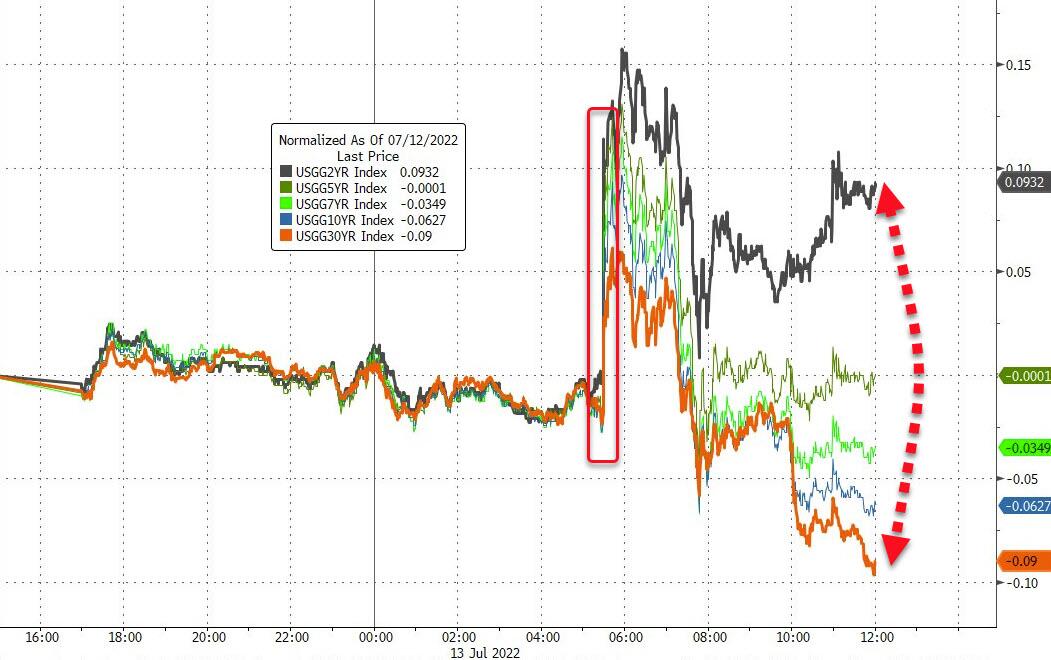
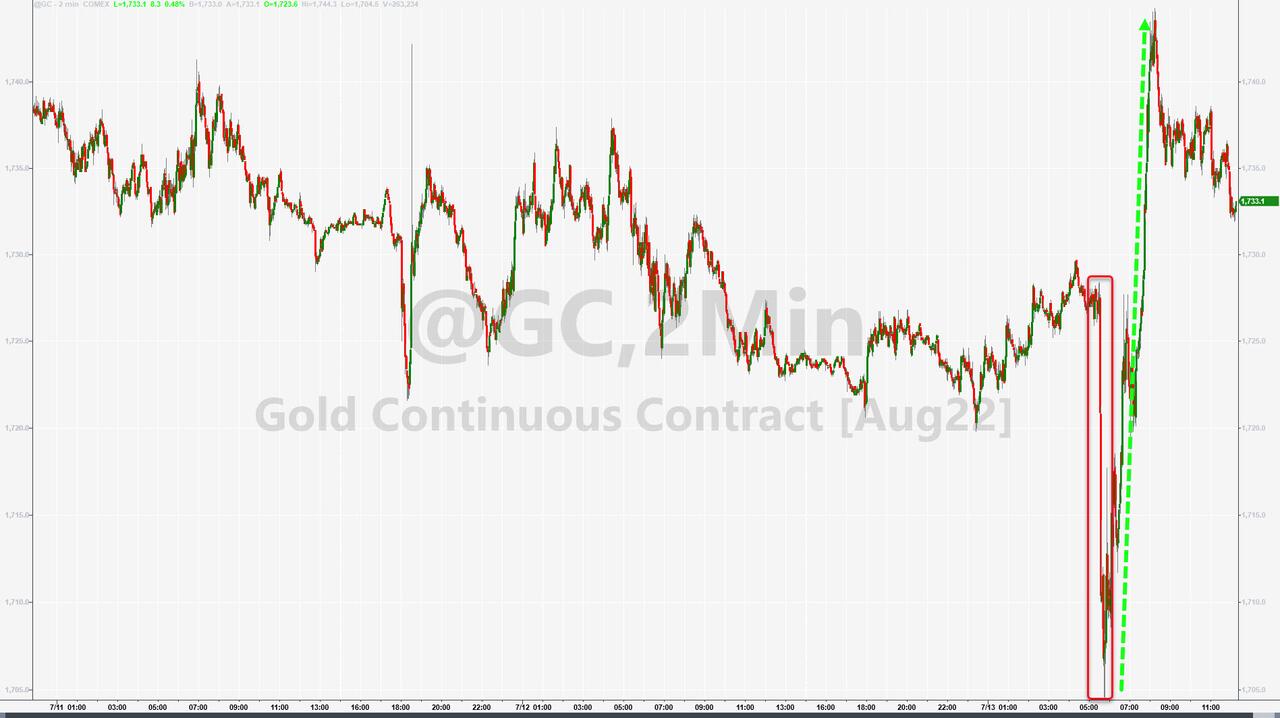
Bond yields spiked following the release of the CPI report, then dropped with only the 2-year yield closing higher. Gold rode its own roller coaster. The precious metal first puked then spiked and closed with modest gains.
ZH summed up the current environment like this:
- Stocks are still bipolar, and squeeze driven, as well as hoping beyond hope that the subsequent easing, after The Fed pushes the economy into recession, will save the day…
Hmm…
2. ETFs in the Spotlight
In case you missed the announcement and description of this section, you can read it here again.
It features some of the 10 broadly diversified domestic and sector ETFs from my HighVolume list as posted every Saturday. Furthermore, they are screened for the lowest MaxDD% number meaning they have been showing better resistance to temporary sell offs than all others over the past year.
The below table simply demonstrates the magnitude with which these ETFs are fluctuating above or below their respective individual trend lines (%+/-M/A). A break below, represented by a negative number, shows weakness, while a break above, represented by a positive percentage, shows strength.
For hundreds of ETF choices, be sure to reference Thursday’s StatSheet.
For this closed-out domestic “Buy” cycle (2/24/2022), here’s how some of our candidates have fared:
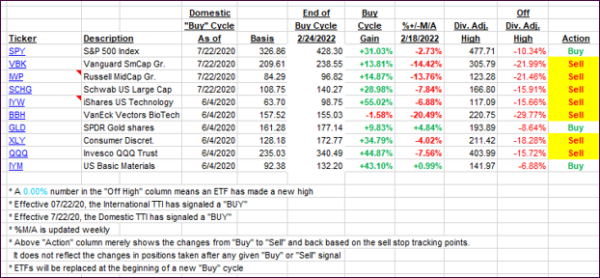
Click image to enlarge.
Again, the %+/-M/A column above shows the position of the various ETFs in relation to their respective long-term trend lines, while the trailing sell stops are being tracked in the “Off High” column. The “Action” column will signal a “Sell” once the -12% point has been taken out in the “Off High” column, which has replaced the prior -8% to -10% limits.
3. Trend Tracking Indexes (TTIs)
Our TTIs headed south again, as the S&P 500 retreated for the 4th day in a row.
This is how we closed 07/13/2022:
Domestic TTI: -11.30% below its M/A (prior close -10.81%)—Sell signal effective 02/24/2022.
International TTI: -13.54% below its M/A (prior close -12.94%)—Sell signal effective 03/08/2022.
Disclosure: I am obliged to inform you that I, as well as my advisory clients, own some of the ETFs listed in the above table. Furthermore, they do not represent a specific investment recommendation for you, they merely show which ETFs from the universe I track are falling within the specified guidelines.
All linked charts above are courtesy of Bloomberg via ZeroHedge.
Contact Ulli