
- Moving the markets
After the close yesterday, Walmart came out and cut its earnings forecast, which pulled all retailers lower in the afterhours trading session, as fears mounted that consumer spending, or rather the lack thereof, will now not be the driver to keep the U.S. out of a recession.
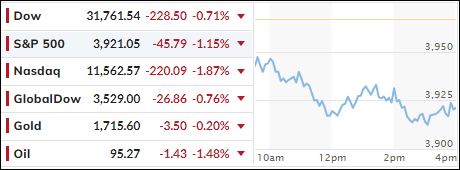
That sour mood carried into today’s red opening and worsened as the day went on with the major indexes closing broadly lower. The effect was that earnings expectations have been tempered with comments being of a cautionary nature, as the true effect of inflation has still to be recognized on a corporate level.
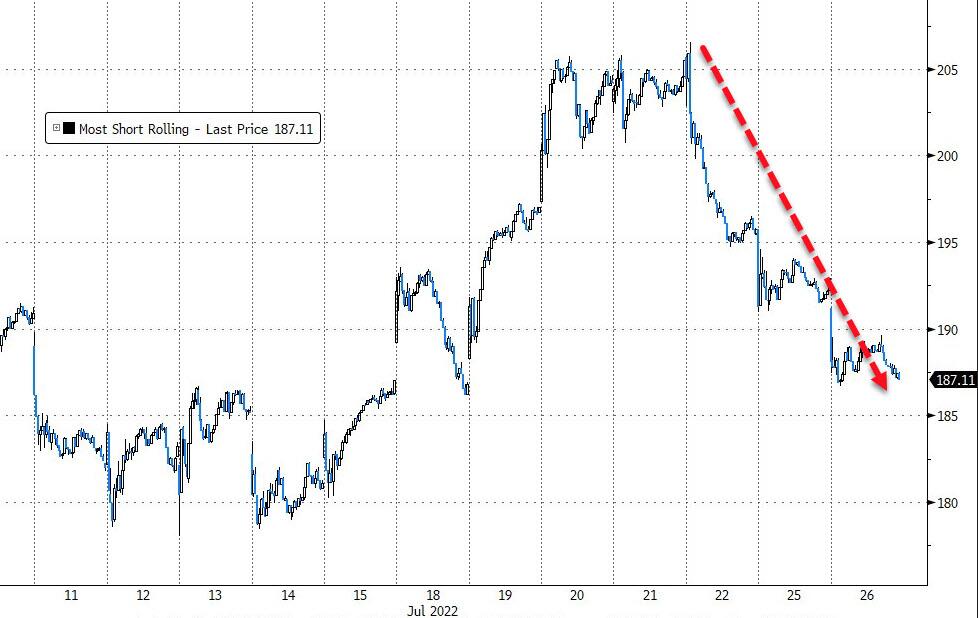
Markets received no directional help, because the always reliable short squeeze was conspicuously absent, as plunging New Home Sales, sagging of homebuilder confidence and record low affordability made their presence felt.
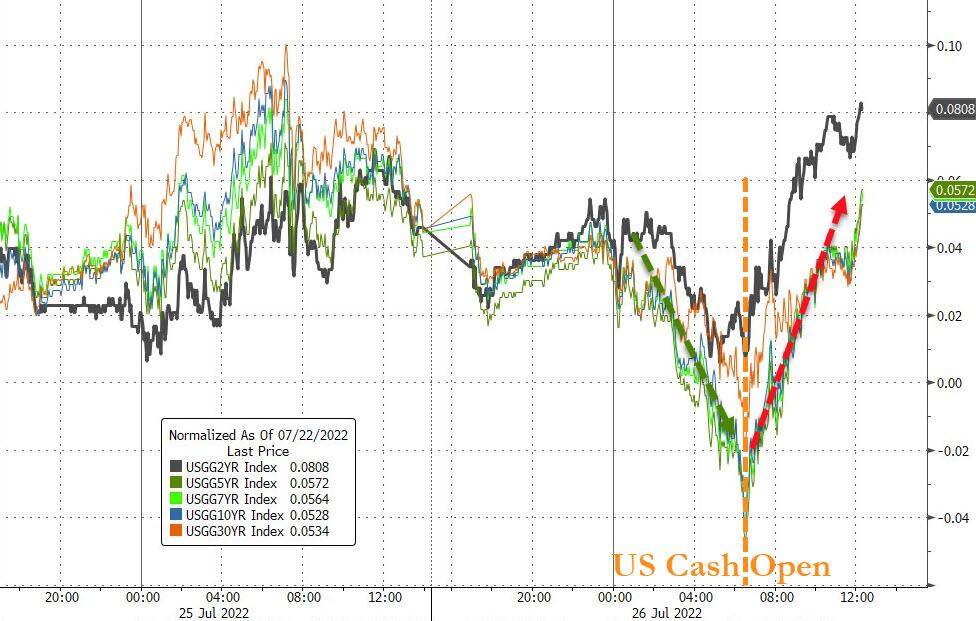
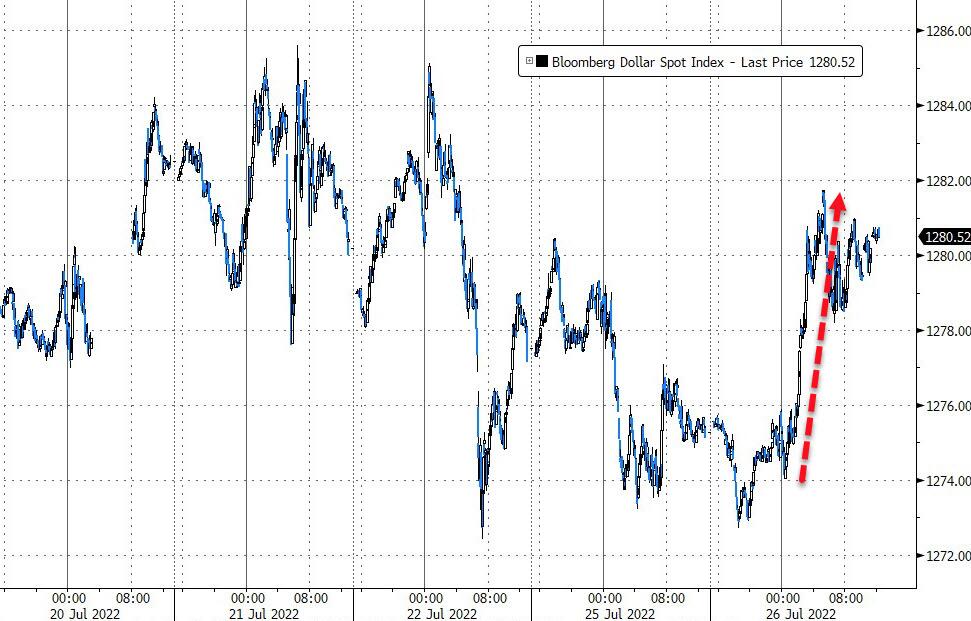
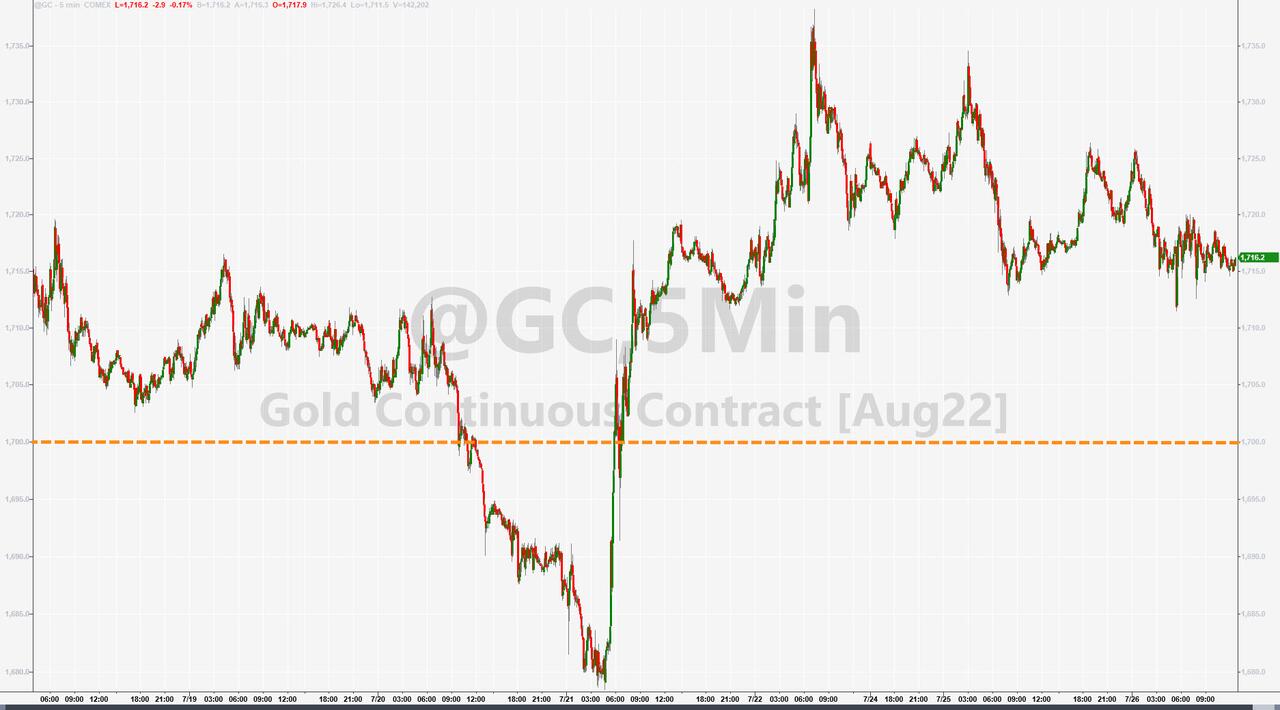
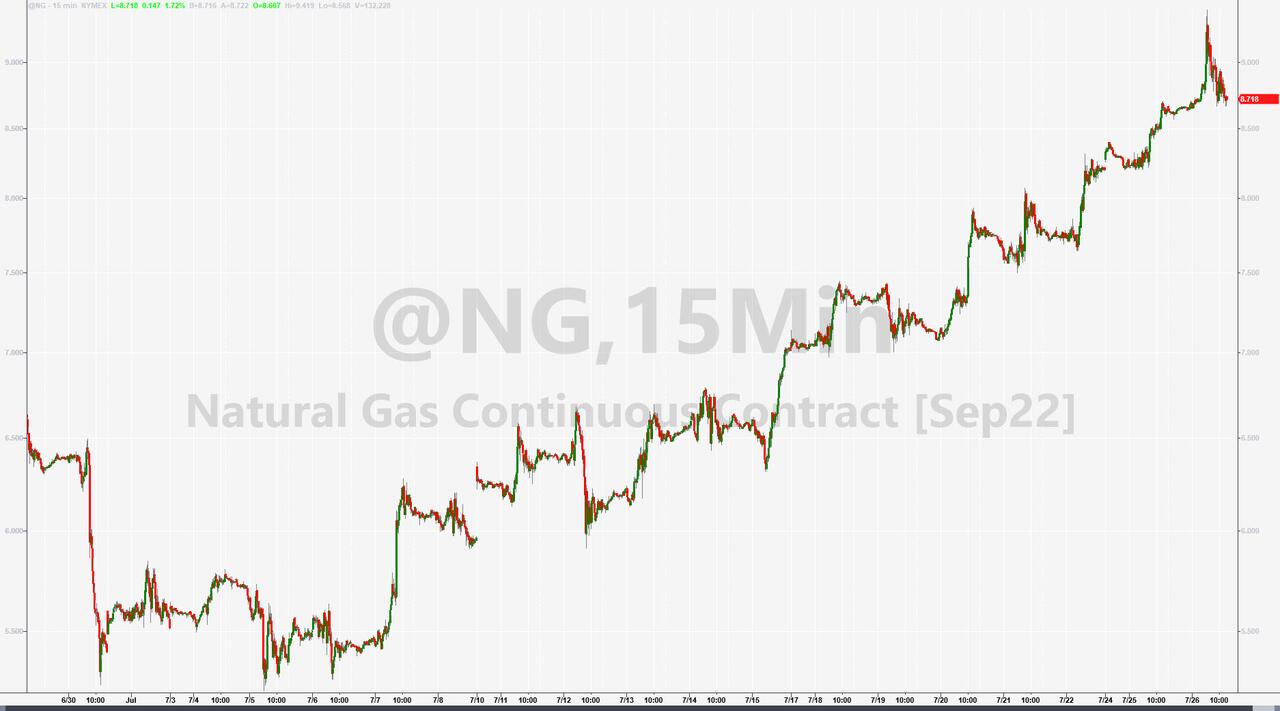
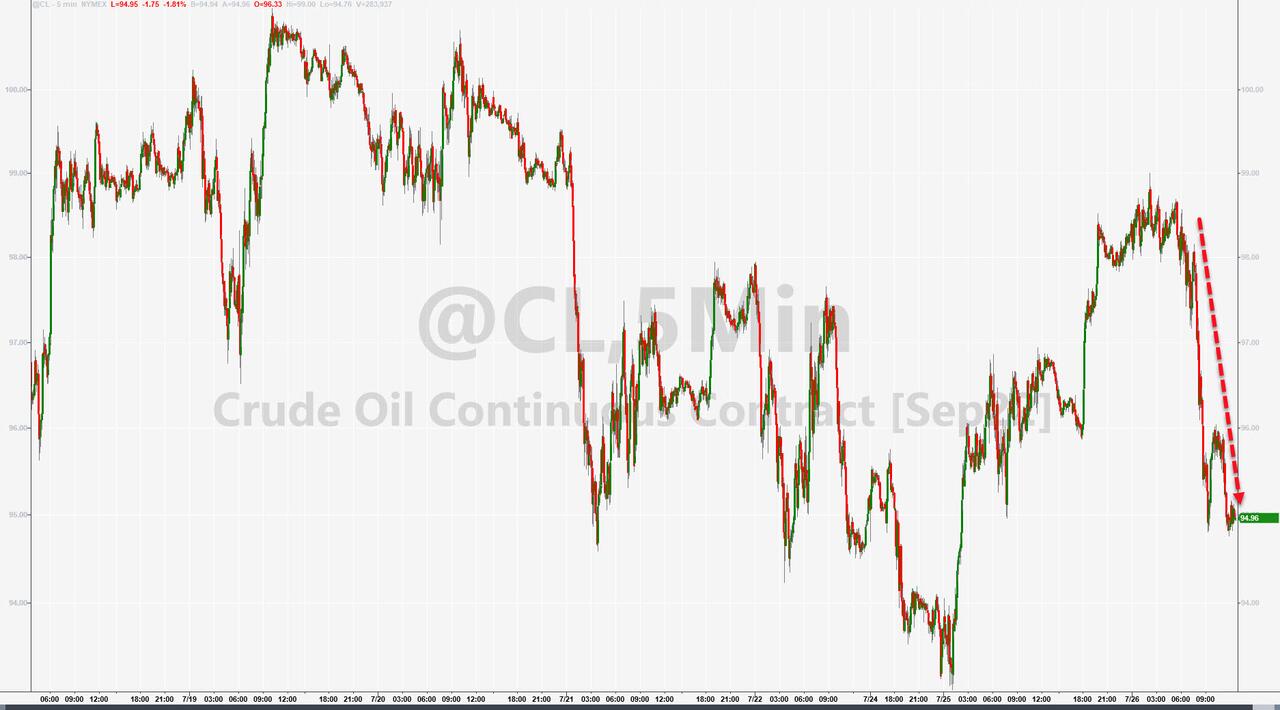
Bond yields rose moderately, the US Dollar bounced, while gold slipped a tad but held on to its $1,700 level. Natural Gas surged to 14-year highs, but Crude Oil slipped back towards the $95 level.
As I am writing this afterhours, Microsoft just released its quarterly report card, which showed top- and bottom-line misses. The stock is currently down some 5%, which may not bode well for Wednesday’s opening.
Tomorrow, however, the Fed’s announcement on interest rates will determine market direction.
2. ETFs in the Spotlight
In case you missed the announcement and description of this section, you can read it here again.
It features some of the 10 broadly diversified domestic and sector ETFs from my HighVolume list as posted every Saturday. Furthermore, they are screened for the lowest MaxDD% number meaning they have been showing better resistance to temporary sell offs than all others over the past year.
The below table simply demonstrates the magnitude with which these ETFs are fluctuating above or below their respective individual trend lines (%+/-M/A). A break below, represented by a negative number, shows weakness, while a break above, represented by a positive percentage, shows strength.
For hundreds of ETF choices, be sure to reference Thursday’s StatSheet.
For this closed-out domestic “Buy” cycle (2/24/2022), here’s how some of our candidates have fared. Keep in mind that our Domestic Trend Tracking Index (TTI) signaled a “Sell” on that date, which overrode the existing “Buys” shown for SPY and IYM:
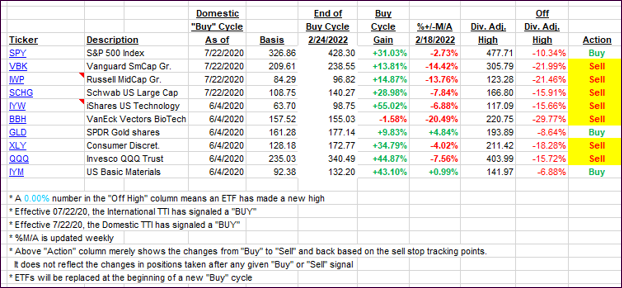
Click image to enlarge.
Again, the %+/-M/A column above shows the position of the various ETFs in relation to their respective long-term trend lines, while the trailing sell stops are being tracked in the “Off High” column. The “Action” column will signal a “Sell” once the -12% point has been taken out in the “Off High” column, which has replaced the prior -8% to -10% limits.
3. Trend Tracking Indexes (TTIs)
Our TTIs slipped with the bears dominating today’s session.
This is how we closed 07/26/2022:
Domestic TTI: -7.32% below its M/A (prior close -6.59%)—Sell signal effective 02/24/2022.
International TTI: -10.54% below its M/A (prior close -9.82%)—Sell signal effective 03/08/2022.
Disclosure: I am obliged to inform you that I, as well as my advisory clients, own some of the ETFs listed in the above table. Furthermore, they do not represent a specific investment recommendation for you, they merely show which ETFs from the universe I track are falling within the specified guidelines.
All linked charts above are courtesy of Bloomberg via ZeroHedge.
Contact Ulli