
- Moving the markets
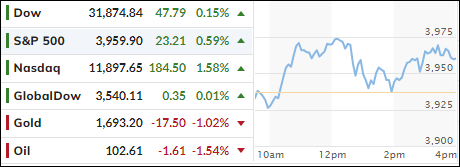
Despite and early sell-off, the major indexes found some footing, wobbled all day yet managed to produce another green close for the second straight day.
It was a tug-of-war between those traders who were scouring the latest corporate earnings for indications that profits remain on an upward trend, which would support higher stock prices in the future.
On the other hand, worries persist that market sentiment may be in limbo, until we get more clarity on a variety of high-profile issues, like the outlook for the economy, future Central Bank interest rate policy and the ever-present political battles with all its uncertainties.
Even ugly housing data and demand destruction in the energy sector, as ZH described it, were not able to put a damper on equities which, with the help of a short squeeze, although with less conviction than yesterday, managed to provide the impetus for keep the rally going.
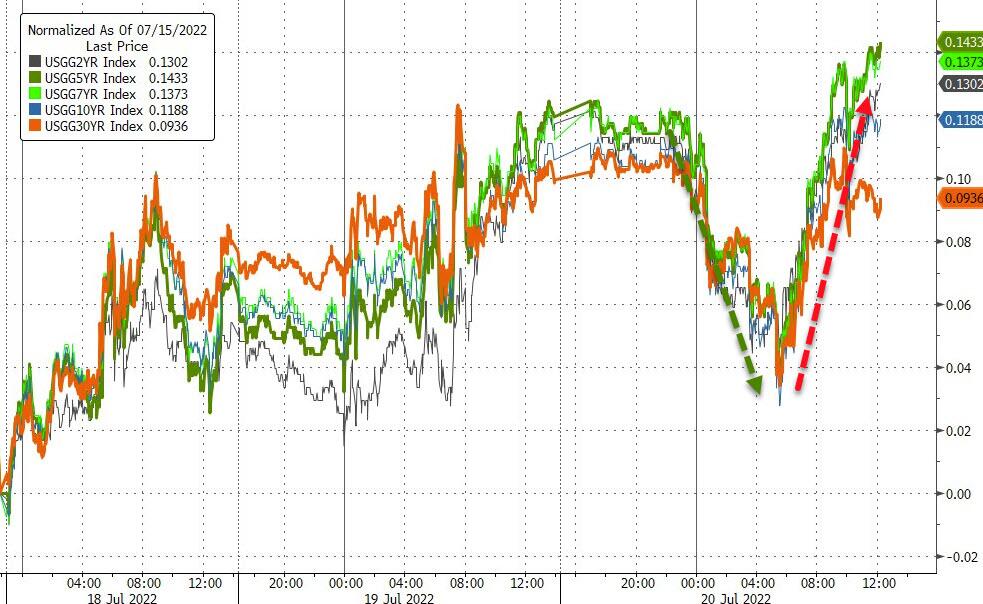
Bond yields inched up a tad and held the 10-year above its 3% level. Italy was in the limelight with their government collapsing, as their yields spiked to 3-week highs. The US Dollar rebounded a tad, after getting hammered over the past 7 days.
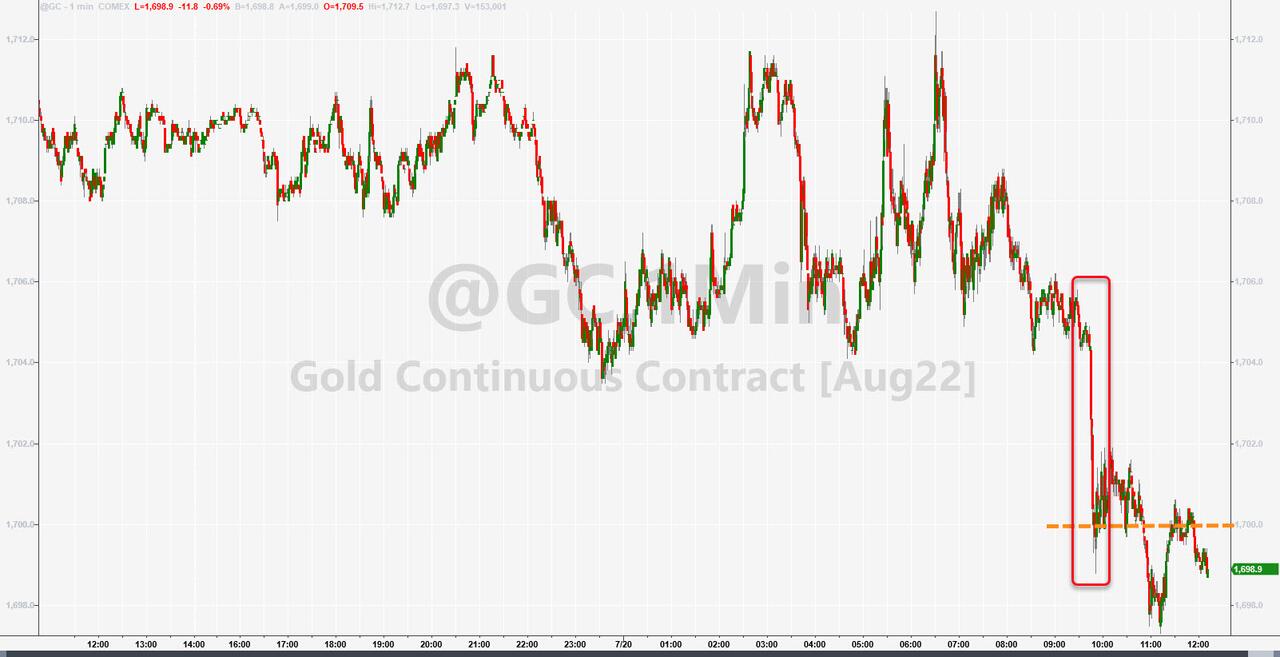
A big sell program in Europe did damage to Gold with the precious metal losing its $1,700 marker.
Uncertainty reigns, with Sam Stovall, chief investment strategist at CFRA Research, singing the same tune as I did yesterday:
History says, but does not guarantee, that yesterday was more likely a bear market bounce than the start of a new bull market.
Only time will tell.
2. ETFs in the Spotlight
In case you missed the announcement and description of this section, you can read it here again.
It features some of the 10 broadly diversified domestic and sector ETFs from my HighVolume list as posted every Saturday. Furthermore, they are screened for the lowest MaxDD% number meaning they have been showing better resistance to temporary sell offs than all others over the past year.
The below table simply demonstrates the magnitude with which these ETFs are fluctuating above or below their respective individual trend lines (%+/-M/A). A break below, represented by a negative number, shows weakness, while a break above, represented by a positive percentage, shows strength.
For hundreds of ETF choices, be sure to reference Thursday’s StatSheet.
For this closed-out domestic “Buy” cycle (2/24/2022), here’s how some of our candidates have fared. Keep in mind that our Domestic Trend Tracking Index (TTI) signaled a “Sell” on that date, which overrode the existing “Buys” shown for SPY and IYM:
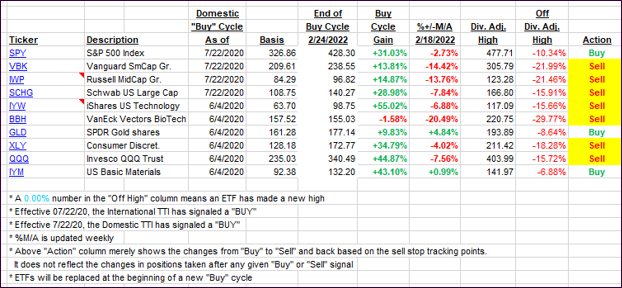
Click image to enlarge.
Again, the %+/-M/A column above shows the position of the various ETFs in relation to their respective long-term trend lines, while the trailing sell stops are being tracked in the “Off High” column. The “Action” column will signal a “Sell” once the -12% point has been taken out in the “Off High” column, which has replaced the prior -8% to -10% limits.
3. Trend Tracking Indexes (TTIs)
Our TTIs improved a smidgen due to another green showing in the indexes.
This is how we closed 07/20/2022:
Domestic TTI: -7.26% below its M/A (prior close -7.88%)—Sell signal effective 02/24/2022.
International TTI: -10.59% below its M/A (prior close -10.66%)—Sell signal effective 03/08/2022.
Disclosure: I am obliged to inform you that I, as well as my advisory clients, own some of the ETFs listed in the above table. Furthermore, they do not represent a specific investment recommendation for you, they merely show which ETFs from the universe I track are falling within the specified guidelines.
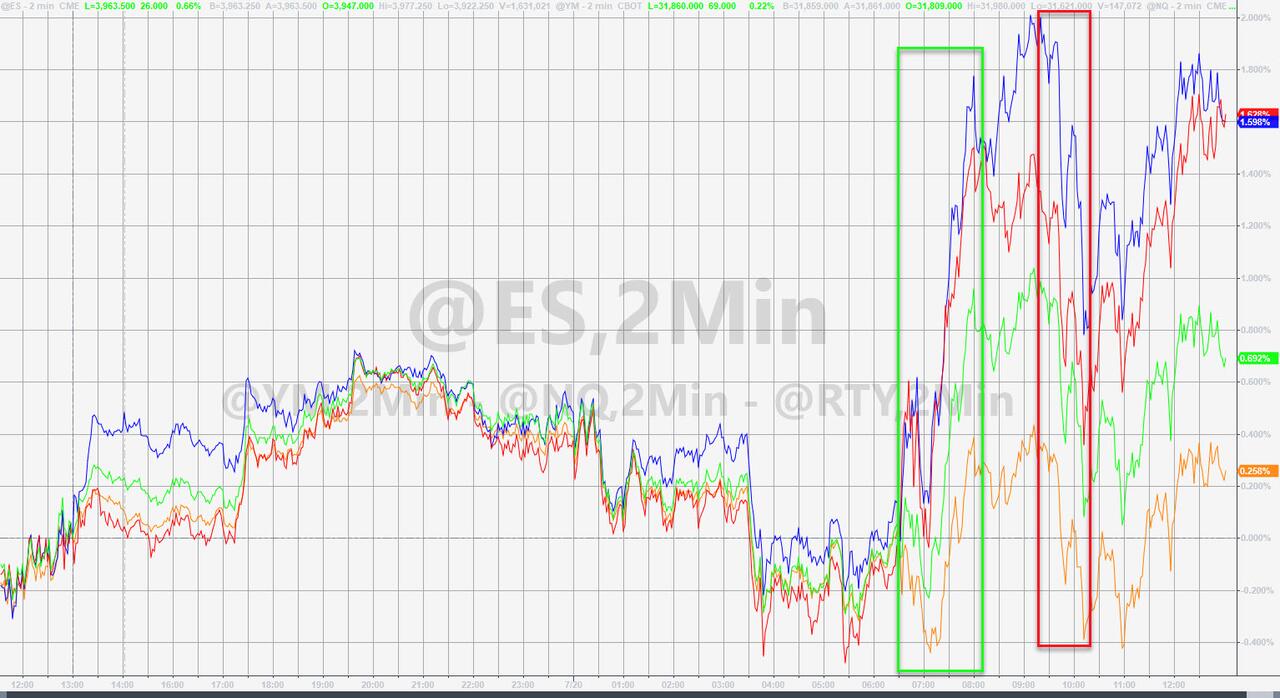
All linked charts above are courtesy of Bloomberg via ZeroHedge.
Contact Ulli