
- Moving the markets
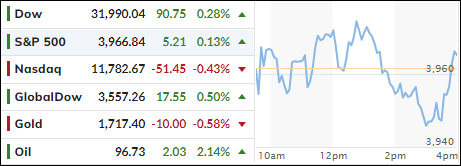
The major indexes fluttered throughout the session with no clear direction, because traders prepared themselves for the big events later this week. The next 4 trading days will be the busiest, as about one third of the S&P 500 members are scheduled to release their earnings reports.
The Fed will be on deck Wednesday with the world watching its decision on interest rates, or more specifically whether they will hike 75 or 100 bps. As important will be their outlook as to whether a moderate tone towards future hikes will prevail.
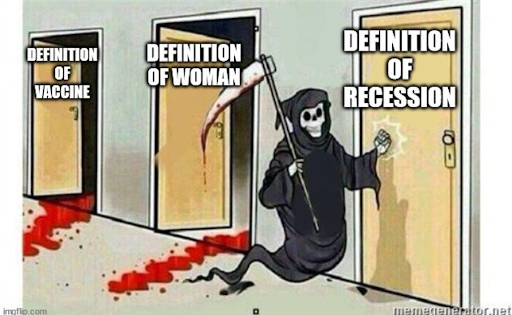
To top it off, Thursday’s GDP report will likely show a second consecutive quarter of declines, which means we will have officially entered recession territory, no matter how much the current administration is trying to move the goalposts via a new definition of what a recession is. For clarity, ZeroHedge posted this tongue in cheek comparison.
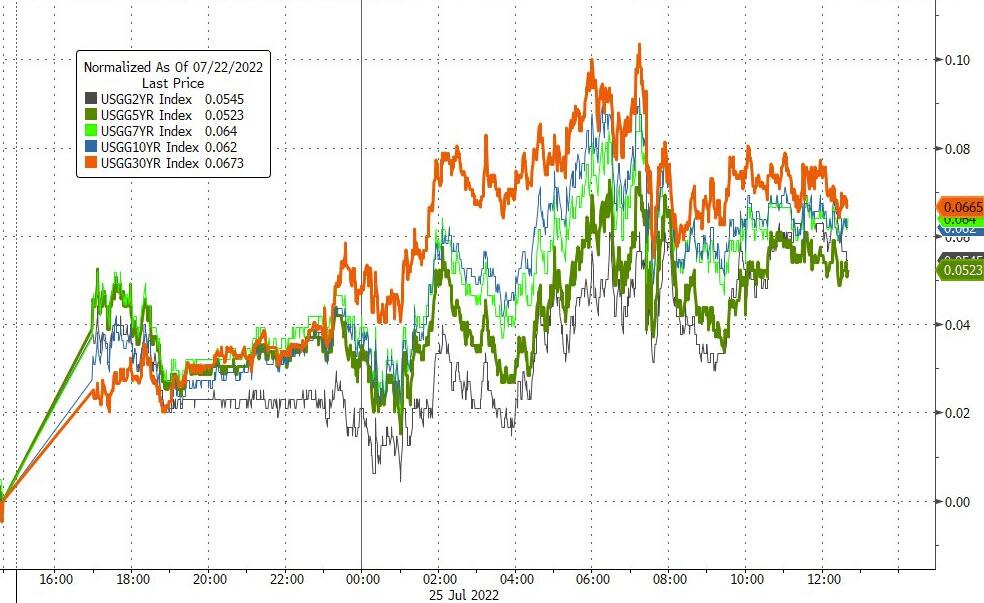
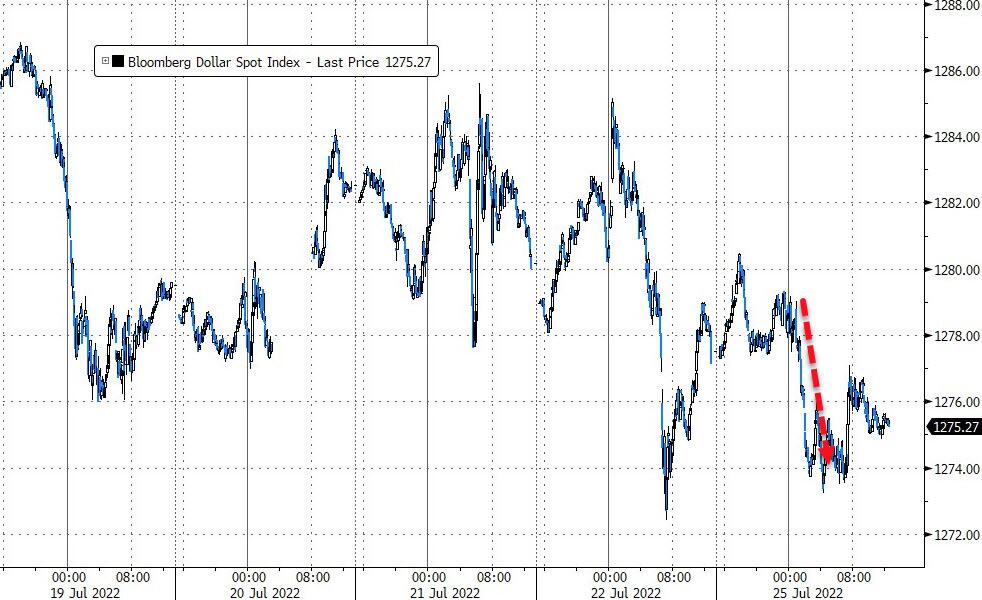
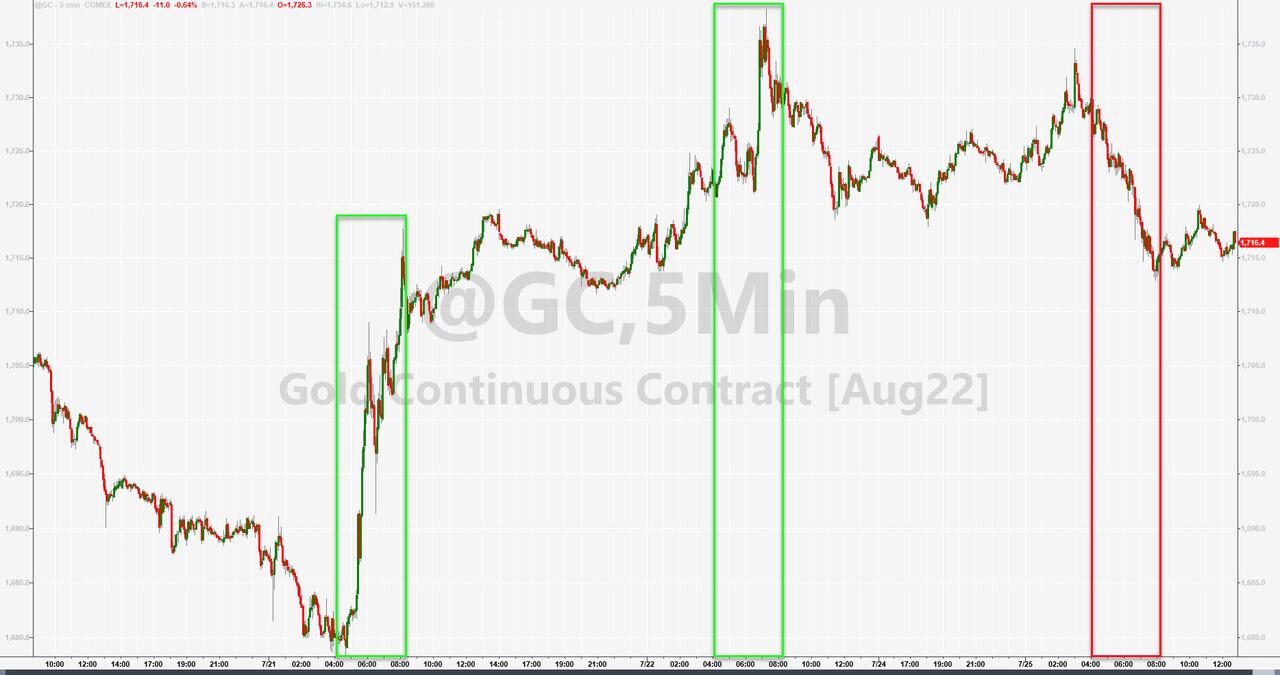
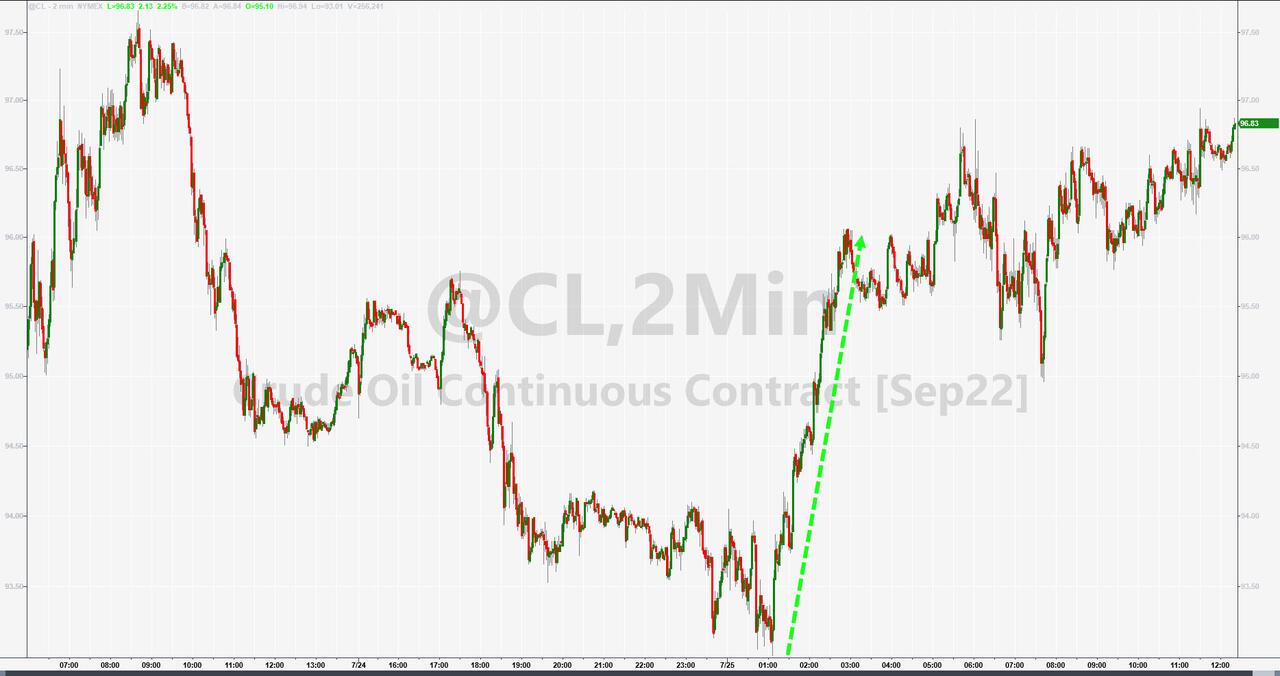
Bond yields rose moderately, but the 10-year remained below its psychologically important 3% level. The US Dollar dipped, as did gold, but Crude Oil bucked the trend, edged higher yet stayed below its $100 threshold.
It promises to be a weak where anything is possible in terms of market direction.
2. ETFs in the Spotlight
In case you missed the announcement and description of this section, you can read it here again.
It features some of the 10 broadly diversified domestic and sector ETFs from my HighVolume list as posted every Saturday. Furthermore, they are screened for the lowest MaxDD% number meaning they have been showing better resistance to temporary sell offs than all others over the past year.
The below table simply demonstrates the magnitude with which these ETFs are fluctuating above or below their respective individual trend lines (%+/-M/A). A break below, represented by a negative number, shows weakness, while a break above, represented by a positive percentage, shows strength.
For hundreds of ETF choices, be sure to reference Thursday’s StatSheet.
For this closed-out domestic “Buy” cycle (2/24/2022), here’s how some of our candidates have fared. Keep in mind that our Domestic Trend Tracking Index (TTI) signaled a “Sell” on that date, which overrode the existing “Buys” shown for SPY and IYM:

Click image to enlarge.
Again, the %+/-M/A column above shows the position of the various ETFs in relation to their respective long-term trend lines, while the trailing sell stops are being tracked in the “Off High” column. The “Action” column will signal a “Sell” once the -12% point has been taken out in the “Off High” column, which has replaced the prior -8% to -10% limits.
3. Trend Tracking Indexes (TTIs)
Our TTIs improved a bit, as the markets more or less trod water in anticipation of major news releases.
This is how we closed 07/25/2022:
Domestic TTI: -6.59% below its M/A (prior close -6.83%)—Sell signal effective 02/24/2022.
International TTI: -9.82% below its M/A (prior close -10.35%)—Sell signal effective 03/08/2022.
Disclosure: I am obliged to inform you that I, as well as my advisory clients, own some of the ETFs listed in the above table. Furthermore, they do not represent a specific investment recommendation for you, they merely show which ETFs from the universe I track are falling within the specified guidelines.
All linked charts above are courtesy of Bloomberg via ZeroHedge.
Contact Ulli