

- Moving the markets
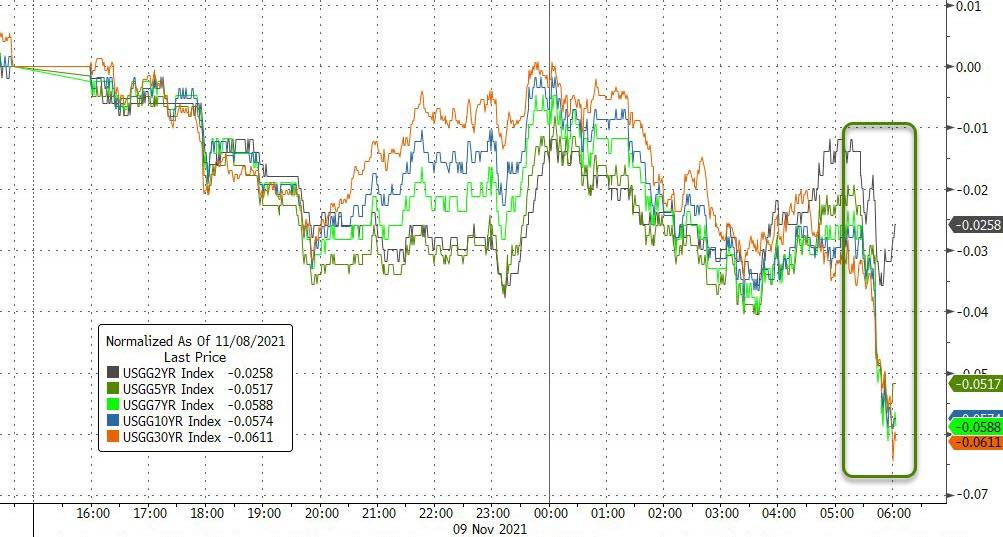
The eagerly expected print of the current Producer Price Index (PPI) clearly showed the error of assuming that inflation will be transitory. For a change, analysts had forecast an eye popping 8.6% YoY rise in producer prices, and they nailed that number, which represents a new record high for YoY increases.
MoM, the expectation was 0.6%, which proved to be accurate as well, with ZeroHedge adding these details:
One-third of the October advance in the index for final demand goods can be traced to prices.
Over 80 percent of the October increase in prices for final demand services can be traced to margins for automobiles and automobile parts retailing, which rose 8.9 percent.
The gap between PPI and CPI continues to run at record highs, meaning either consumers are about to be crushed or margins are going to collapse.
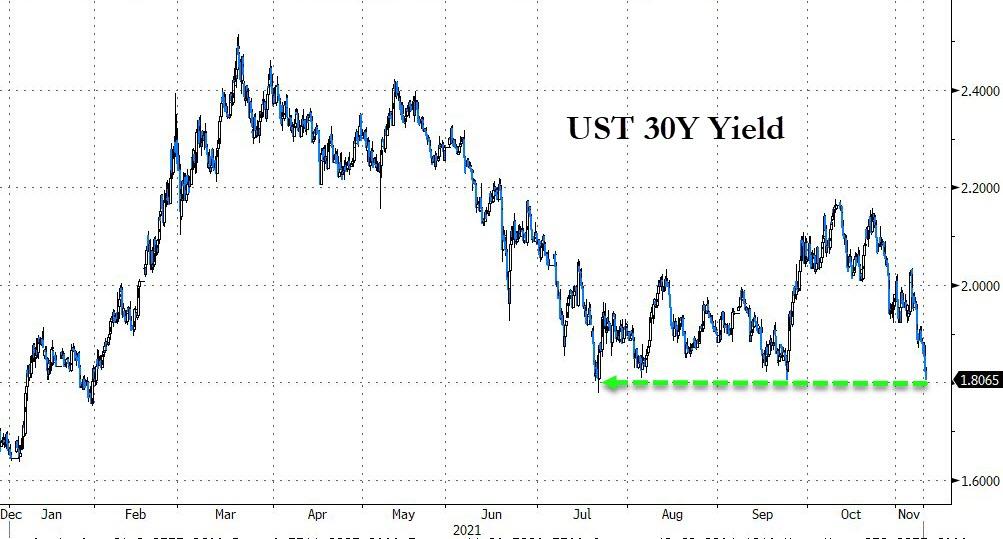
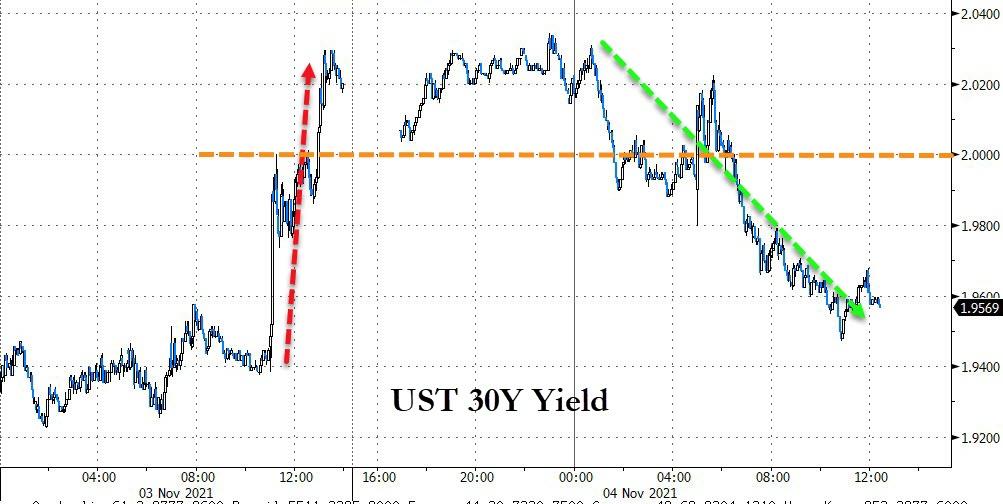
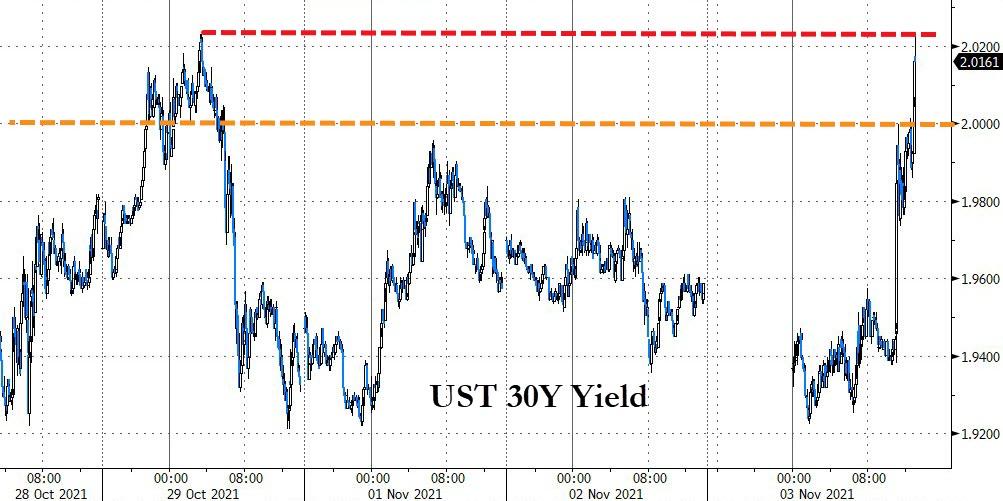
With this record PPI print you would have expected bond yields to spike, but the opposite occurred with entire yield curve tumbling, as the 30-year got pushed down to levels last seen in July. Huh?
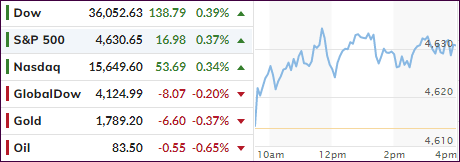
The major indexes only closed moderately in the red thanks to the usual last hour lift-a-thon, which prevented a worse outcome. Nevertheless, the S&P 500’s 8-day winning streak came to an end, in part induced by profit taking.
Tesla was in the news today, but with a negative slant, as the stock got slammed some 12% for no apparent reason other than rumors that Elon Musk may need to sell some of his personal holdings.
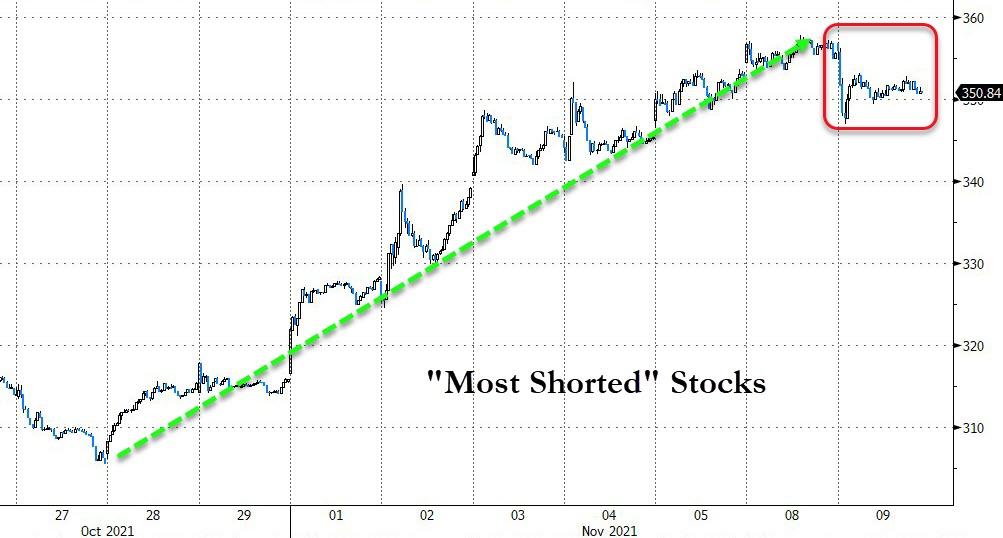
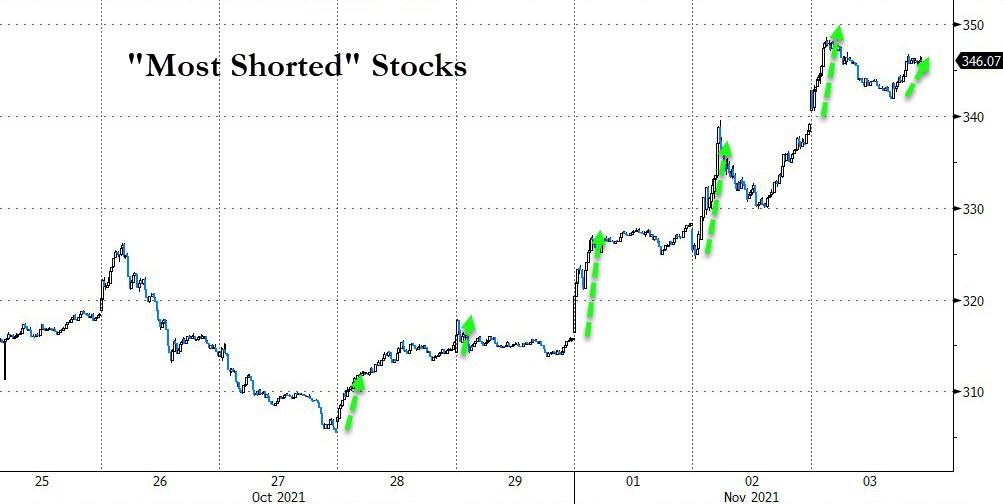
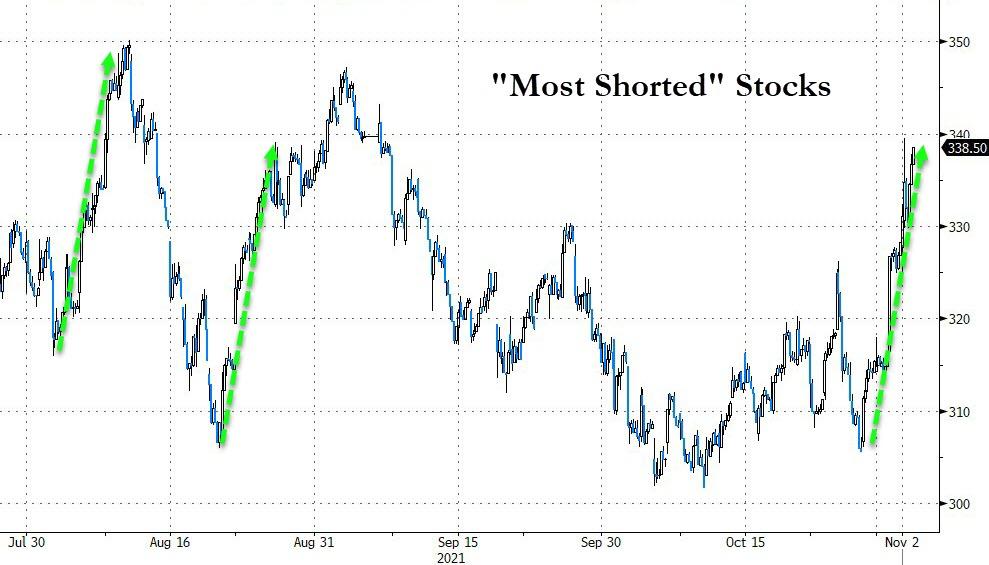
Even the “most shorted stocks,” which are usually manhandled to support the bullish meme and cause short sellers to cover, headed south and then got stuck in a sideways pattern thereby not affecting market direction.
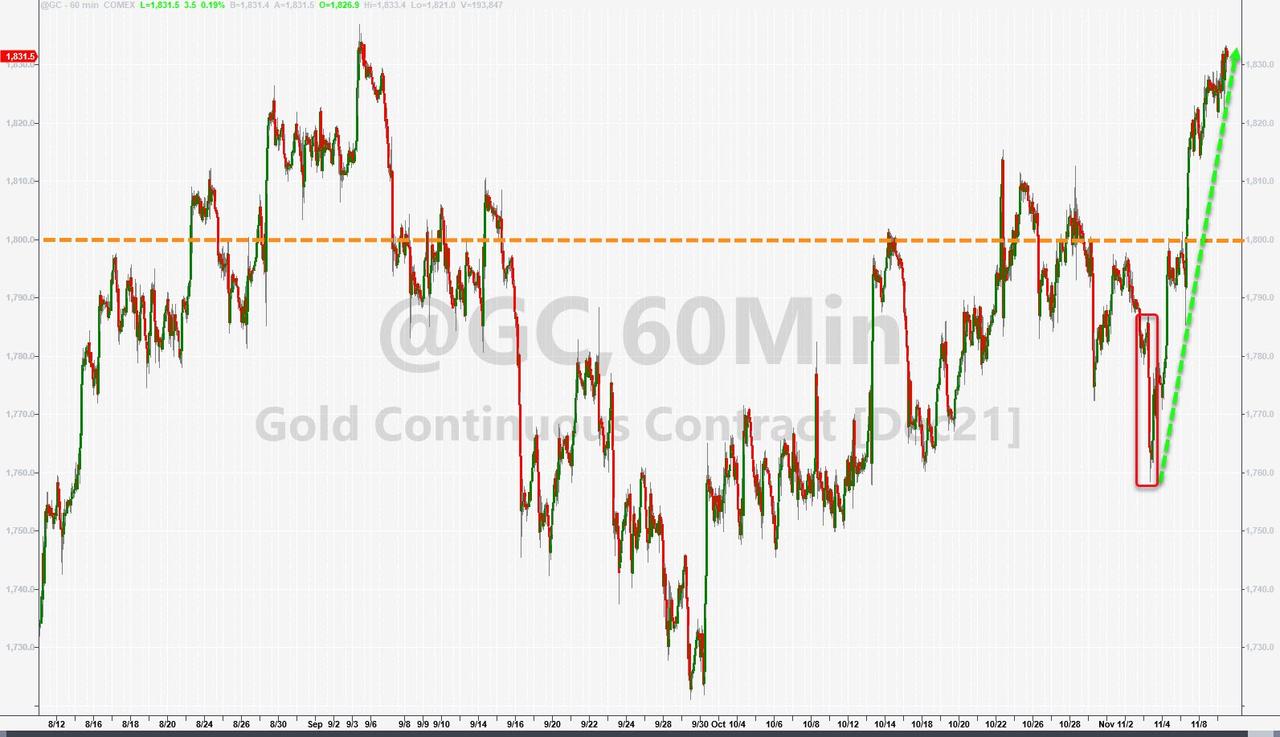
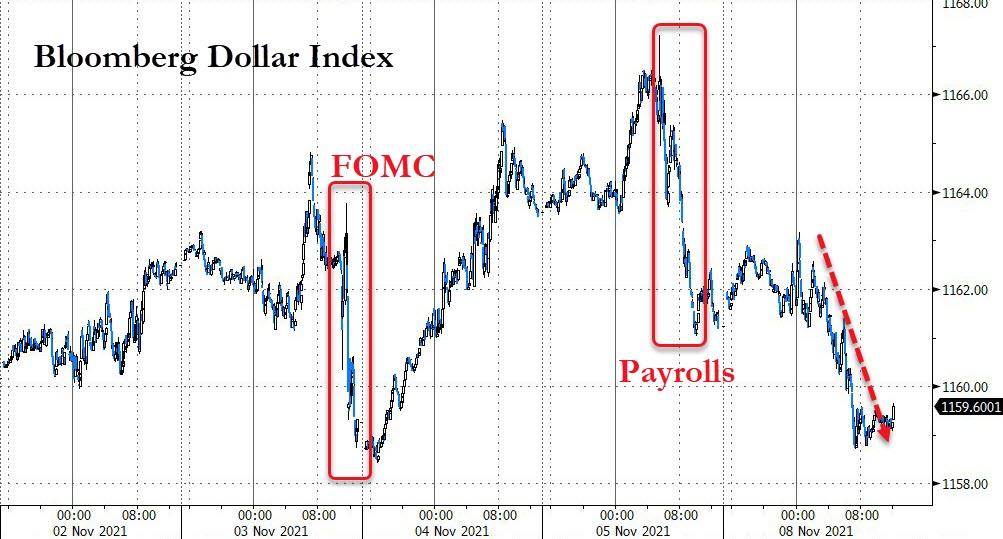
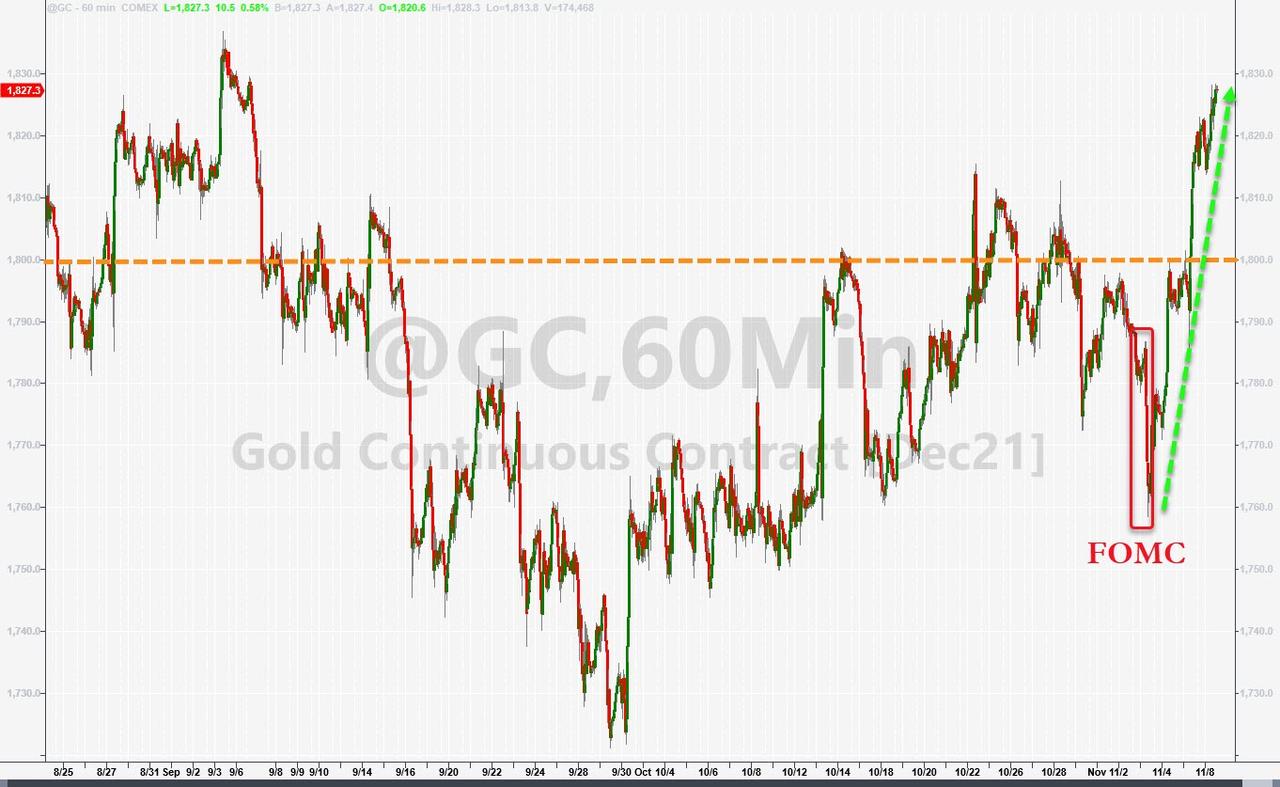
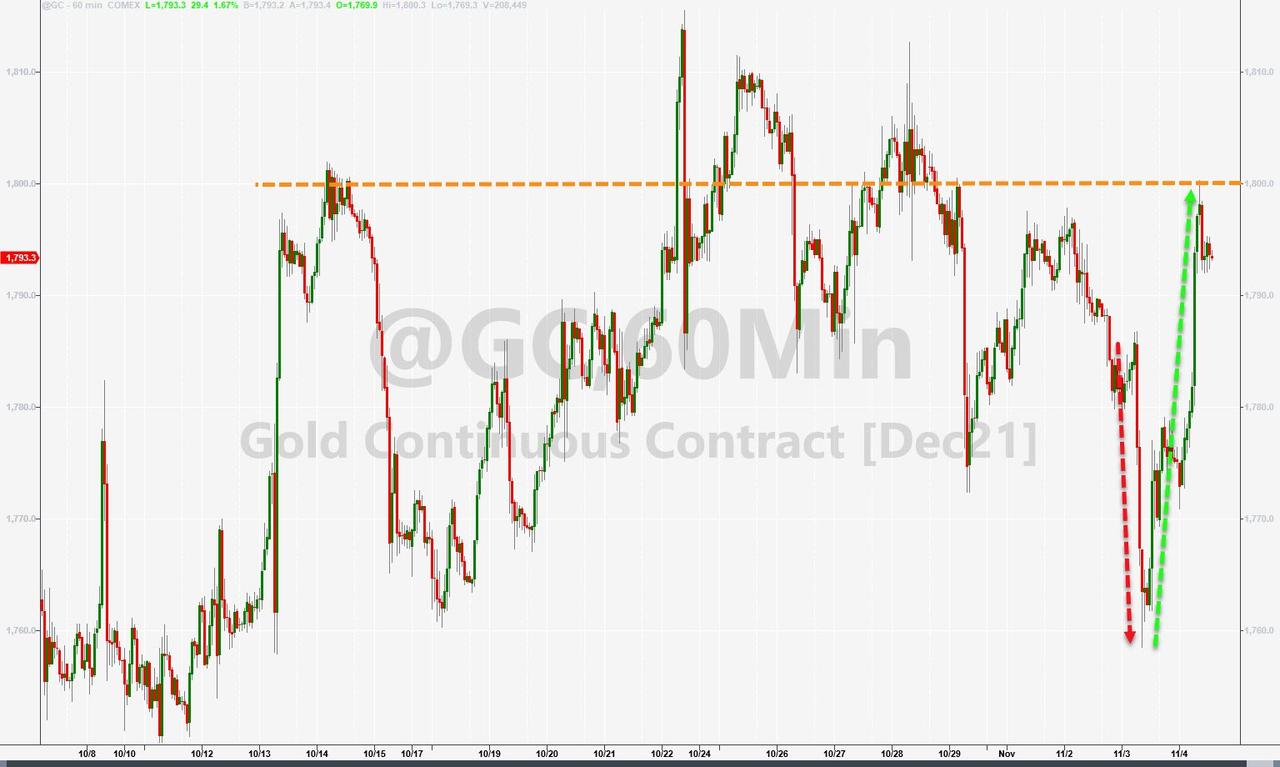
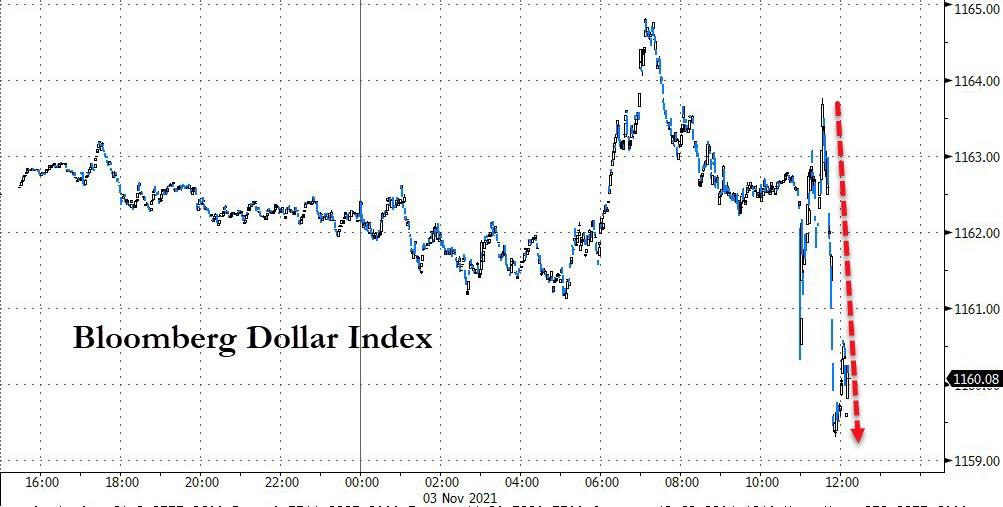
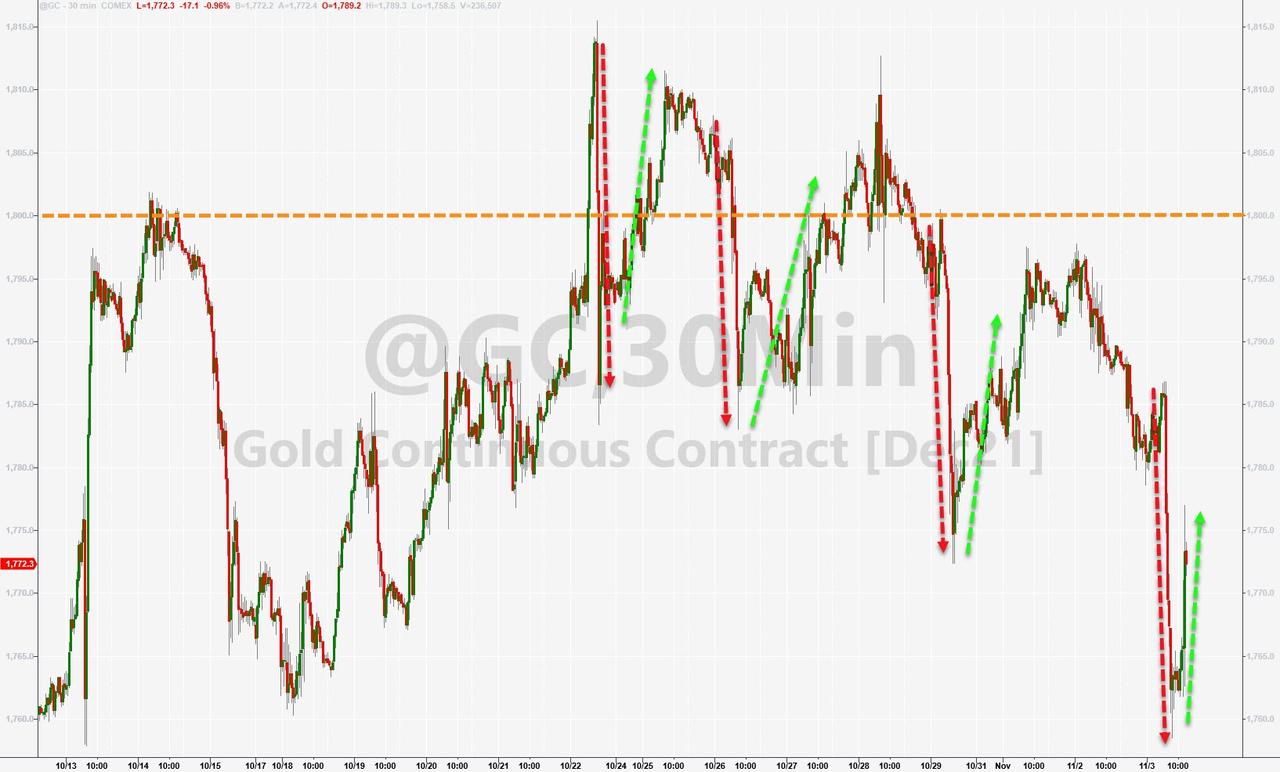
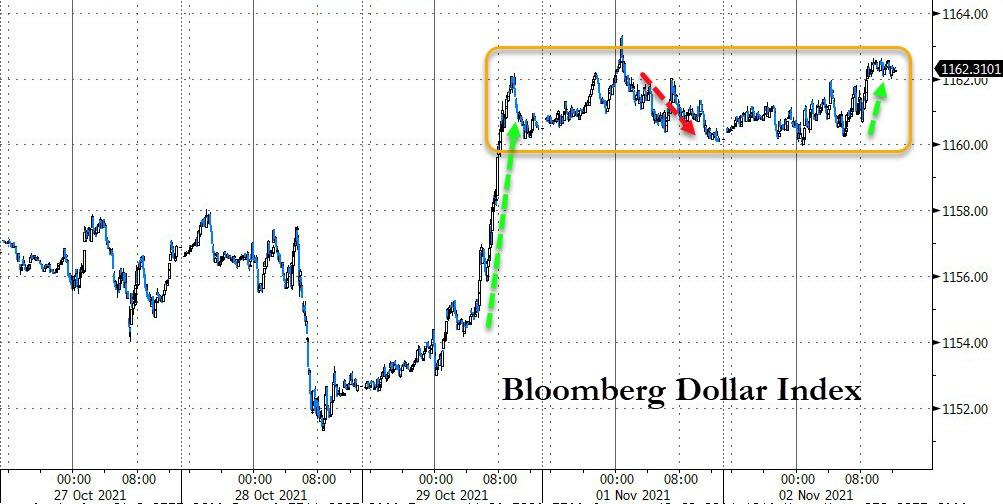
The US Dollar wandered aimlessly and essentially closed unchanged, but Gold managed to keep its recent upward trajectory intact by gaining 0.34% and solidifying its position above the $1,800 level.
With the earnings season coming to an end, new catalysts are needed to keep this market from slipping. I envision these to be solid economic data points and more re-openings, but given the current overall economic and political landscape, this may be just wishful thinking on my part.
Read More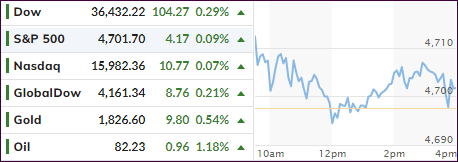
