
- Moving the markets
After Friday’s mid-day dump, which was followed by a pump into the close, the markets registered their best week in over 6 months not for equities but also for bonds and gold. This meme dominated today’s trading environment and was supported by Congress having passed the $ 1 trillion infrastructure spending package.
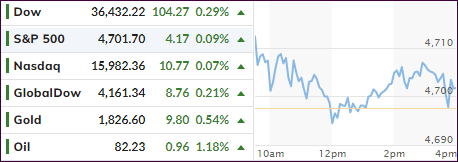
While the details are sketchy and preliminary analysis showing the amount of pork being part of it, traders saw it as a positive and pushed the major indexes to another green close, during which the Dow touched a new intraday high, while the Nasdaq and S&P 500 set new records.
Friday’s emotional high, caused by a better-than-expected jobs report showing that 531k jobs were added last month, still created a warm and fuzzy feeling for the bullish crowd to keep the momentum going.
On deck this week are the critical readings of the Producer and Consumer price indexes, both of which will likely confirm that inflation is here to stay and not “transitory,” as the Fed wants you to believe.
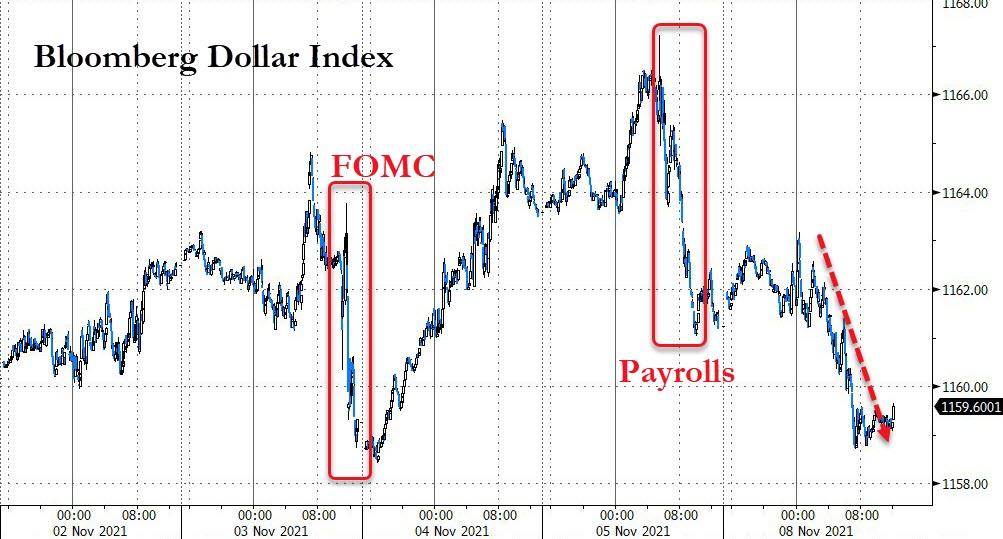
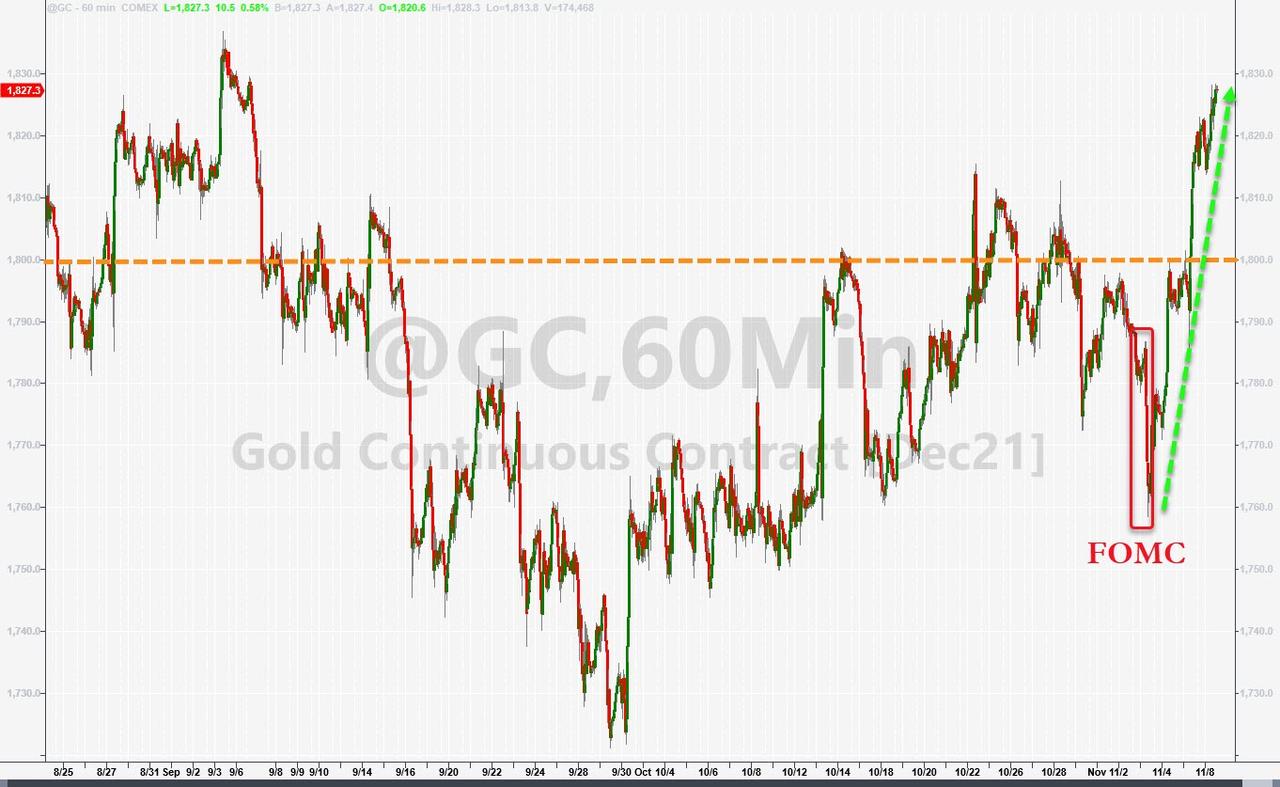
The US Dollar continued its downswing from Friday and lost 0.31% in the process. That helped Gold to resume its turnaround with the precious metal gaining 0.51% and solidifying its position above its $1,800 level. That was a solid rebound, especially in the face of rising bond yields, with the 10-year jumping back to the 1.5% level.
2. ETFs in the Spotlight
In case you missed the announcement and description of this section, you can read it here again.
It features some of the 10 broadly diversified domestic and sector ETFs from my HighVolume list as posted every Saturday. Furthermore, they are screened for the lowest MaxDD% number meaning they have been showing better resistance to temporary sell offs than all others over the past year.
The below table simply demonstrates the magnitude with which these ETFs are fluctuating above or below their respective individual trend lines (%+/-M/A). A break below, represented by a negative number, shows weakness, while a break above, represented by a positive percentage, shows strength.
For hundreds of ETF choices, be sure to reference Thursday’s StatSheet.
For this current domestic “Buy” cycle, here’s how some our candidates have fared:

Click image to enlarge.
Again, the %+/-M/A column above shows the position of the various ETFs in relation to their respective long-term trend lines, while the trailing sell stops are being tracked in the “Off High” column. The “Action” column will signal a “Sell” once the -8% point has been taken out in the “Off High” column. For more volatile sector ETFs, the trigger point is -10%.
3. Trend Tracking Indexes (TTIs)
Our TTIs inched higher and remained in tune with the overall bullish theme.
This is how we closed 11/08/2021:
Domestic TTI: +8.48% above its M/A (prior close +8.32%)—Buy signal effective 07/22/2020.
International TTI: +4.82% above its M/A (prior close +4.60%)—Buy signal effective 07/22/2020.
Disclosure: I am obliged to inform you that I, as well as my advisory clients, own some of the ETFs listed in the above table. Furthermore, they do not represent a specific investment recommendation for you, they merely show which ETFs from the universe I track are falling within the specified guidelines.
All linked charts above are courtesy of Bloomberg via ZeroHedge.
Contact Ulli