Finding A Catalyst

Ulli Market Commentary Contact

[Chart courtesy of MarketWatch.com]

  1. Moving the markets

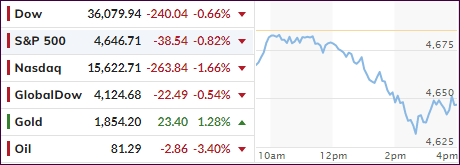
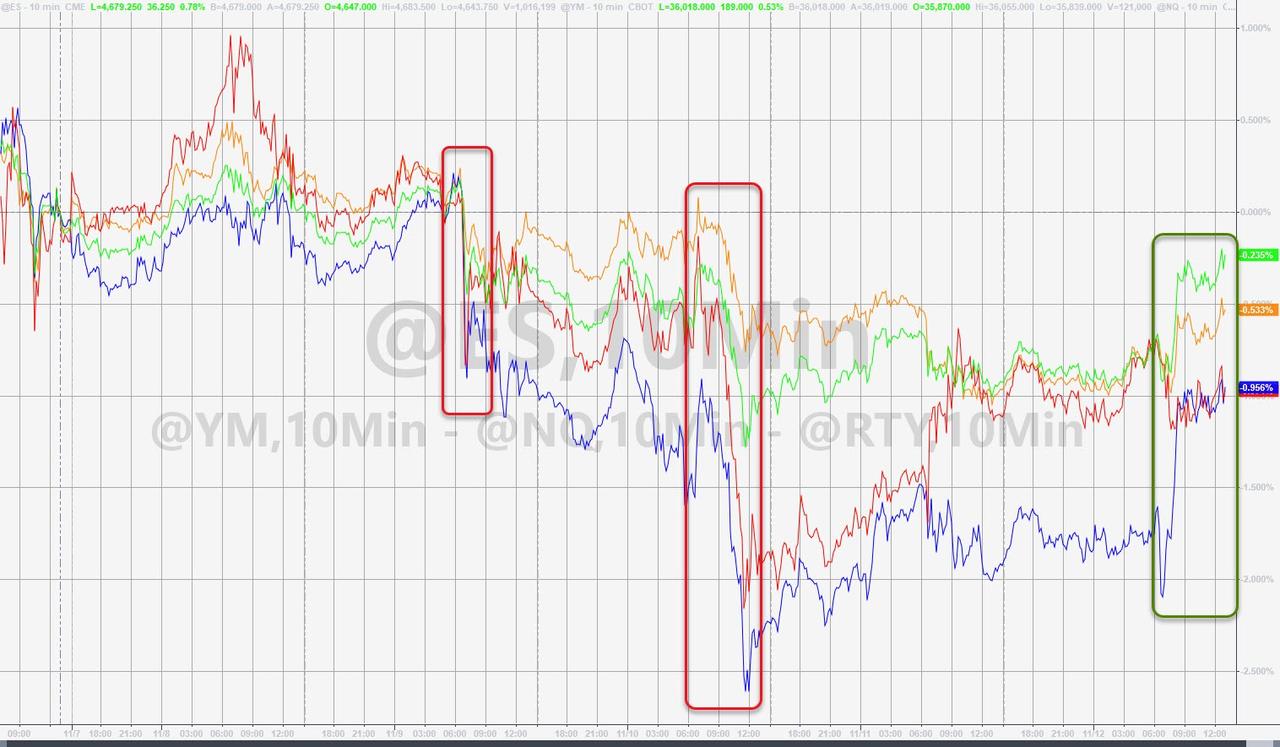
An initial bounce caused by strong October retail sales, as well as better-than-expected earnings report cards from Home Depot and Walmart, ran into some resistance mid-day, but the major indexes still managed to eke out a gain.

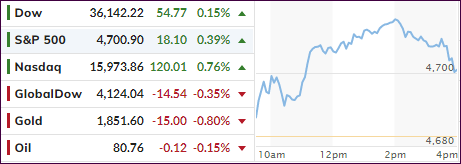
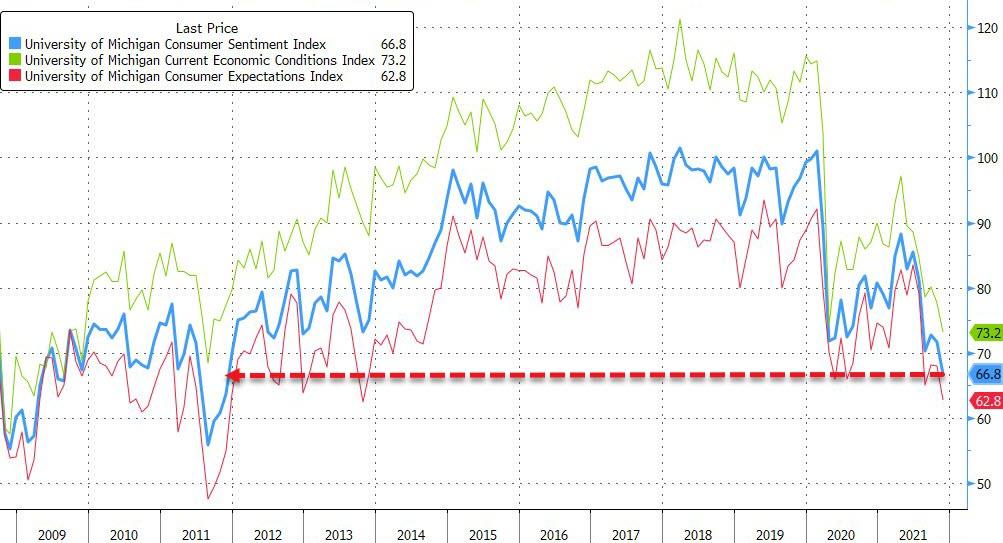
Leading the pack was the Nasdaq with a solid 0.76% advance, while the Dow lagged and barely stayed in the green. Traders took the above data as a sign that consumers are still in spending mode, however, their motivation may have been to buy now to avoid higher prices later.

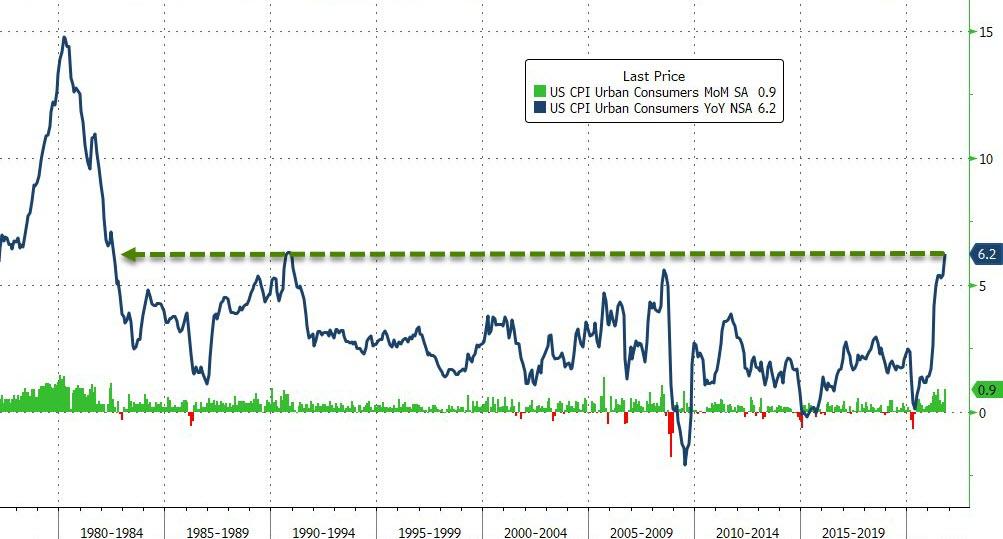
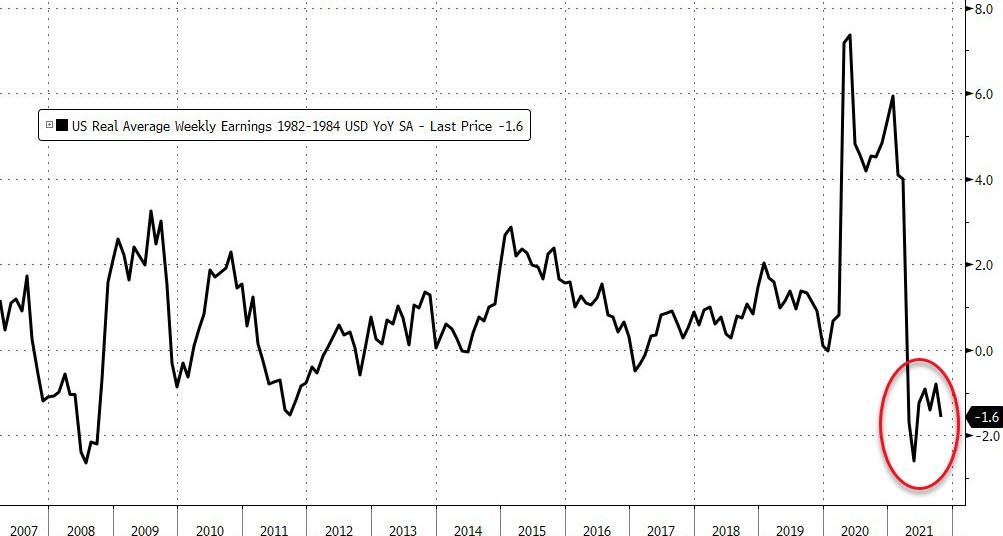
The latest retail data showed that consumers increased their spending, as sales jumped 1.7%, a considerable increase from the prior month’s meager 0.8%. Online sales took top billing with an increase of 10.2% YoY, even though the CPI surged 6.2% YoY.

Despite the recent rut in the averages, MarketWatch noted that the Dow sits away from his record by 1.4%, while the S&P and Nasdaq hover within 1% of theirs.

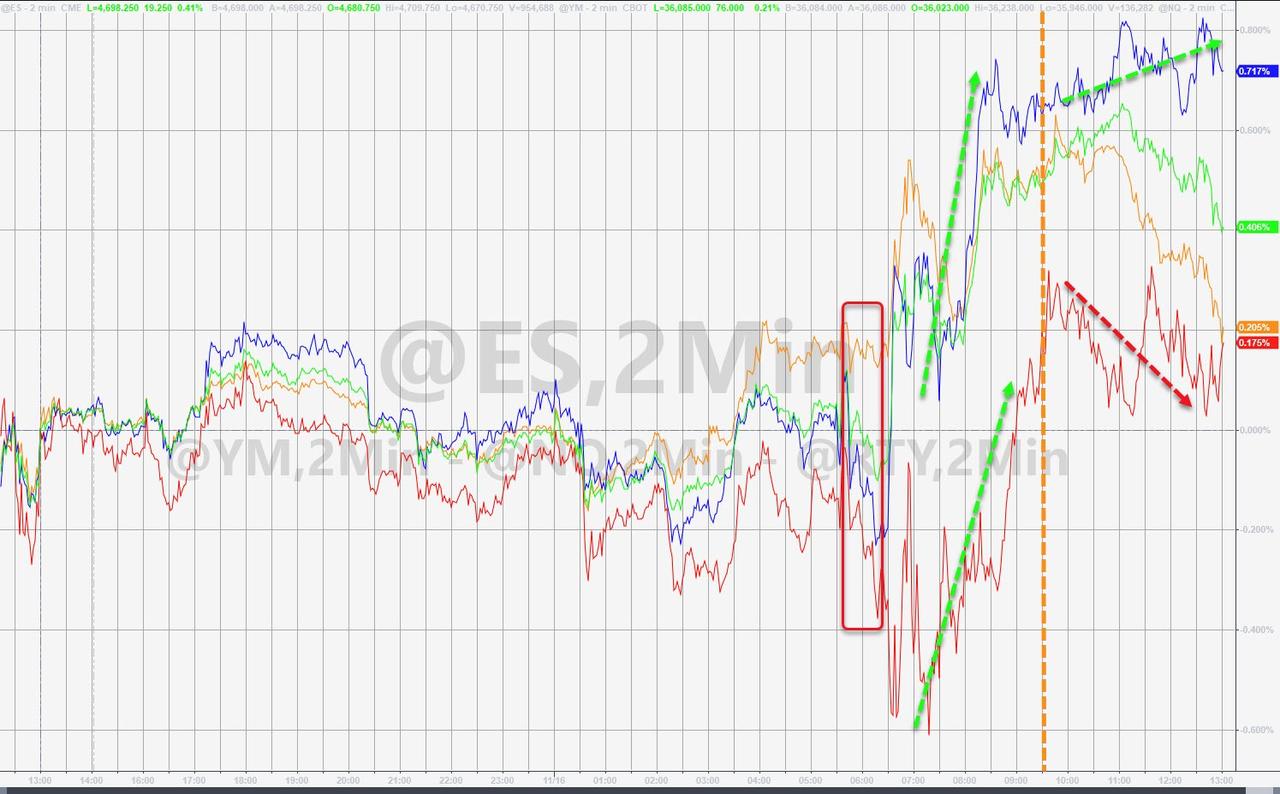
Today’s rebound was again helped by a short squeeze, which provided the much needed fuel to keep the markets on track for a green close, because bond yields continued their run. The 30-year again climbed above the 2% level but did not break out of November’s trading range—yet.

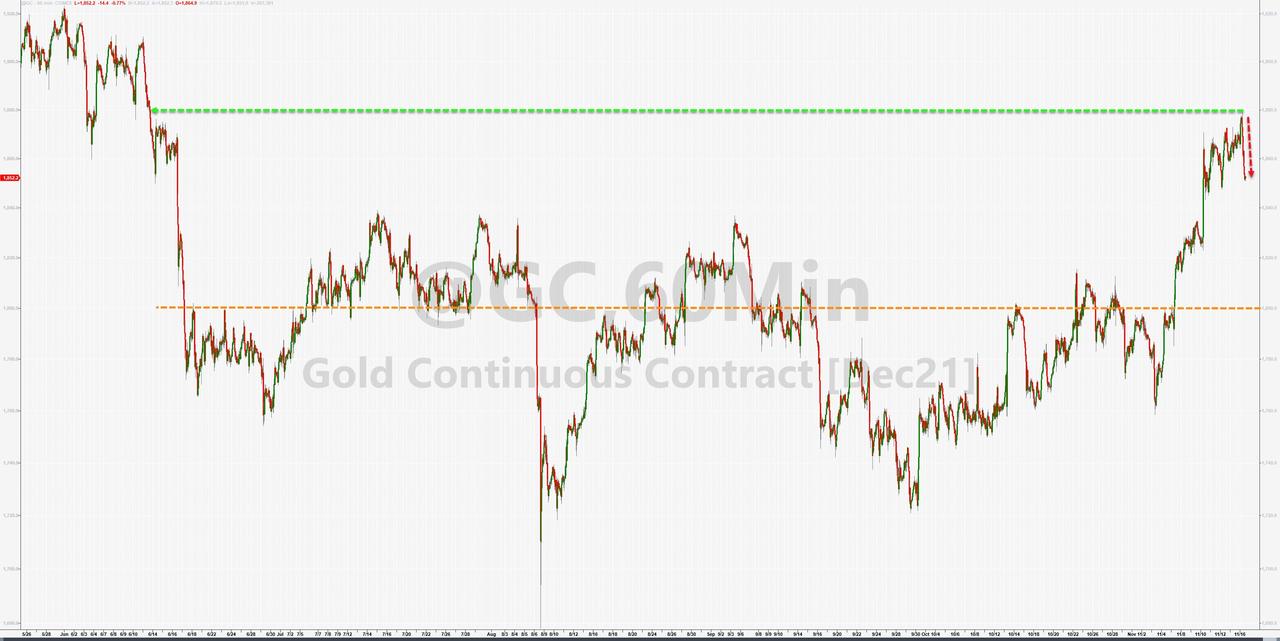
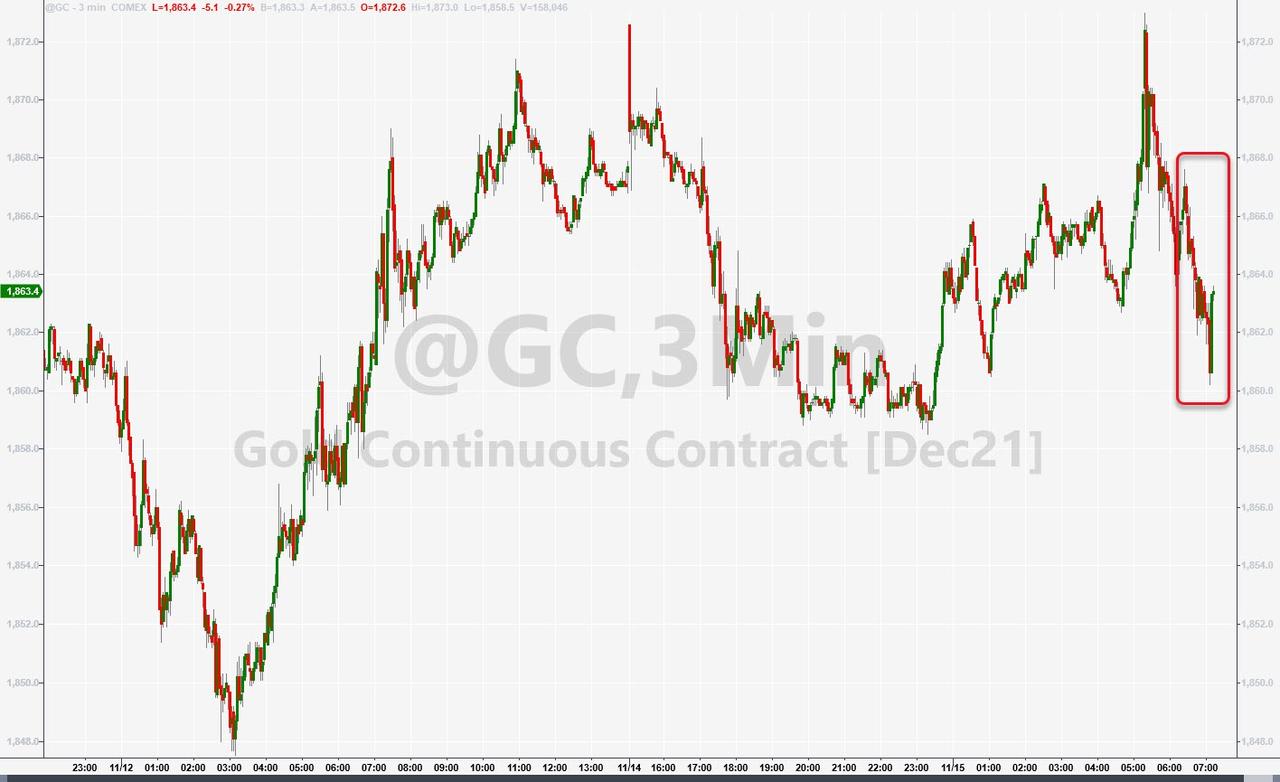
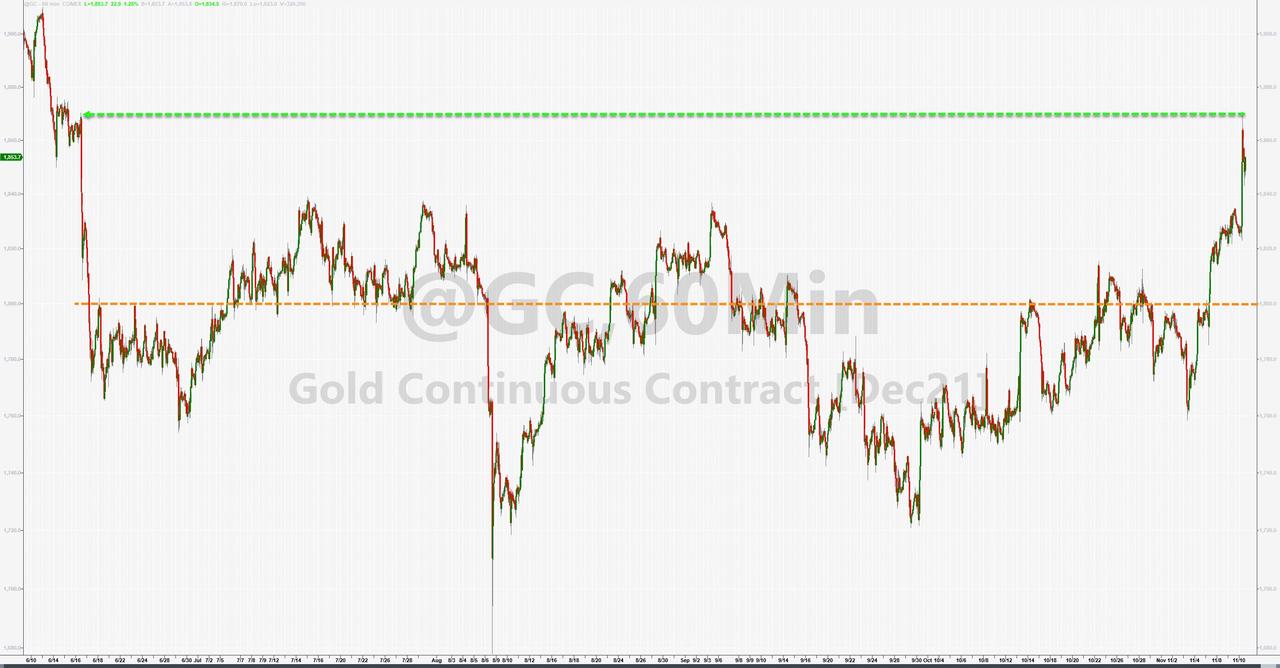
The US Dollar followed suit and touched a level last seen in September. None of these events proved beneficial to gold, so the precious metal slipped 0.79% but managed to successfully defend its $1,800 level.   

Read More

Slipping And Sliding

Ulli Market Commentary Contact

[Chart courtesy of MarketWatch.com]

  1. Moving the markets

One look at the chart above tells the entire story, namely that the markets were aimlessly wandering, as bond yields reversed and spiked, which kept any bullish meme in check. On deck, and awaited with some anxiety, are the quarterly reports from the big box retailers due out later this week.

Inflation remains the elephant in the room and will affect bond prices negatively (higher yields), as various data points and more Fed speak scheduled throughout the week, may push interest rates around, despite the Central Bank’s announcement of their policy going forward.

It’s almost amusing to watch Tesla trade like a penny stock. Down 20% off its highs today, then a sudden mysterious buying ramp, exactly like last week, pushed the stock back up, as ZeroHedge elaborated.

Back to bond yields. The 30-year spiked above the 2% level but stayed below its recent high. Not to be outdone, the US dollar followed suit and gained 0.45% for the session.

Rising yields and a rallying dollar are the recipe for lower gold prices, and that’s what happened today. However, gold’s retreatment of 0.20% was minor and did not disturb its current bullish rebound.

In the end, it was a session during which the major indexes did nothing but tread water.

Read More

ETFs On The Cutline – Updated Through 11/12/2021

Ulli ETFs on the Cutline Contact

Below, please find the latest High-Volume ETF Cutline report, which shows how far above or below their respective long-term trend lines (39-week SMA) my currently tracked ETFs are positioned.

This report covers the HV ETF Master List from Thursday’s StatSheet and includes 312 High Volume ETFs, defined as those with an average daily volume of more than $5 million, of which currently 231 (last week 232) are hovering in bullish territory. The yellow line separates those ETFs that are positioned above their trend line (%M/A) from those that have dropped below it.

Take a look:                                                                   

The HV ETF Master Cutline Report

In case you are not familiar with some of the terminology used in the reports, please read the Glossary of Terms. If you missed the original post about the Cutline approach, you can read it here.

ETF Tracker Newsletter For November 12, 2021

Ulli ETF Tracker Contact

ETF Tracker StatSheet          

You can view the latest version here.

FIRST DOWN WEEK IN SIX

[Chart courtesy of MarketWatch.com]

  1. Moving the markets

After weakness in the markets, we saw a rebound attempt yesterday, which faded into the close, but had the Nasdaq come out ahead with a 0.52% gain. This positive theme travelled through the futures market and creature a bullish opening this morning.

A little sideways bobbing and weaving set up the bullish levitation early in the day but, despite all efforts of, the major indexes closed the week down but finished this Friday on an up note.

All three major indexes posted solid gains, but the Nasdaq with an 1% advance was again the king of the hill. Still, the “hot” inflation numbers of the PPI and CPI continue to weigh on traders’ minds. However, they but now appear to be an accepted fact with the bullish theme remaining the dominant force in the face of questionable economic data.

As ZeroHedge reported, a record number of Americans just quit their jobs, as job openings surpassed unemployed workers by a record 2.8 million:

The number of quits, which for the second month in a row soared to an all-time high, jumping in September by 164K to a record 4.434 million.

As a reminder, this “take this job and shove it” indicator is generally seen as a real-time proxy of how marketable employees think they are, as they tend to quit jobs and look for higher paying occupations when the job market is red hot. And since it tends to lag peaks in job openings modestly, the surge in quits was probably not all that surprising.

We also learned that the Consumer Sentiment survey collapsed to 11-year lows due a surge in inflationary expectations. This is another nail in the coffin of the ridiculous narrative that inflation is “transitory” in nature.

After being closed yesterday for Veteran’s Day, bond yields travelled above their unchanged line with the 10-year adding almost 2 basis points to 1.573%. The US Dollar meandered aimlessly and ended just about unchanged.

Gold jumped above $1,870 this week and had its best day since June, but its potential for more gains is supported by further strength in the CPI during the upcoming months. That is, until inflation expectations become more moderate due to higher interest rates, but this may take a while to materialize.

Why?

Because the Fed will avoid raising rates if it can, because any sudden hike in bond yields, either voluntary or forced by the marketplace, will have a bearish/crashing effect on equities. And we can’t have that, can we?

Read More

Weekly StatSheet For The ETF Tracker Newsletter – Updated Through 11/11/2021

Ulli ETF StatSheet Contact

ETF Data updated through Thursday, November 11, 2021

Methodology/Use of this StatSheet:

1. From the universe of over 1,800 ETFs, I have selected only those with a trading volume of over $5 million per day (HV ETFs), so that liquidity and a small bid/ask spread are assured.

2. Trend Tracking Indexes (TTIs)

Buy or Sell decisions for Domestic and International ETFs (section 1 and 2), are made based on the respective TTI and its position either above or below its long-term M/A (Moving Average). A crossing of the trend line from below accompanied by some staying power above constitutes a “Buy” signal. Conversely, a clear break below the line constitutes a “Sell” signal. Additionally, I use an 8% trailing stop loss on all positions in these categories to control downside risk.

3. All other investment arenas do not have a TTI and should be traded based on the position of the individual ETF relative to its own respective trend line (%M/A). That’s why those signals are referred to as a “Selective Buy.” In other words, if an ETF crosses its own trendline to the upside, a “Buy” signal is generated. Since these areas tend to be more volatile, I recommend a wider trailing sell stop of 8%-10% depending on your risk tolerance.

If you are unfamiliar with some of the terminology, please see Glossary of Terms and new subscriber information in section 9.     

1. DOMESTIC EQUITY ETFs: BUY — since 07/22/2020

Click on chart to enlarge

Our main directional indicator, the Domestic Trend Tracking Index (TTI-green line in the above chart) has now rallied above its long-term trend line (red) by +8.04% and remains in “BUY” mode as posted.

Read More

Spiraling CPI Handcuffs Equities

Ulli Market Commentary Contact

[Chart courtesy of MarketWatch.com]

  1. Moving the markets

Following yesterday’s eye-popping Producer Price report, it came as no surprise to me that today’s soaring CPI release confirmed what I have been pouncing on all year, namely that inflation is here is to say and likely will get worse.

US Consumer prices soared at their fastest rate in 40 years, as ZH reported, by increasing 6.2% YoY in October, thereby blowing by expectations of 5.9% YoY and accelerating from September’s 5.4% YoY. The Core CPI spiked to its highest since August 1991, which confirms another non-transitory surge in inflation.

Added ZeroHedge:

Real weekly earnings are down 1.6% YoY.

The gap between PPI and CPI continues to run at record highs, meaning either consumers are about to be crushed or margins are going to collapse.

As a result, the markets retreated from their lofty levels, assisted by a spike in bond yields, with the 10-year exploding almost 12 basis points higher to end the session at 1.563%. Traders dumped the high-flying tech sector and rotated into bank stocks and gold, the latter of which closed at 5-month highs.

The precious metal surged and gained 1.27% on the day and is now moving towards the $1,900 level, while the US Dollar rallied almost 1%. It was crunch time on Wall Street, as neither spiking bond yields nor a rising dollar were able to prevent gold from levitating.   

The “clueless comment of the day” award goes to MSNBC, who lectures us as to why the inflation we are seeing is a good thing, as this picture tries to explain.

Go figure…

Read More