
- Moving the markets
The eagerly awaited Fed announcement came and went and contained no surprises. As anticipated, the pandemic bond buying program of $120 billion/month is scheduled to be reduced by $15 billion starting 11/21 presumably due to the economy being strong enough to handle it.
The Fed then gave the bulls the ultimate assist by reiterating that it was in no rush to raise interest rates after finishing the tapering process by the middle of next year. The kicker came with these words:
Inflation is elevated, largely reflecting factors that are expected to be transitory.
Supply and demand imbalances related to the pandemic and the reopening of the economy have contributed to sizable price increases in some sectors.
There you have it. The inflation scenario is still considered to be transitory, a statement that I believe will be proven dead wrong at some point in the future. However, at this moment in time, the markets were pleased and continued their ramp-a-thon into the close.
MarketWatch summed it up this way:
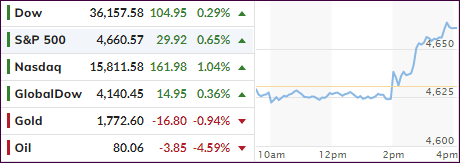
The Dow Jones Industrial Average rose 104 points, after being down more than 160 points earlier in the session and closed at a new record. The S&P 500 traded up 0.65% to a new all-time high. The Nasdaq Composite added 1% and closed at a record. This is the fourth session in a row that all three major averages closed at new highs.
The Russell 2000 rose 1.8% and notched a record close. The small-cap benchmark is up 4.7% this week.
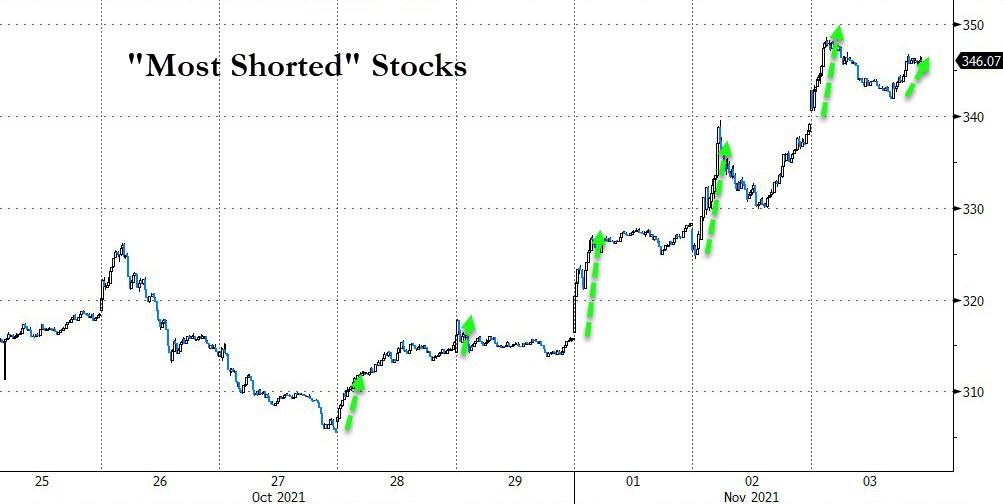
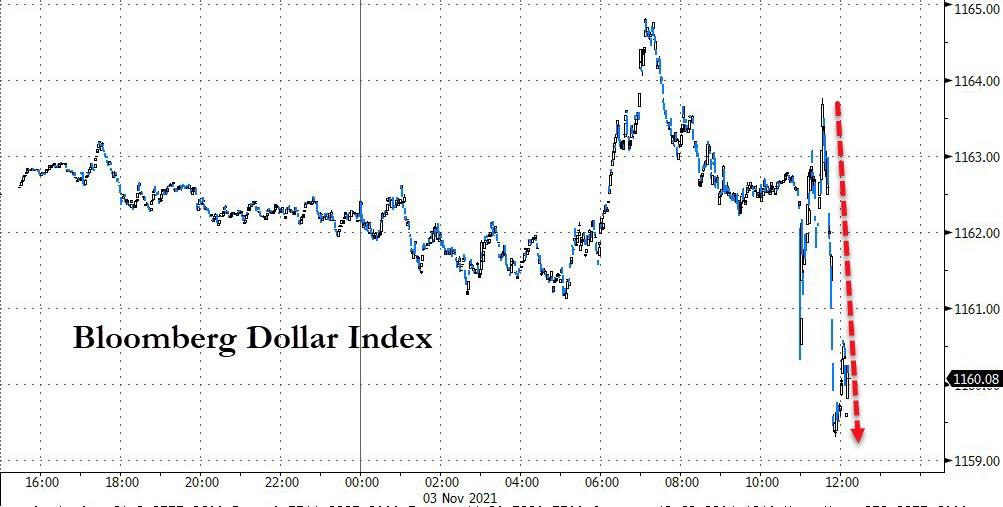
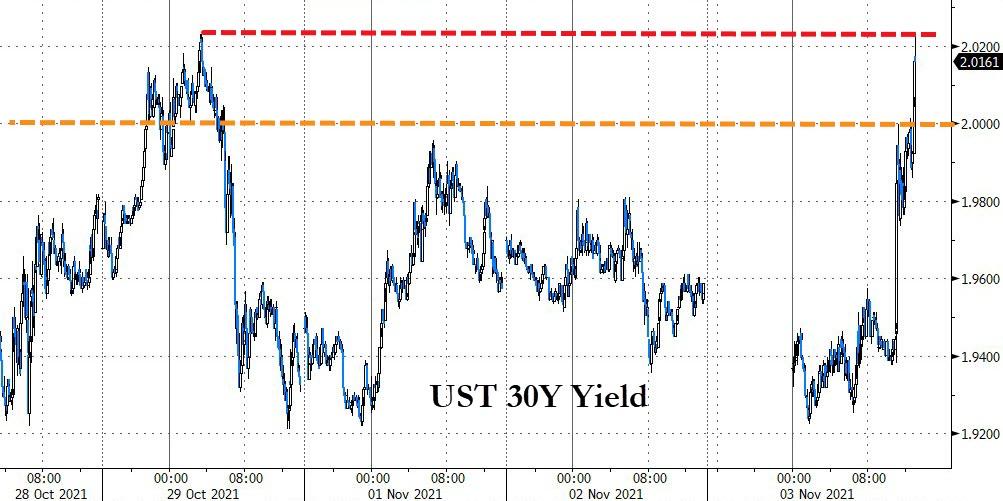
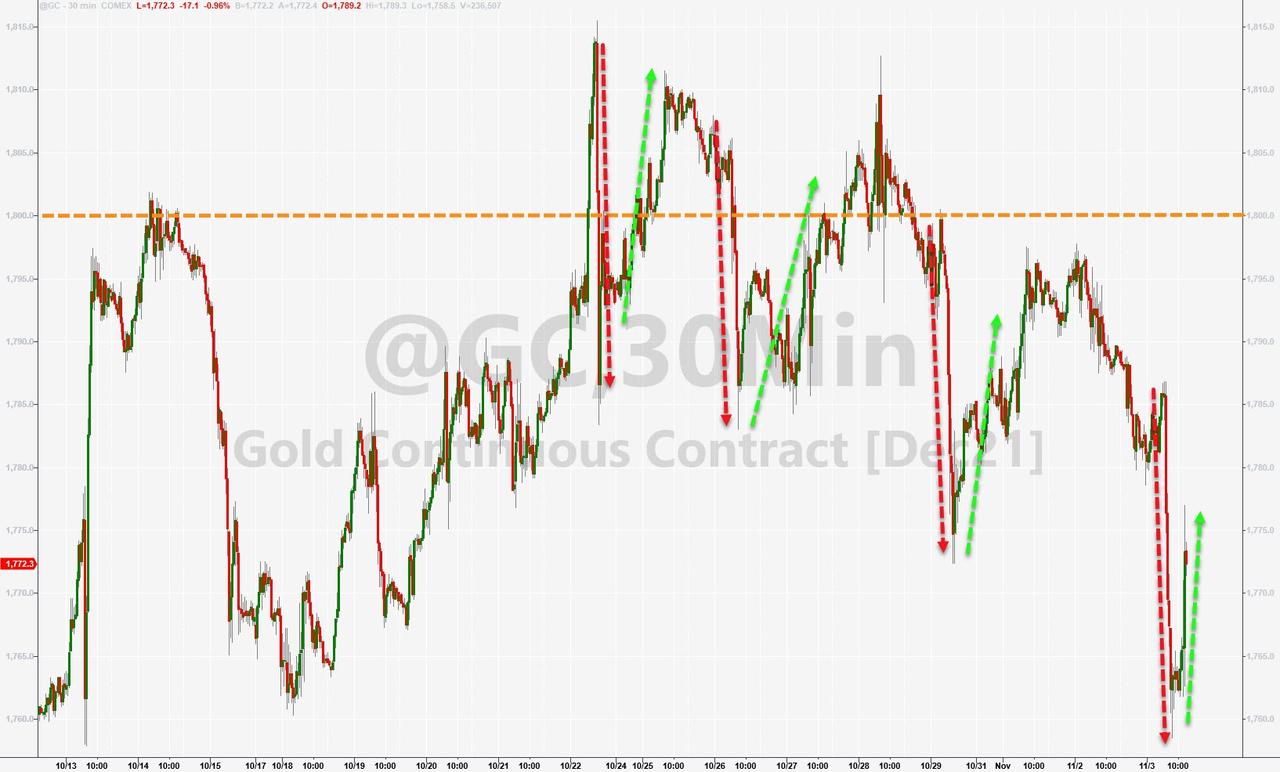
While equities reacted positively, helped by the continued short squeeze, the US Dollar took a dive after a mid-session run up, bond yields spiked with the 30-year piercing the 2% level. Gold rode the roller coaster but ended the session lower despite a last hour rebound attempt.
The fear and greed index shot up a couple of notches from yesterday’s reading.
I will be posting the week-ending commentary tomorrow, Thursday, since I will be out of town on Friday.
2. ETFs in the Spotlight
In case you missed the announcement and description of this section, you can read it here again.
It features some of the 10 broadly diversified domestic and sector ETFs from my HighVolume list as posted every Saturday. Furthermore, they are screened for the lowest MaxDD% number meaning they have been showing better resistance to temporary sell offs than all others over the past year.
The below table simply demonstrates the magnitude with which these ETFs are fluctuating above or below their respective individual trend lines (%+/-M/A). A break below, represented by a negative number, shows weakness, while a break above, represented by a positive percentage, shows strength.
For hundreds of ETF choices, be sure to reference Thursday’s StatSheet.
For this current domestic “Buy” cycle, here’s how some our candidates have fared:
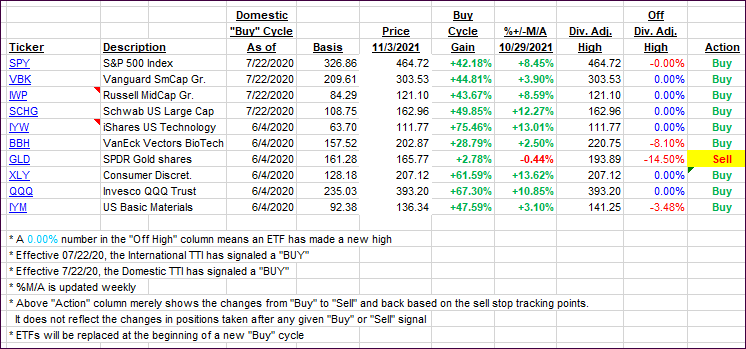
Click image to enlarge.
Again, the %+/-M/A column above shows the position of the various ETFs in relation to their respective long-term trend lines, while the trailing sell stops are being tracked in the “Off High” column. The “Action” column will signal a “Sell” once the -8% point has been taken out in the “Off High” column. For more volatile sector ETFs, the trigger point is -10%.
3. Trend Tracking Indexes (TTIs)
Our TTIs followed the broad market higher.
This is how we closed 11/03/2021:
Domestic TTI: +8.29% above its M/A (prior close +7.66%)—Buy signal effective 07/22/2020.
International TTI: +4.65% above its M/A (prior close +4.26%)—Buy signal effective 07/22/2020.
Disclosure: I am obliged to inform you that I, as well as my advisory clients, own some of the ETFs listed in the above table. Furthermore, they do not represent a specific investment
recommendation for you, they merely show which ETFs from the universe I track are falling within the specified guidelines.
All linked charts above are courtesy of Bloomberg via ZeroHedge.
Contact Ulli