
- Moving the markets
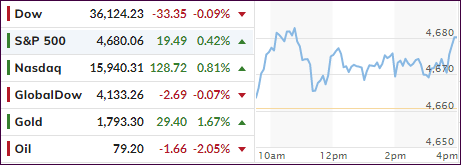
It was another wild ride in the markets with the Dow spending the session in the red yet closing just about unchanged. The S&P 500 and Nasdaq never dropped below their respective unchanged lines and continued their record run with the latter showing more bullish momentum than the former.
The S&P produced its sixth straight win in a row, because of traders having come to terms with the Fed’s taper program, which was taken as a sign of a growing economy that should be able to handle an unwinding of the pandemic stimulus. There was also some relief that this long anticipated move by the Fed had finally become reality and did not produce a surprise.
Regarding data, we learned that US jobless claims totaled 269k for the week, which was not only better than the expected 275k but also amounted to the lowest pandemic-era total. On deck tomorrow is the much-anticipated jobs report with consensus estimates calling for 450k new jobs added.
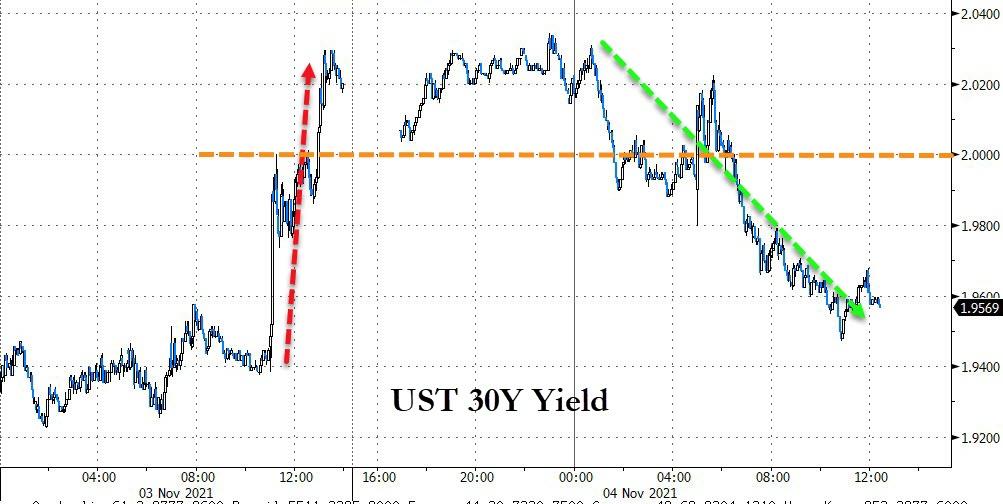
The most shorted stocks did what they are supposed to do, namely head south, which was accomplished today. SmallCaps pumped and dumped but managed to close unchanged. Bond yields gave back most of yesterday’s advances with the 30-year slipping back below the 2% level.
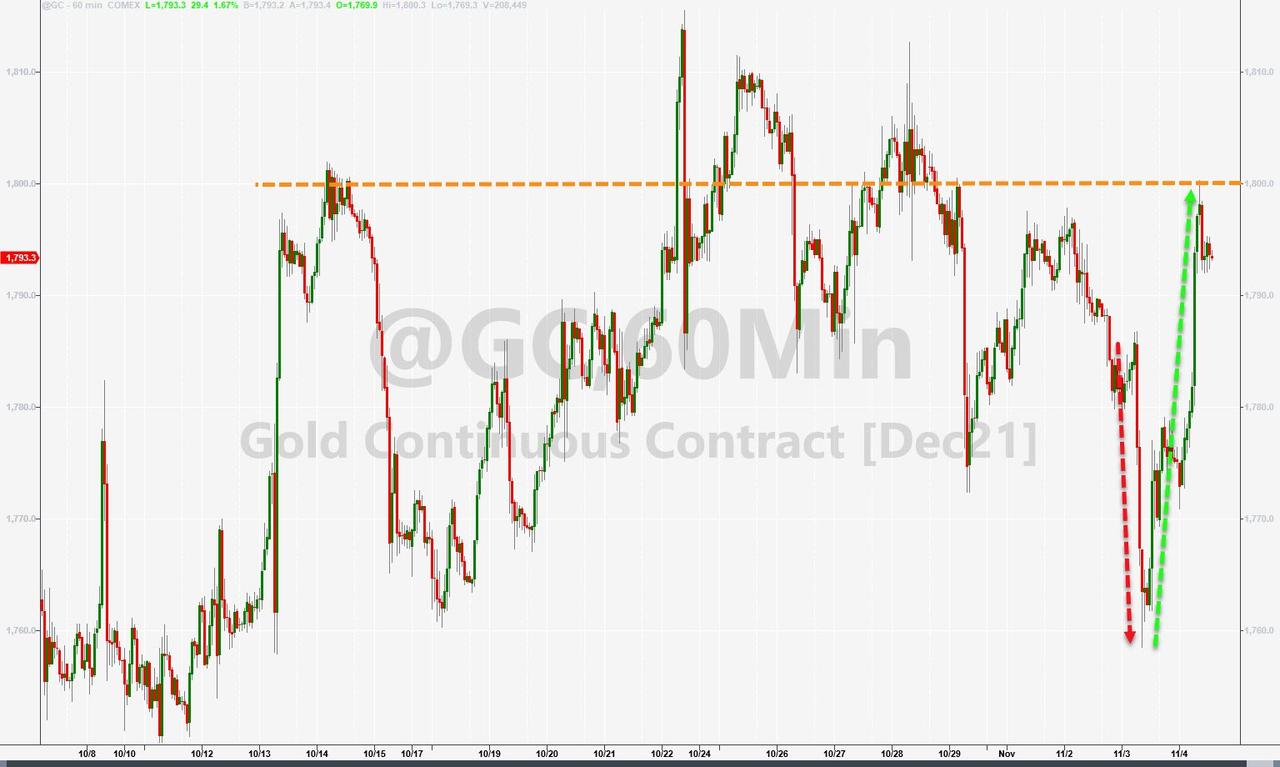
The US Dollar, after tanking yesterday, found some footing and rallied back, in the process gaining 0.49%. Gold seemed to disregard the dollar’s strength and benefited from lower bond yields by rebounding a solid 1.67%, but it was not quite enough to conquer its $1,800 level.
Despite the wild ride, bullish momentum was maintained, which could see even more upside, unless tomorrow’s jobs report turns out to be bad news.
As I mentioned yesterday, I will be out of town tomorrow, so my next market commentary will be posted this coming Monday.
2. ETFs in the Spotlight
In case you missed the announcement and description of this section, you can read it here again.
It features some of the 10 broadly diversified domestic and sector ETFs from my HighVolume list as posted every Saturday. Furthermore, they are screened for the lowest MaxDD% number meaning they have been showing better resistance to temporary sell offs than all others over the past year.
The below table simply demonstrates the magnitude with which these ETFs are fluctuating above or below their respective individual trend lines (%+/-M/A). A break below, represented by a negative number, shows weakness, while a break above, represented by a positive percentage, shows strength.
For hundreds of ETF choices, be sure to reference Thursday’s StatSheet.
For this current domestic “Buy” cycle, here’s how some our candidates have fared:
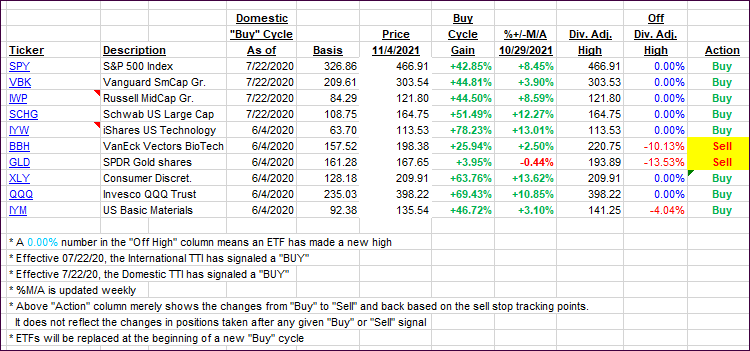
Click image to enlarge.
Again, the %+/-M/A column above shows the position of the various ETFs in relation to their respective long-term trend lines, while the trailing sell stops are being tracked in the “Off High” column. The “Action” column will signal a “Sell” once the -8% point has been taken out in the “Off High” column. For more volatile sector ETFs, the trigger point is -10%.
3. Trend Tracking Indexes (TTIs)
Our TTIs slipped a bit despite the rally in the Dow and S&P 500.
This is how we closed 11/04/2021:
Domestic TTI: +8.07% above its M/A (prior close +8.29%)—Buy signal effective 07/22/2020.
International TTI: +4.47% above its M/A (prior close +4.65%)—Buy signal effective 07/22/2020.
Disclosure: I am obliged to inform you that I, as well as my advisory clients, own some of the ETFs listed in the above table. Furthermore, they do not represent a specific investment
recommendation for you, they merely show which ETFs from the universe I track are falling within the specified guidelines.
All linked charts above are courtesy of Bloomberg via ZeroHedge.
Contact Ulli