Below, please find the latest High-Volume ETF Cutline report, which shows how far above or below their respective long-term trend lines (39-week SMA) my currently tracked ETFs are positioned.
This report covers the HV ETF Master List from Thursday’s StatSheet and includes 312 High Volume ETFs, defined as those with an average daily volume of more than $5 million, of which currently 65 (last week 72) are hovering in bullish territory. The yellow line separates those ETFs that are positioned above their trend line (%M/A) from those that have dropped below it.
In case you are not familiar with some of the terminology used in the reports, please read the Glossary of Terms. If you missed the original post about the Cutline approach, you can read it here.
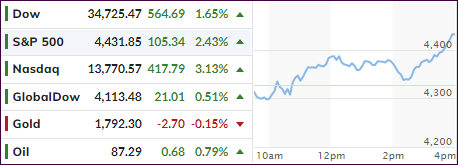
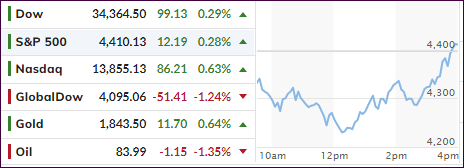
After 3 consecutive weeks of losses, the S&P finally managed to eke out a 0.8% gain, but it was a hard-fought battle with the move to the plus side happening during the last hour of trading today.
Boosting the major indexes was Apple with a 7% advance, while some of the heavy hitters like Microsoft, Amazon and Google finally gave an assist after having been beaten down earlier in the week.
Also helping the bullish cause was month-end pension and mutual fund rebalancing, which ZH estimates to be about $65 billion. This meme may very well come into play again on Monday, the last trading day of the month.
Commented MW about this week’s volatility:
The major indexes have experienced outsized swings each day this week — including the Dow making up a more than 1,000-point intraday deficit to close higher on Monday for the first time ever. The S&P 500 has posted an intraday range of at least 2.25% every day this week, according to Bespoke Investment Group.
Despite today’s rebound, the S&P 500 is on pace for its weakest month since March 2020, while the Nasdaq looks to be hit the hardest by heading for its not only worst month since 2008 but also towards “the worst month of the year of all time.”
ZH expounded further on the reality of what we are witnessing:
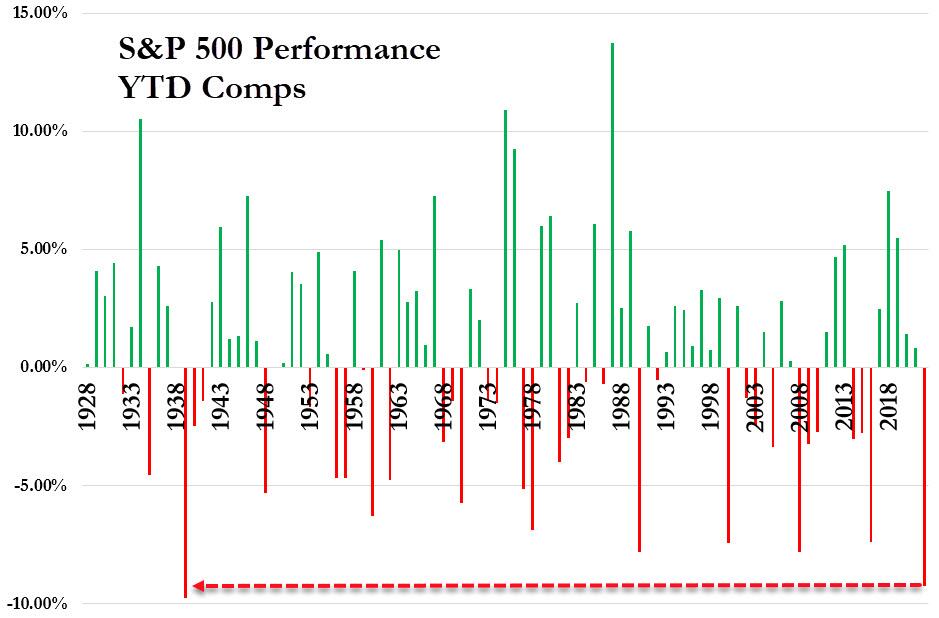
Despite today’s panic-buying, this is the worst start to a year for the S&P 500 since 1939 (and on course for its worst January ever)…
Ouch!
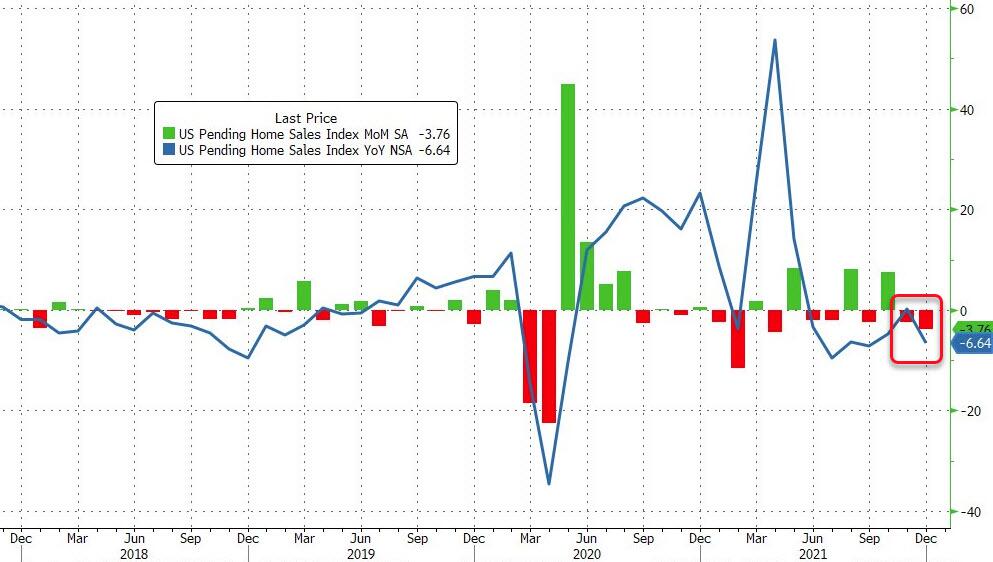
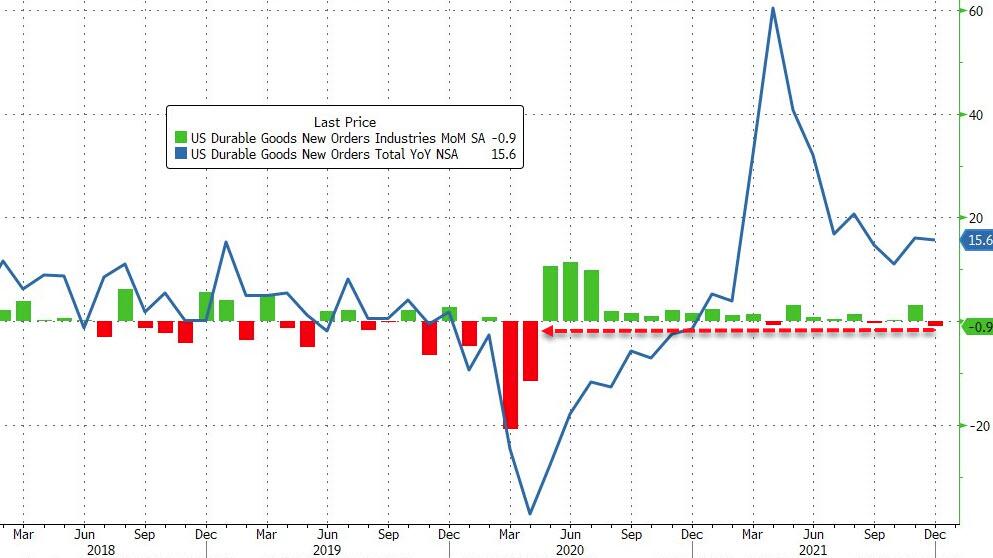
Even though we rebounded into the weekend, the economic environment looks anything but rosy. We saw Pending Home Sales tumbling, likely due to higher mortgage rates, and December US Durable Goods collapsing the most since the beginning of Covid.
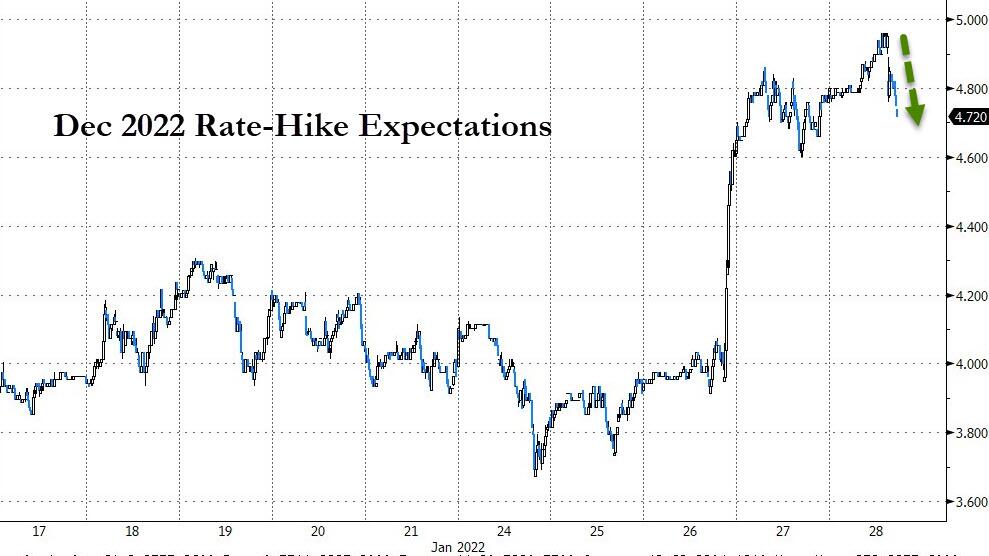
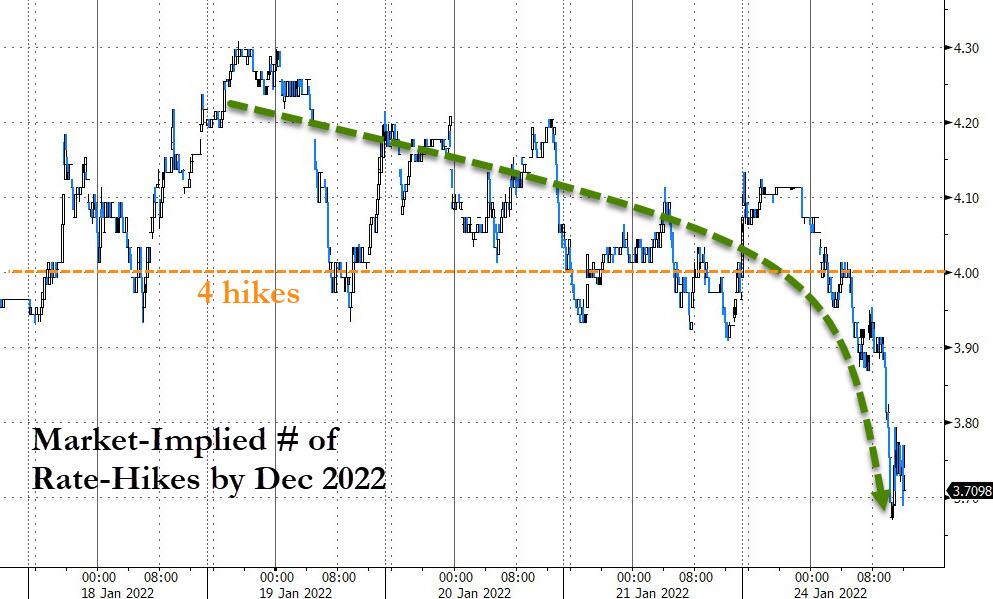
Today, we watched Q1 GDP forecasts puking big time with the Atlanta Fed’s expectations crashing to just about zero, as this chart shows. As a result, the much tracked December 2022 Rate-Hike expectations shifted toward a more dovish mode (fewer hikes), which helped the major indexes to ramp sharply into the close.
Looking at inflation, it seems that the Fed is at a fork in the road between popping the stock market bubble via higher rates or allowing persistent inflation to brutalize the middle and lower class. Depending on their choices, the markets are still at a level where a breakout in either direction is a distinct possibility.
You can see the effect of this month’s madness on our Trend Tracking Indexes (TTIs) in section 3 below.
ETF Data updated through Thursday, January 27, 2022
Methodology/Use of this StatSheet:
1. From the universe of over 1,800 ETFs, I have selected only those with a trading volume of over $5 million per day (HV ETFs), so that liquidity and a small bid/ask spread are assured.
2. Trend Tracking Indexes (TTIs)
Buy or Sell decisions for Domestic and International ETFs (section 1 and 2), are made based on the respective TTI and its position either above or below its long-term M/A (Moving Average). A crossing of the trend line from below accompanied by some staying power above constitutes a “Buy” signal. Conversely, a clear break below the line constitutes a “Sell” signal. Additionally, I use an 12% trailing stop loss on all positions in these categories to control downside risk.
3. All other investment arenas do not have a TTI and should be traded based on the position of the individual ETF relative to its own respective trend line (%M/A). That’s why those signals are referred to as a “Selective Buy.” In other words, if an ETF crosses its own trendline to the upside, a “Buy” signal is generated. Here too, I recommend trailing sell stop of 12%, or less, depending on your risk tolerance.
If you are unfamiliar with some of the terminology, please see Glossary of Termsand new subscriber information in section 9.
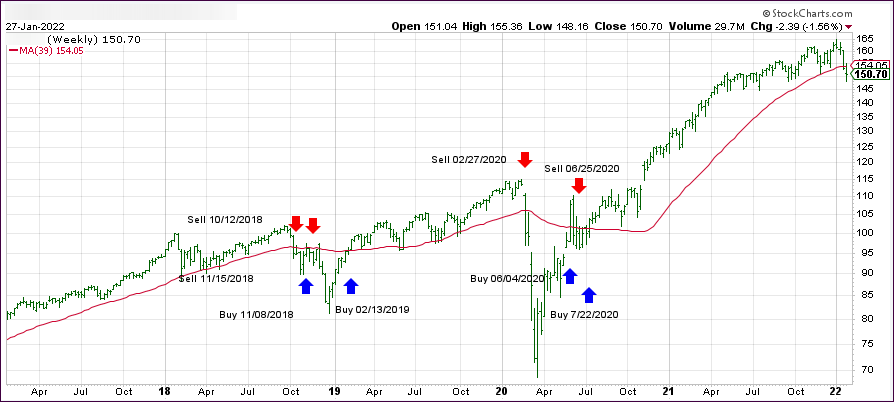
1. DOMESTIC EQUITY ETFs: BUY— since 07/22/2020
Click on chart to enlarge
Our main directional indicator, the Domestic Trend Tracking Index (TTI-green line in the above chart) has now dropped below its long-term trend line (red) by -2.12% and teeters on the edge of losing its “BUY” mode.
An early anticipatory rally bit the dust after the Fed’s announcement that they have plenty of room to raise interest rates before the economy would be negatively affected. The major indexes dove into the red but rebounded into the close.
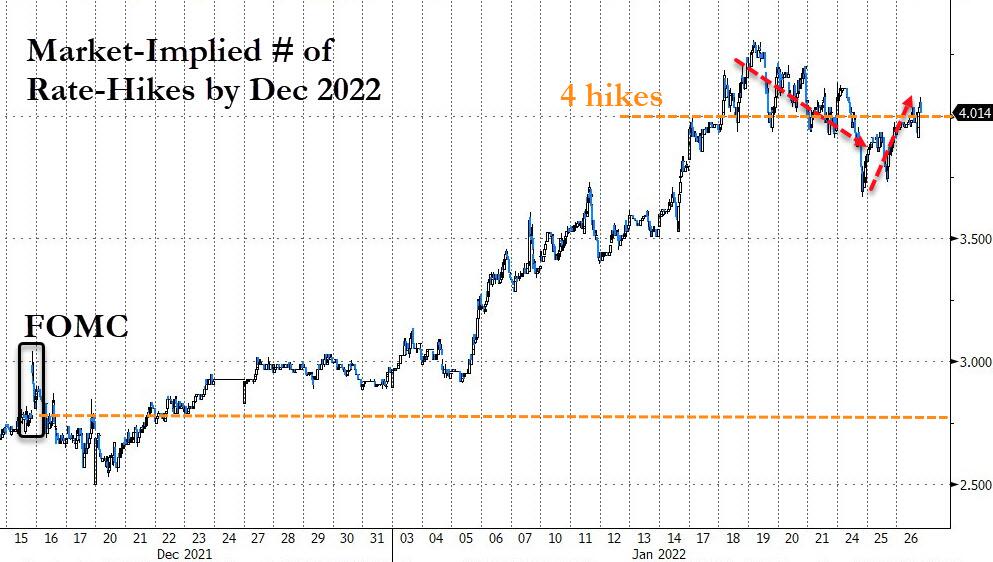
Rate hike expectations soared with traders now considering 4 hikes by year-end to be a real possibility, but the Fed did not lean towards outright hawkishness or dovishness. ZH summed it up like this:
The Fed says it “will soon be appropriate” to raise funds rate.
The Fed says asset-purchases will end in March…
And The Fed says that balance-sheet-shrinking (QT) will start after rate-hikes commence.
The Fed intends primarily to hold Treasuries in the longer run.
Finally, The Fed believes, “overall financial conditions remain accommodative.”
In other words, Fed head Powell walked the tight rope, and in my mind was not hawkish enough in his intent to seriously fight inflation.
Analyst Danielle DiMartino Booth described the Fed’s dilemma most succinctly:
“The Fed’s biggest challenge is figuring out how to implement policy measures that are hawkish enough to lower inflation, but that also keep financial markets afloat, because volatility in financial markets may bleed into an economy that is already showing signs of slowing. The Fed is faced with choosing the lesser of two evils.”
In the end, the Fed statement did not contain any surprises, because an early end to tapering was not announced, and neither was an earlier start to rate hikes. The most feared words that a 50-basis point hike (as opposed 25 bps expected) might be on the agenda did not happen.
However, confusion reigned when Powell released this double speak (hat tip goes to ZH):
“Economy no longer needs sustained high levels of monetary support.”
BUT…
“Of course, the economic outlook remains highly uncertain.”
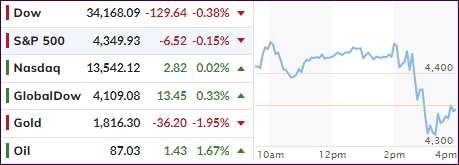
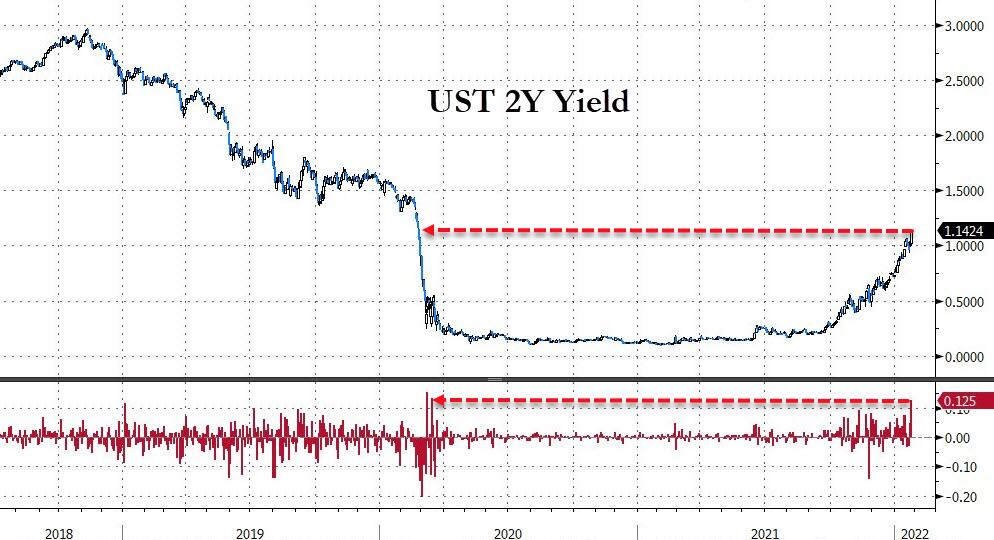
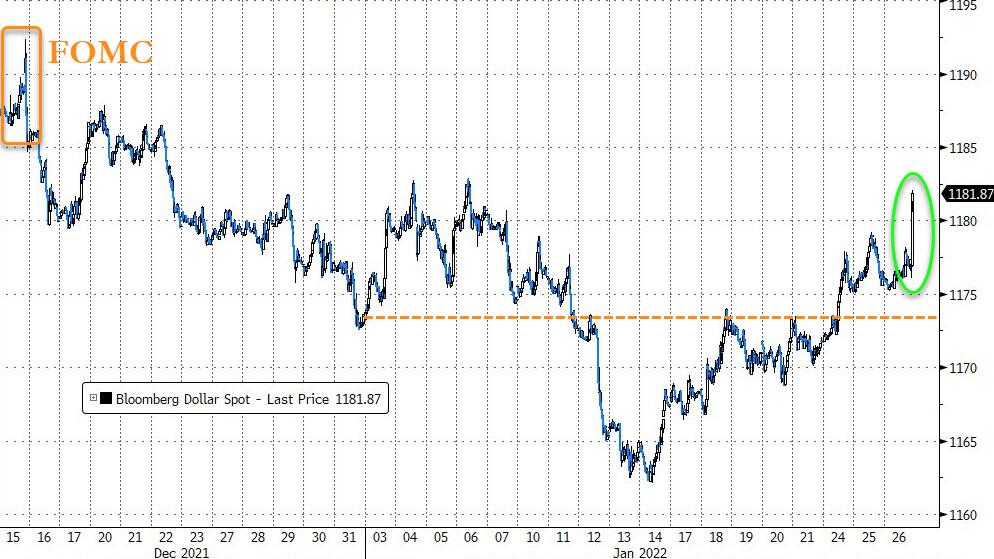
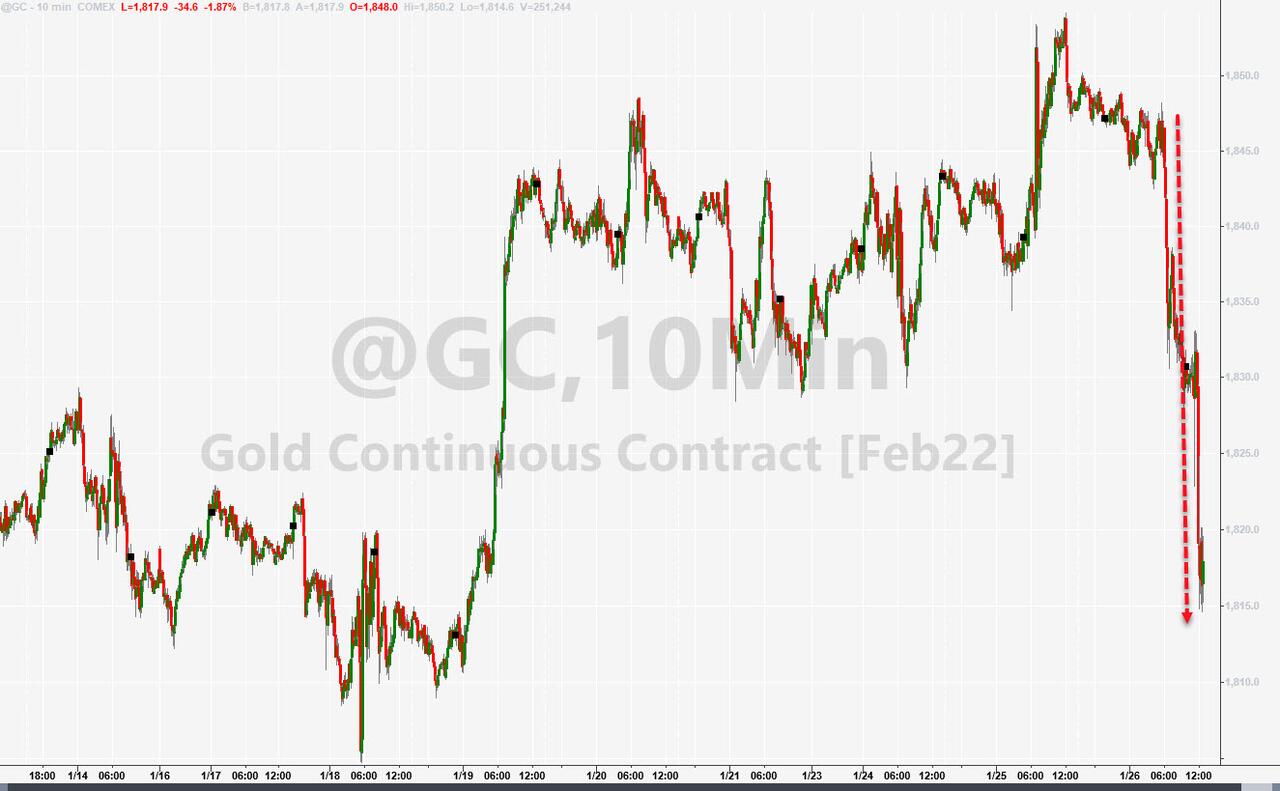
Bond yields spiked, as upcoming rate hikes are now a foregone conclusion with the 2-year ripping higher and scoring its biggest jump since March 2020 causing the US Dollar to surge and almost taking out its highest level for this year. That move took the starch out of gold, and the precious metal surrendered 1.94% but remained above its $1,800 level.
Please see section 3 below for the effect on our Trend Tracking Indexes.
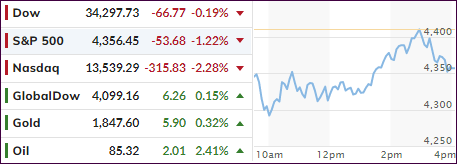
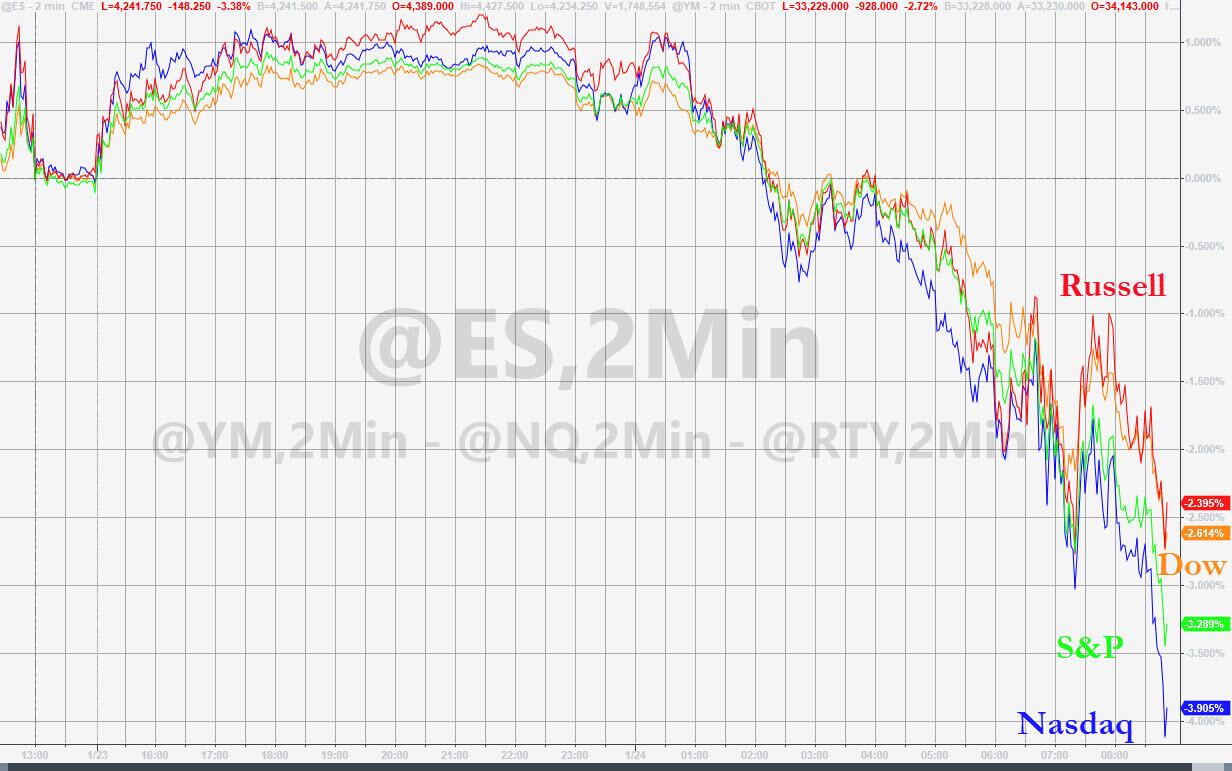
While not nearly as dramatic as yesterday, the major indexes found themselves in another deep hole early on, with the Dow down over 500 points, yet they managed again to stage another rebound which, however, faded into the close.
The Dow almost broke even, but the Nasdaq got hammered again by losing -2.28%, with the S&P 500 in hot pursuit with a -1.22% drop, but worse, the index lost its psychologically important 4,400 level.
In other words, the carnage is still in full swing highlighting again underlying weakness, as the Fed’s attempt to fight inflation, even if only so far with words of tightening, continues to undermine the bullish theme.
The Fed will release its January FOMC meeting notes tomorrow, and it remains to be seen whether the recent market turmoil has convinced the powers to be to “soften” their tone from hawkish to dovish. Those are the expectations, and if they miss, you can be assured that yesterday’s early dump will prove to have been only a warmup exercise.
That means the Fed is caught between a rock and a hard place. Softening their stance will mean inflation could shift into overdrive. However, doing the right thing (in my mind), and preventing inflation (7% CPI) from worsening via higher rates and a reduction of their swollen balance sheet, will pretty much guarantee a crash in the markets.
Or will they be patsies by not committing either way?
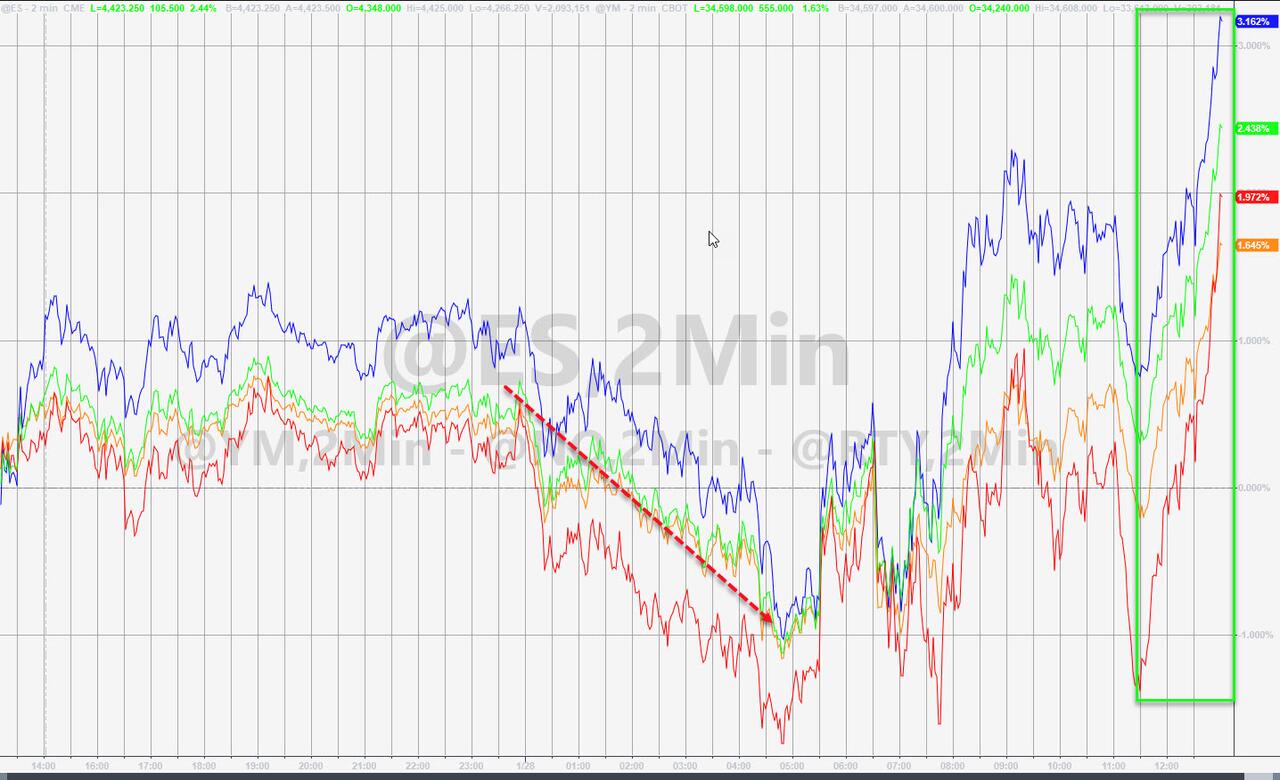
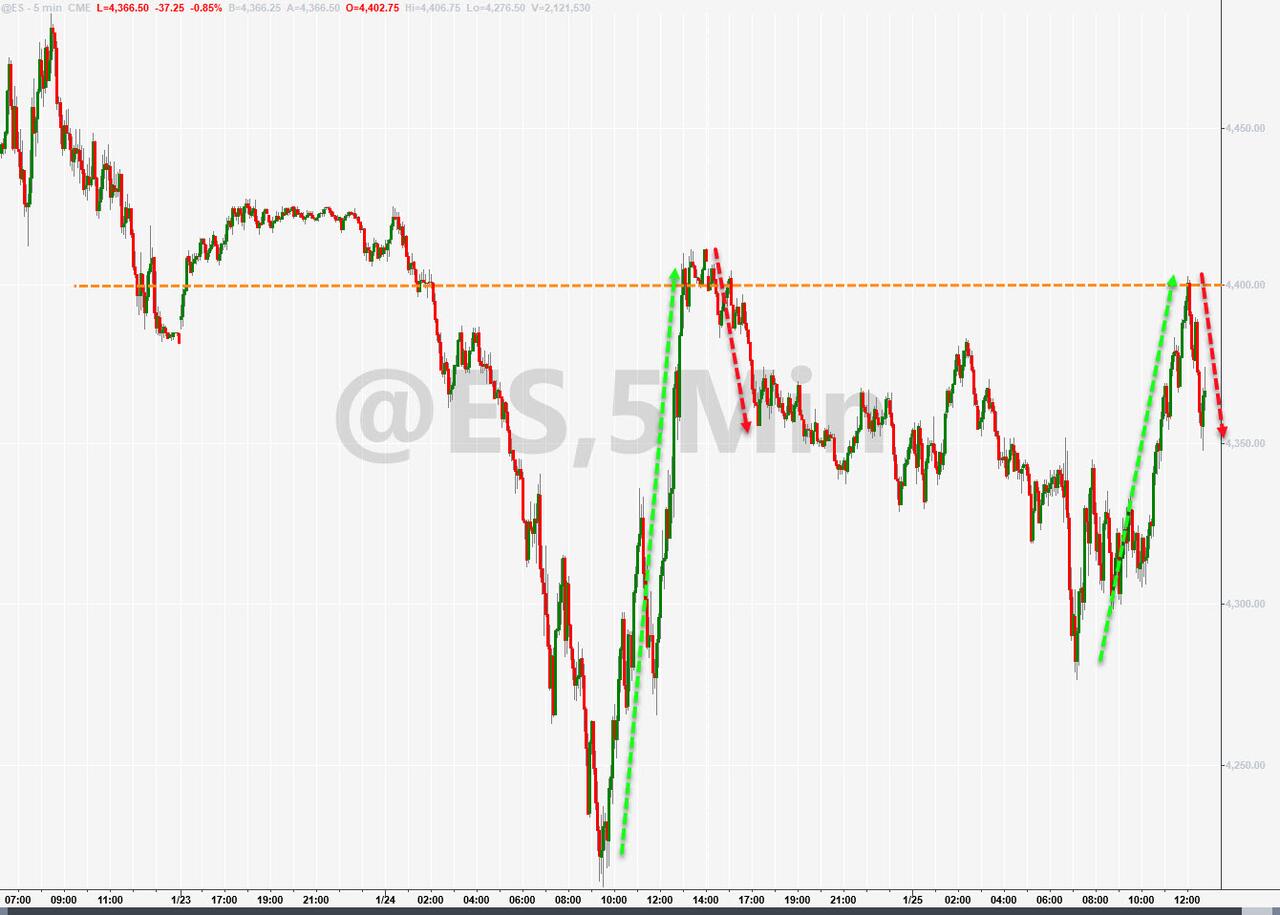
The futures markets last night indicated bullish momentum and a positive beginning in the cash markets. That turned out to be a head fake, as the major indexes collapsed after the opening with the Dow being down some 1,000 points during the session.
I took the opportunity to lighten up on some of our domestic holdings due to our TTI having dipped into the red on Friday. Contributing today’s plunge were mixed corporate earnings and worries about rising interest rates.
While nothing can be done about the former, much can be accomplished with the latter. Worse than expected economic news from the manufacturing and services sector added to concerns that the economy might be rolling over. Traders suddenly had a change of heart in that the Fed’s intended 4 rates hike by the end of this year might not be accomplished.
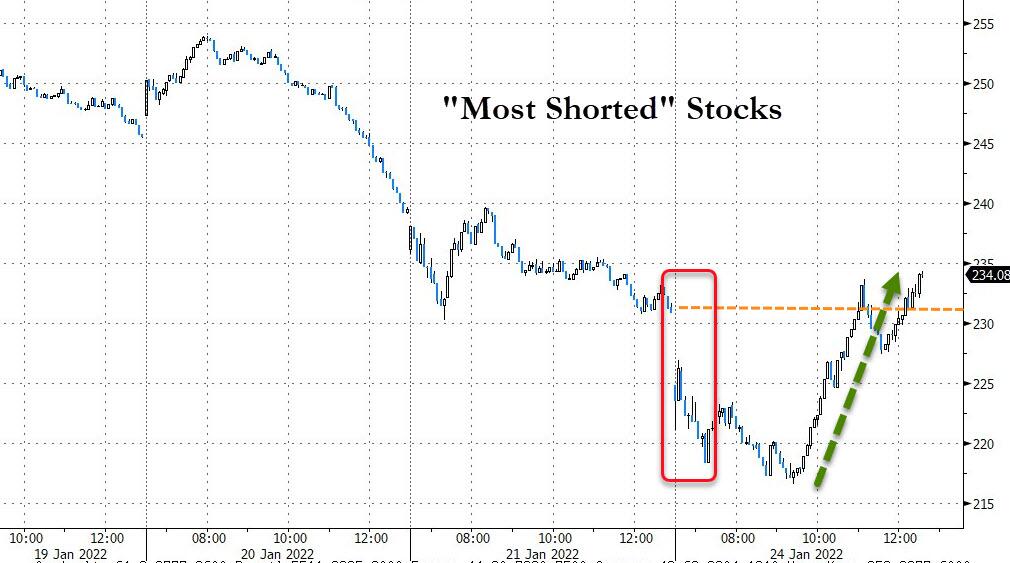
Rate hike fears reversed and suddenly, risk assets were back on the front burner and a slow and steady ramp pulled the major indexes back into the green. It was a comeback based on nothing but hope that the Fed will not follow through with its hawkish policies. Should that turn out not to be the case, we will witness the markets going back into bearish mode.
This stunning comeback, supported by a short squeeze, also pushed our Domestic TTI back above its trend line and into bullish mode—at least for the moment.
Right now, I consider today’s event a whip-saw signal for our Trend Tracking Index (TTI). Should the Fed really cave on Wednesday, by not wanting to raise rates as anticipated, the bulls will have won this round, the rally will likely be back on, and I will work on replacing our closed-out positions.

