
- Moving the markets
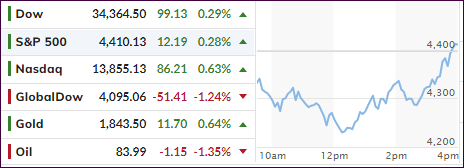
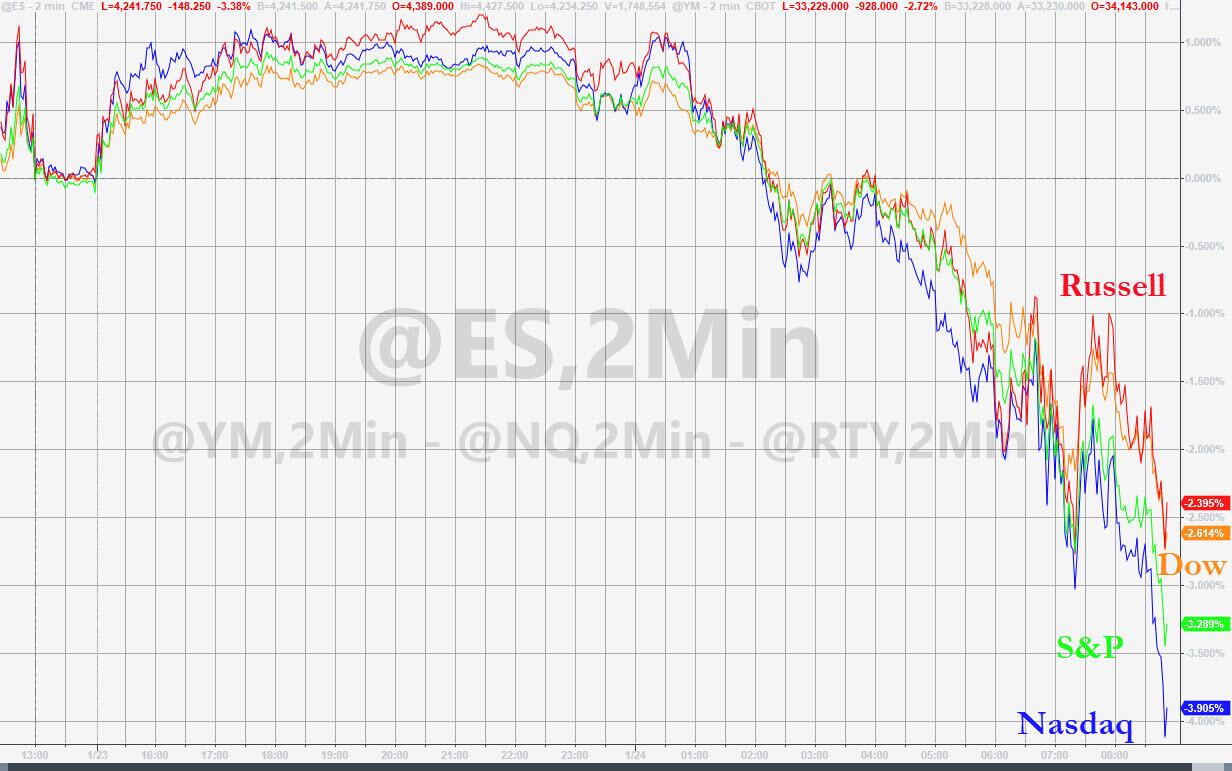
The futures markets last night indicated bullish momentum and a positive beginning in the cash markets. That turned out to be a head fake, as the major indexes collapsed after the opening with the Dow being down some 1,000 points during the session.
I took the opportunity to lighten up on some of our domestic holdings due to our TTI having dipped into the red on Friday. Contributing today’s plunge were mixed corporate earnings and worries about rising interest rates.
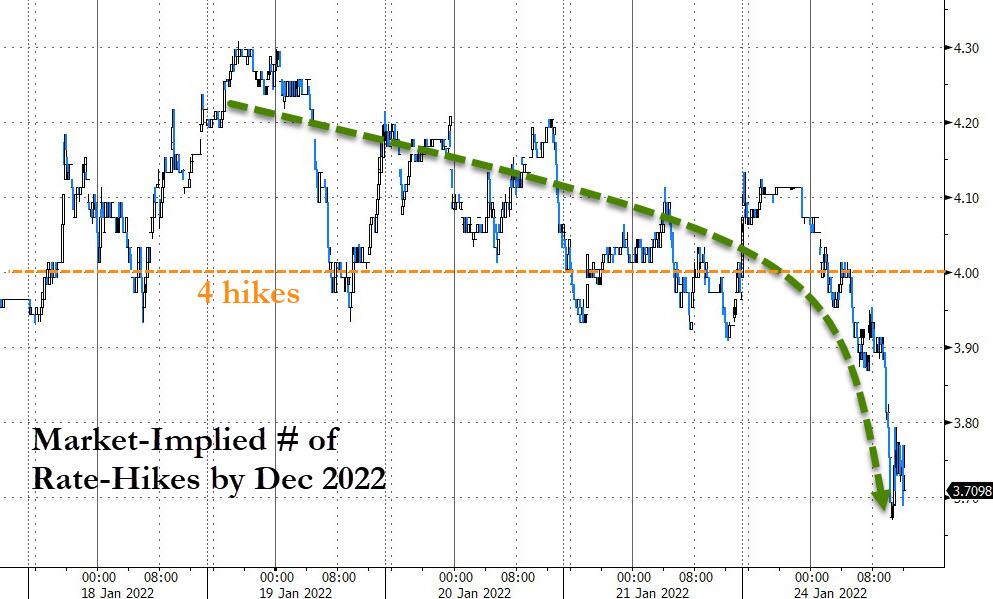
While nothing can be done about the former, much can be accomplished with the latter. Worse than expected economic news from the manufacturing and services sector added to concerns that the economy might be rolling over. Traders suddenly had a change of heart in that the Fed’s intended 4 rates hike by the end of this year might not be accomplished.
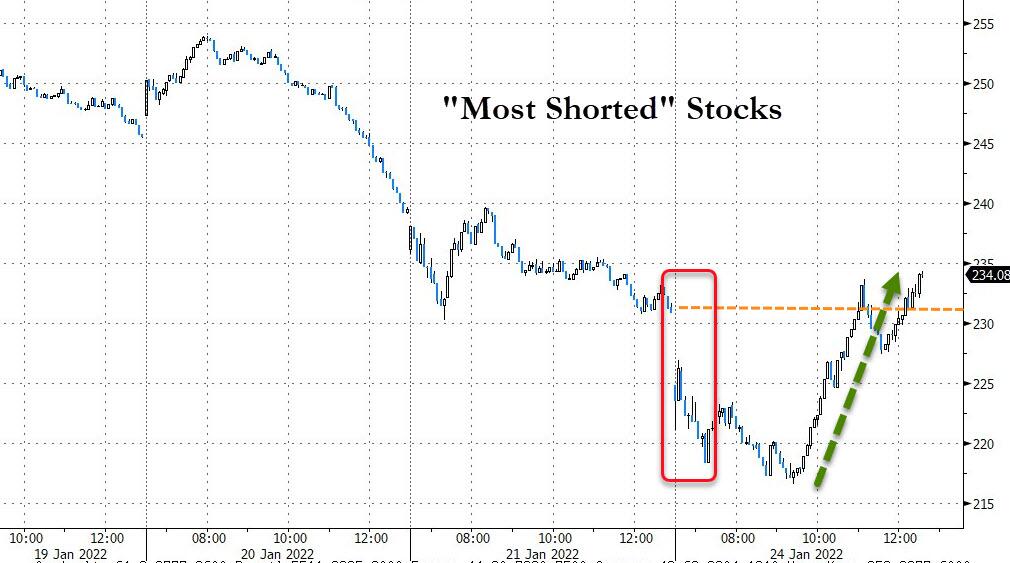
Rate hike fears reversed and suddenly, risk assets were back on the front burner and a slow and steady ramp pulled the major indexes back into the green. It was a comeback based on nothing but hope that the Fed will not follow through with its hawkish policies. Should that turn out not to be the case, we will witness the markets going back into bearish mode.
This stunning comeback, supported by a short squeeze, also pushed our Domestic TTI back above its trend line and into bullish mode—at least for the moment.
Right now, I consider today’s event a whip-saw signal for our Trend Tracking Index (TTI). Should the Fed really cave on Wednesday, by not wanting to raise rates as anticipated, the bulls will have won this round, the rally will likely be back on, and I will work on replacing our closed-out positions.
2. ETFs in the Spotlight
In case you missed the announcement and description of this section, you can read it here again.
It features some of the 10 broadly diversified domestic and sector ETFs from my HighVolume list as posted every Saturday. Furthermore, they are screened for the lowest MaxDD% number meaning they have been showing better resistance to temporary sell offs than all others over the past year.
The below table simply demonstrates the magnitude with which these ETFs are fluctuating above or below their respective individual trend lines (%+/-M/A). A break below, represented by a negative number, shows weakness, while a break above, represented by a positive percentage, shows strength.
For hundreds of ETF choices, be sure to reference Thursday’s StatSheet.
For this current domestic “Buy” cycle, here’s how some of our candidates have fared:

Click image to enlarge.
Again, the %+/-M/A column above shows the position of the various ETFs in relation to their respective long-term trend lines, while the trailing sell stops are being tracked in the “Off High” column. The “Action” column will signal a “Sell” once the -12% point has been taken out in the “Off High” column, which has replaced the prior -8% to -10% limits.
3. Trend Tracking Indexes (TTIs)
Our TTIs joined in the comeback rally with the Domestic one barely crossing the line back to the bullish side. However, we’re still too close to a break down below and will need more confirmation that this bearish dip was nothing but an aberration before adding new holdings.
This is how we closed 01/24/2022:
Domestic TTI: +0.18% above its M/A (prior close -0.57%)—Buy signal effective 07/22/2020.
International TTI: +1.07% above its M/A (prior close +2.31%)—Buy signal effective 07/22/2020.
Disclosure: I am obliged to inform you that I, as well as my advisory clients, own some of the ETFs listed in the above table. Furthermore, they do not represent a specific investment recommendation for you, they merely show which ETFs from the universe I track are falling within the specified guidelines.
All linked charts above are courtesy of Bloomberg via ZeroHedge.
Contact Ulli