
- Moving the markets
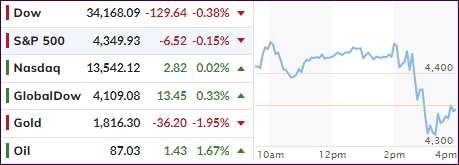
An early anticipatory rally bit the dust after the Fed’s announcement that they have plenty of room to raise interest rates before the economy would be negatively affected. The major indexes dove into the red but rebounded into the close.
Rate hike expectations soared with traders now considering 4 hikes by year-end to be a real possibility, but the Fed did not lean towards outright hawkishness or dovishness. ZH summed it up like this:
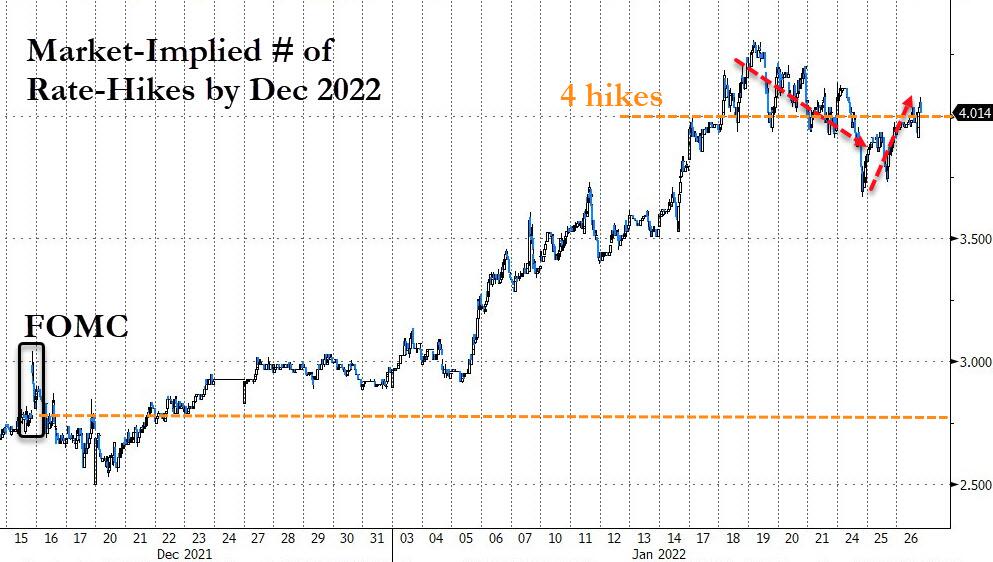
- The Fed says it “will soon be appropriate” to raise funds rate.
- The Fed says asset-purchases will end in March…
- And The Fed says that balance-sheet-shrinking (QT) will start after rate-hikes commence.
- The Fed intends primarily to hold Treasuries in the longer run.
- Finally, The Fed believes, “overall financial conditions remain accommodative.”
In other words, Fed head Powell walked the tight rope, and in my mind was not hawkish enough in his intent to seriously fight inflation.
Analyst Danielle DiMartino Booth described the Fed’s dilemma most succinctly:
“The Fed’s biggest challenge is figuring out how to implement policy measures that are hawkish enough to lower inflation, but that also keep financial markets afloat, because volatility in financial markets may bleed into an economy that is already showing signs of slowing. The Fed is faced with choosing the lesser of two evils.”
In the end, the Fed statement did not contain any surprises, because an early end to tapering was not announced, and neither was an earlier start to rate hikes. The most feared words that a 50-basis point hike (as opposed 25 bps expected) might be on the agenda did not happen.
However, confusion reigned when Powell released this double speak (hat tip goes to ZH):
“Economy no longer needs sustained high levels of monetary support.”
BUT…
“Of course, the economic outlook remains highly uncertain.”
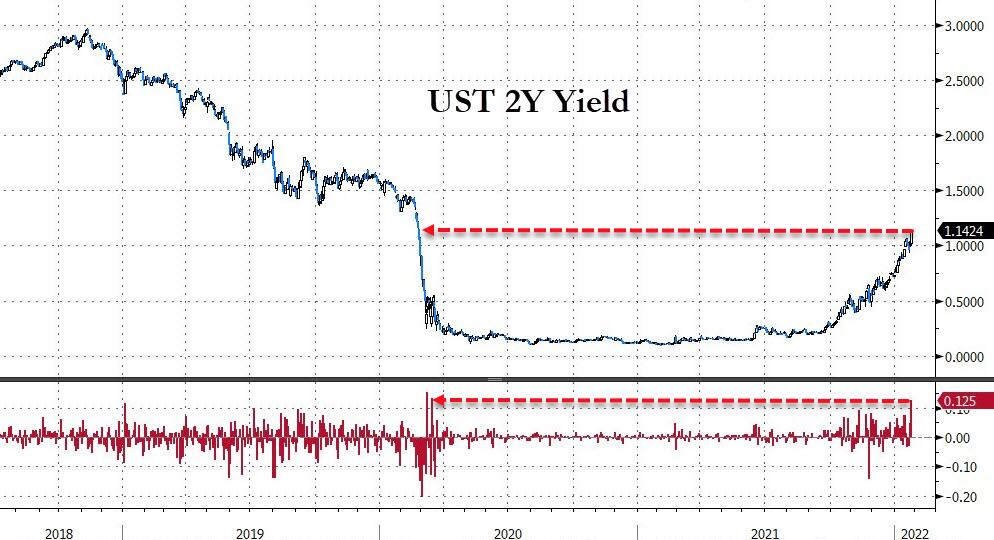
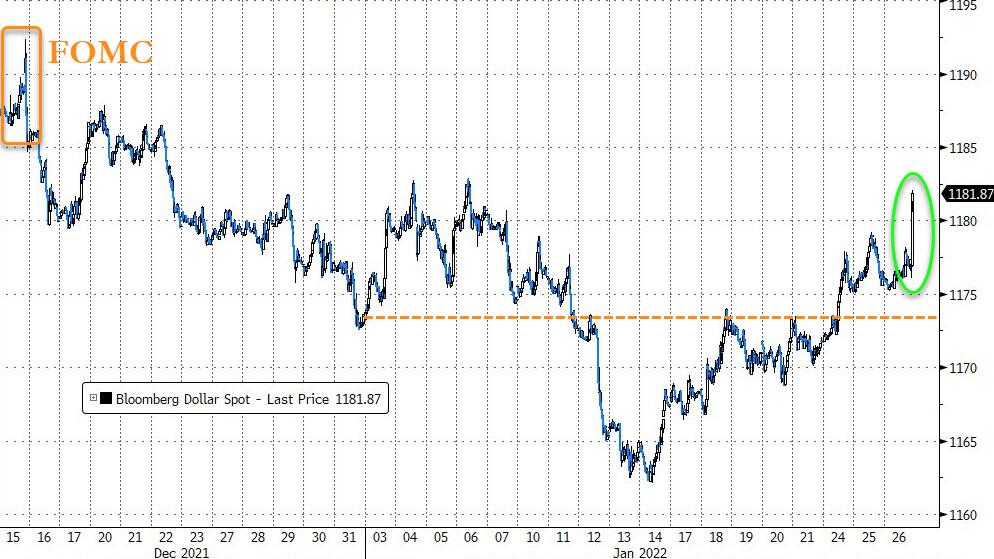
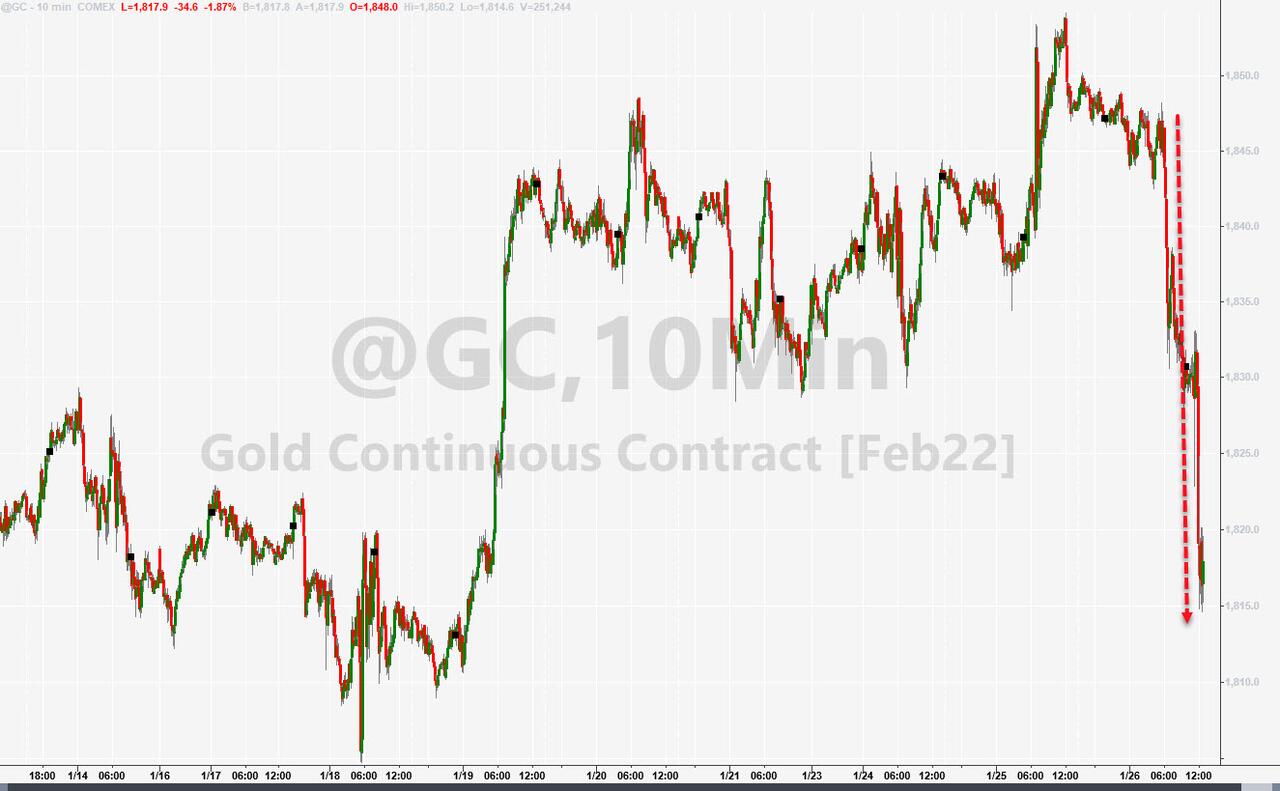
Bond yields spiked, as upcoming rate hikes are now a foregone conclusion with the 2-year ripping higher and scoring its biggest jump since March 2020 causing the US Dollar to surge and almost taking out its highest level for this year. That move took the starch out of gold, and the precious metal surrendered 1.94% but remained above its $1,800 level.
Please see section 3 below for the effect on our Trend Tracking Indexes.
2. ETFs in the Spotlight
In case you missed the announcement and description of this section, you can read it here again.
It features some of the 10 broadly diversified domestic and sector ETFs from my HighVolume list as posted every Saturday. Furthermore, they are screened for the lowest MaxDD% number meaning they have been showing better resistance to temporary sell offs than all others over the past year.
The below table simply demonstrates the magnitude with which these ETFs are fluctuating above or below their respective individual trend lines (%+/-M/A). A break below, represented by a negative number, shows weakness, while a break above, represented by a positive percentage, shows strength.
For hundreds of ETF choices, be sure to reference Thursday’s StatSheet.
For this current domestic “Buy” cycle, here’s how some of our candidates have fared:
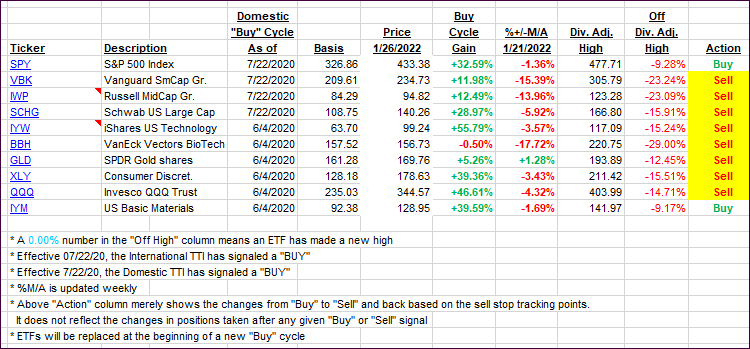
Click image to enlarge.
Again, the %+/-M/A column above shows the position of the various ETFs in relation to their respective long-term trend lines, while the trailing sell stops are being tracked in the “Off High” column. The “Action” column will signal a “Sell” once the -12% point has been taken out in the “Off High” column, which has replaced the prior -8% to -10% limits.
3. Trend Tracking Indexes (TTIs)
Our TTIs again showed some diversion with the International one gaining and the Domestic one dropping deeper into the red. It remains to be seen whether the markets interpret today’s Fed show as a positive, since it contained no surprises.
The Domestic TTI is so closely positioned to its trend line that it will not take much for it to climb back into bullish territory. I will hold off with calling this Buy cycle to be over until I have more clarity in terms of direction. Right now, things could break out either way.
This is how we closed 01/26/2022:
Domestic TTI: -1.57% below its M/A (prior close -0.77%)—Buy signal effective 07/22/2020.
International TTI: +1.41% above its M/A (prior close +1.16%)—Buy signal effective 07/22/2020.
Disclosure: I am obliged to inform you that I, as well as my advisory clients, own some of the ETFs listed in the above table. Furthermore, they do not represent a specific investment recommendation for you, they merely show which ETFs from the universe I track are falling within the specified guidelines.
All linked charts above are courtesy of Bloomberg via ZeroHedge.
Contact Ulli