
- Moving the markets
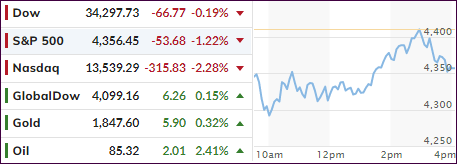
While not nearly as dramatic as yesterday, the major indexes found themselves in another deep hole early on, with the Dow down over 500 points, yet they managed again to stage another rebound which, however, faded into the close.
The Dow almost broke even, but the Nasdaq got hammered again by losing -2.28%, with the S&P 500 in hot pursuit with a -1.22% drop, but worse, the index lost its psychologically important 4,400 level.
In other words, the carnage is still in full swing highlighting again underlying weakness, as the Fed’s attempt to fight inflation, even if only so far with words of tightening, continues to undermine the bullish theme.
The Fed will release its January FOMC meeting notes tomorrow, and it remains to be seen whether the recent market turmoil has convinced the powers to be to “soften” their tone from hawkish to dovish. Those are the expectations, and if they miss, you can be assured that yesterday’s early dump will prove to have been only a warmup exercise.
That means the Fed is caught between a rock and a hard place. Softening their stance will mean inflation could shift into overdrive. However, doing the right thing (in my mind), and preventing inflation (7% CPI) from worsening via higher rates and a reduction of their swollen balance sheet, will pretty much guarantee a crash in the markets.
Or will they be patsies by not committing either way?
We should find out tomorrow.
2. ETFs in the Spotlight
In case you missed the announcement and description of this section, you can read it here again.
It features some of the 10 broadly diversified domestic and sector ETFs from my HighVolume list as posted every Saturday. Furthermore, they are screened for the lowest MaxDD% number meaning they have been showing better resistance to temporary sell offs than all others over the past year.
The below table simply demonstrates the magnitude with which these ETFs are fluctuating above or below their respective individual trend lines (%+/-M/A). A break below, represented by a negative number, shows weakness, while a break above, represented by a positive percentage, shows strength.
For hundreds of ETF choices, be sure to reference Thursday’s StatSheet.
For this current domestic “Buy” cycle, here’s how some of our candidates have fared:

Click image to enlarge.
Again, the %+/-M/A column above shows the position of the various ETFs in relation to their respective long-term trend lines, while the trailing sell stops are being tracked in the “Off High” column. The “Action” column will signal a “Sell” once the -12% point has been taken out in the “Off High” column, which has replaced the prior -8% to -10% limits.
3. Trend Tracking Indexes (TTIs)
Our TTIs went opposite ways with the Domestic one slipping again below its trend line into bearish territory. Because of the reasons stated above, the markets could break sharply either way, so it’s a safer option to have reduced exposure to the markets, as we have right now.
At this moment in time, we are stuck in no man’s land, and I will issue a Sell signal for the domestic arena, once the break below the line has gotten worse and shown some staying power. Should bullish momentum resume, I will look for new exposure.
This is how we closed 01/25/2022:
Domestic TTI: -0.77% below its M/A (prior close +0.18%)—Buy signal effective 07/22/2020.
International TTI: +1.16% above its M/A (prior close +1.07%)—Buy signal effective 07/22/2020.
Disclosure: I am obliged to inform you that I, as well as my advisory clients, own some of the ETFs listed in the above table. Furthermore, they do not represent a specific investment recommendation for you, they merely show which ETFs from the universe I track are falling within the specified guidelines.
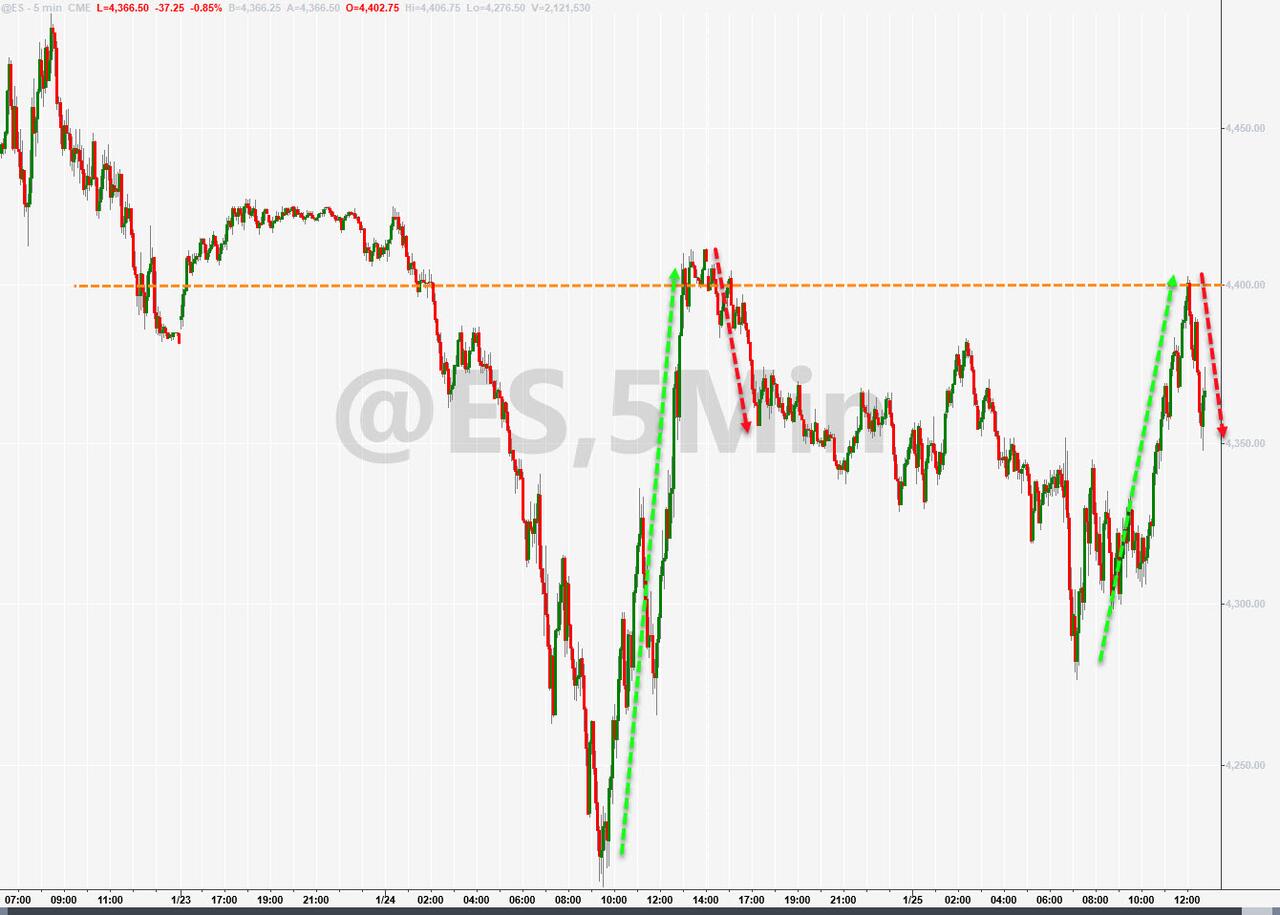
All linked charts above are courtesy of Bloomberg via ZeroHedge.
Contact Ulli