Below, please find the latest High-Volume ETF Cutline report, which shows how far above or below their respective long-term trend lines (39-week SMA) my currently tracked ETFs are positioned.
This report covers the HV ETF Master List from Thursday’s StatSheet and includes 312 High Volume ETFs, defined as those with an average daily volume of more than $5 million, of which currently 72 (last week 172) are hovering in bullish territory. The yellow line separates those ETFs that are positioned above their trend line (%M/A) from those that have dropped below it.
In case you are not familiar with some of the terminology used in the reports, please read the Glossary of Terms. If you missed the original post about the Cutline approach, you can read it here.
It was a wild and whacky holiday shortened week that sent the markets stumbling. The first 3 trading days featured identical results in that early bounces turned into late session trounces, as the major indexes got spanked much to the delight of the bears.
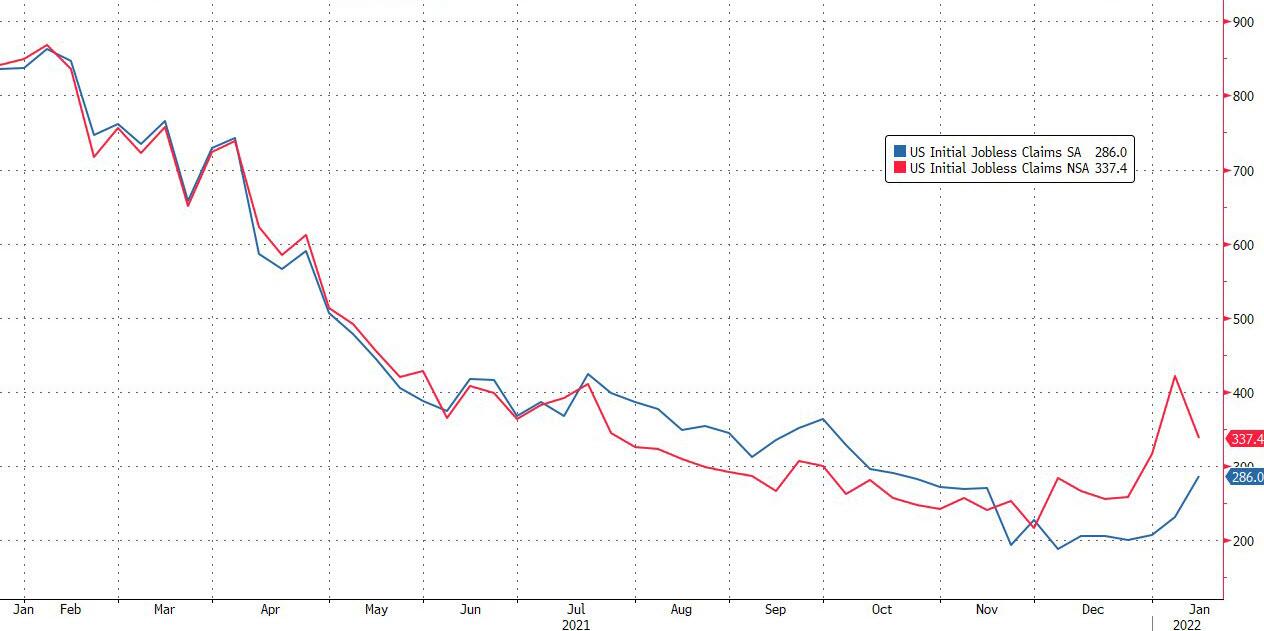
A variety of events combined to thrash any bullish sentiment. Yesterday, we learned that the economy is not all that it’s cracked up to be with Existing Home Sales crashing 4.6% MoM, which was the biggest drop since February 2021. Next up were Initial Jobless claims that unexpectedly surged from 231k to 286k (seasonally adjusted), way off expectations of 225k, and the highest number since October.
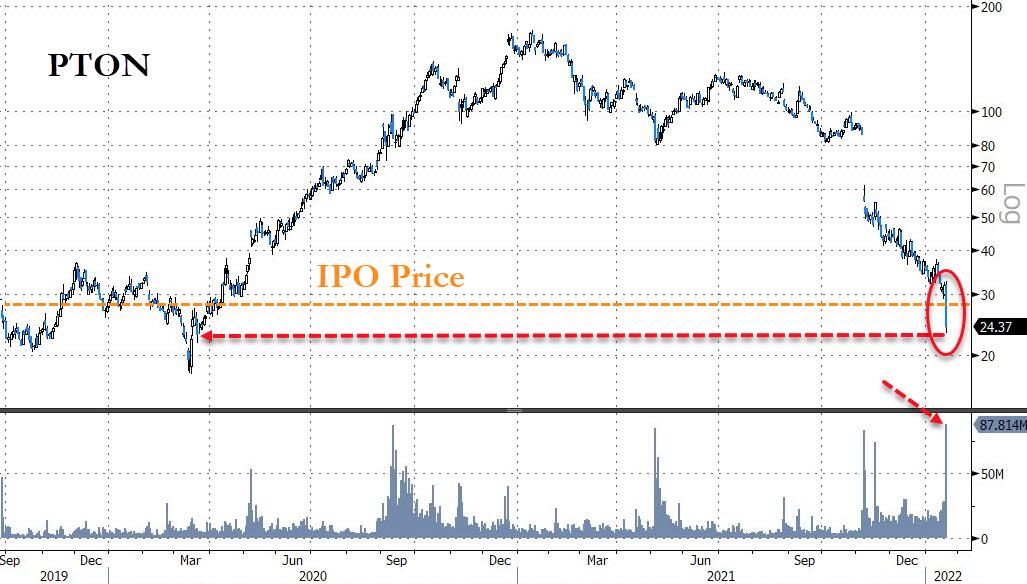
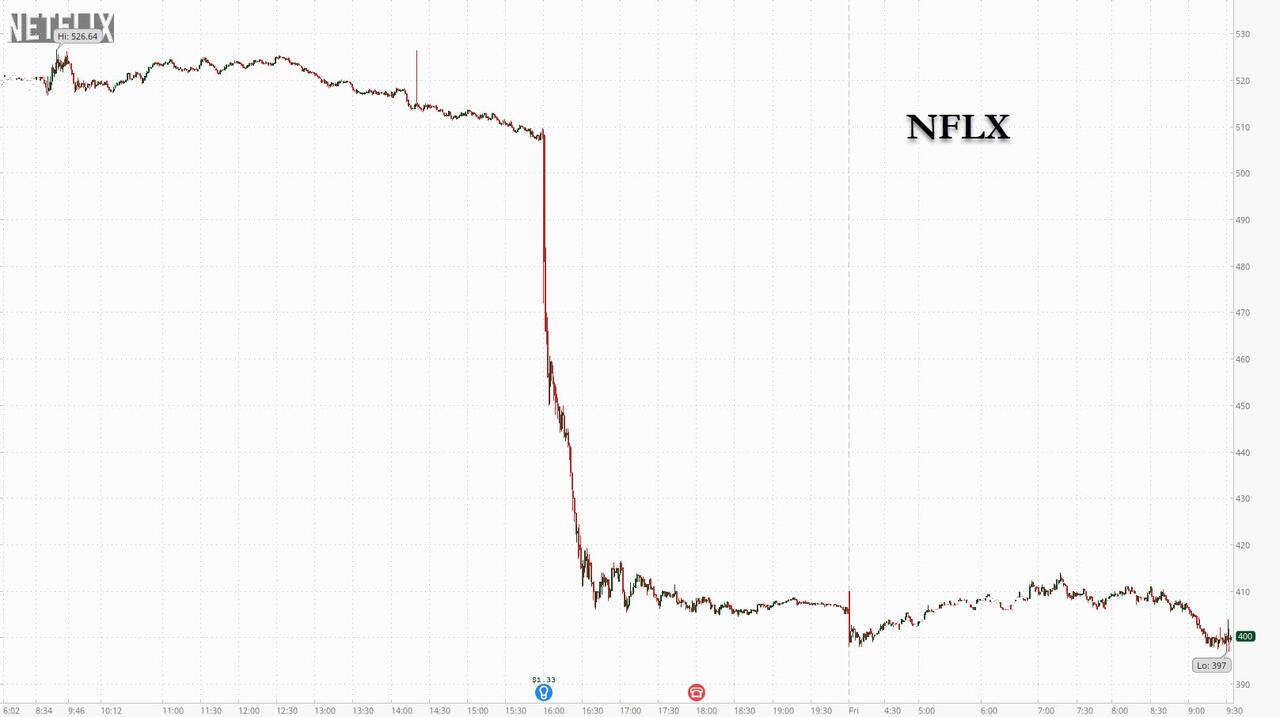
Then we faced poor results from Peloton and Netflix, whose stock prices imploded erasing any hope of a Nasdaq rebound. Ouch! Makes me wonder what the report cards for the other tech stocks will look like.
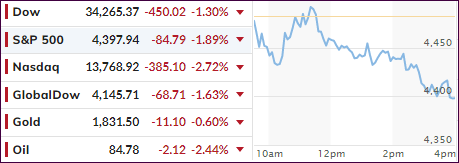
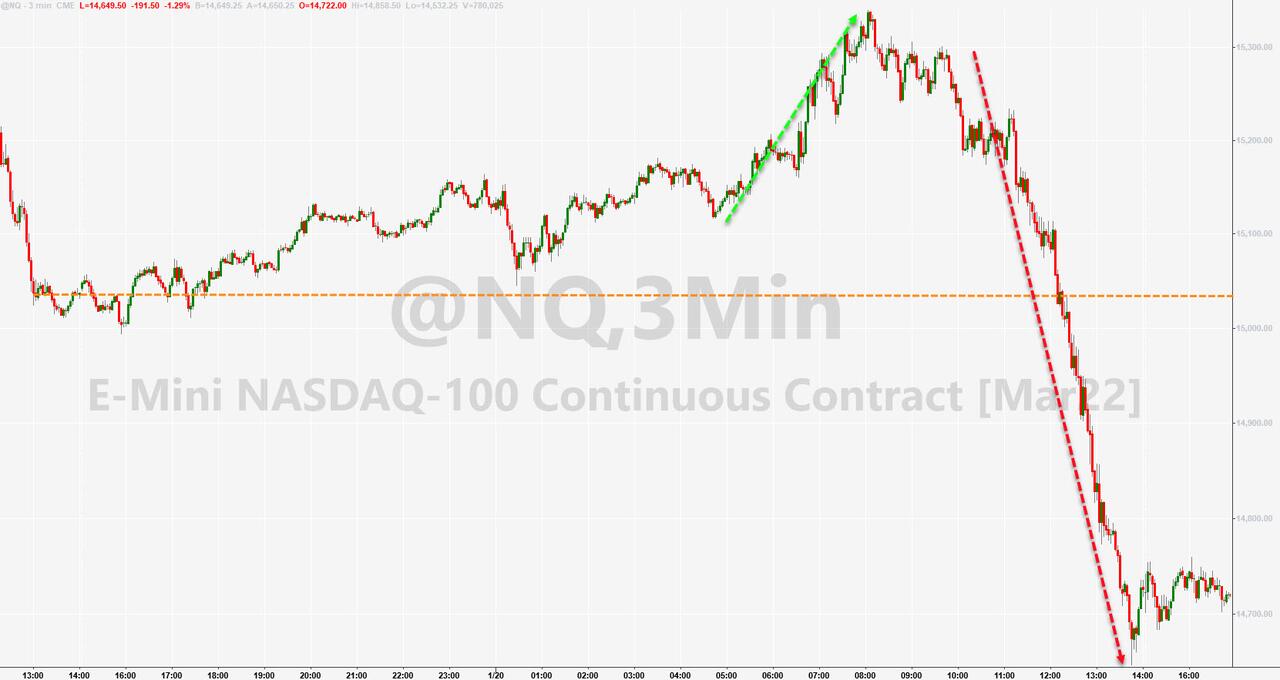
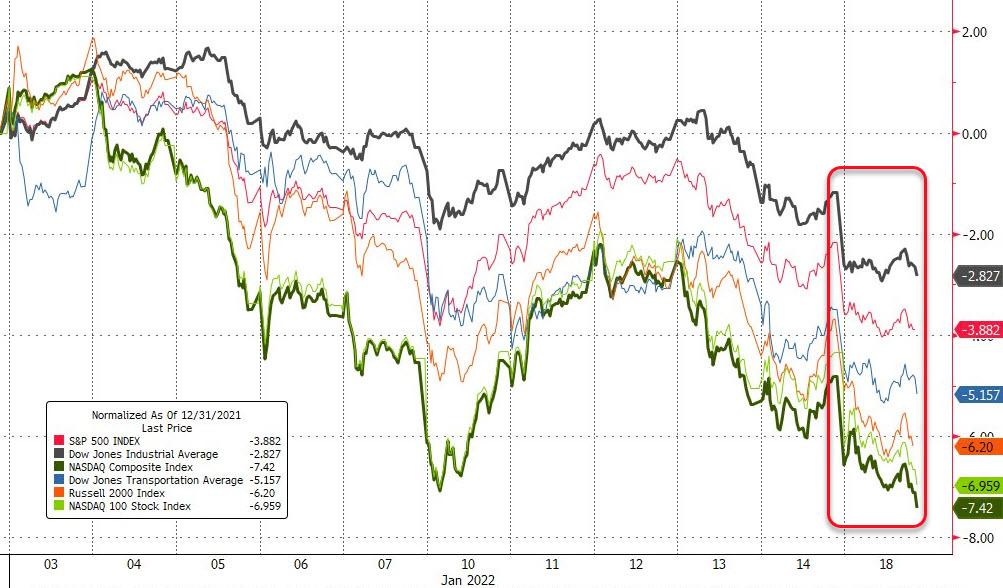
With a whopping $3.3 trillion in options expirations on deck for today’s session, the second largest ever, there were no green numbers to be found, as the major indexes again dove into the close. The Nasdaq led the puke-a-thon with a 2.72% loss despite bond yields trying to give a bullish assist with the 10-year dipping almost 5 basis points to end at 1.764%.
Again, there was no place to hide, as all sectors were taken to the barn and spanked, while both the Dow and S&P 500 closed their third week of losses and their worst weeks since 2020. The Nasdaq is now in correction territory, which means it has come down 14.25% from its November high.
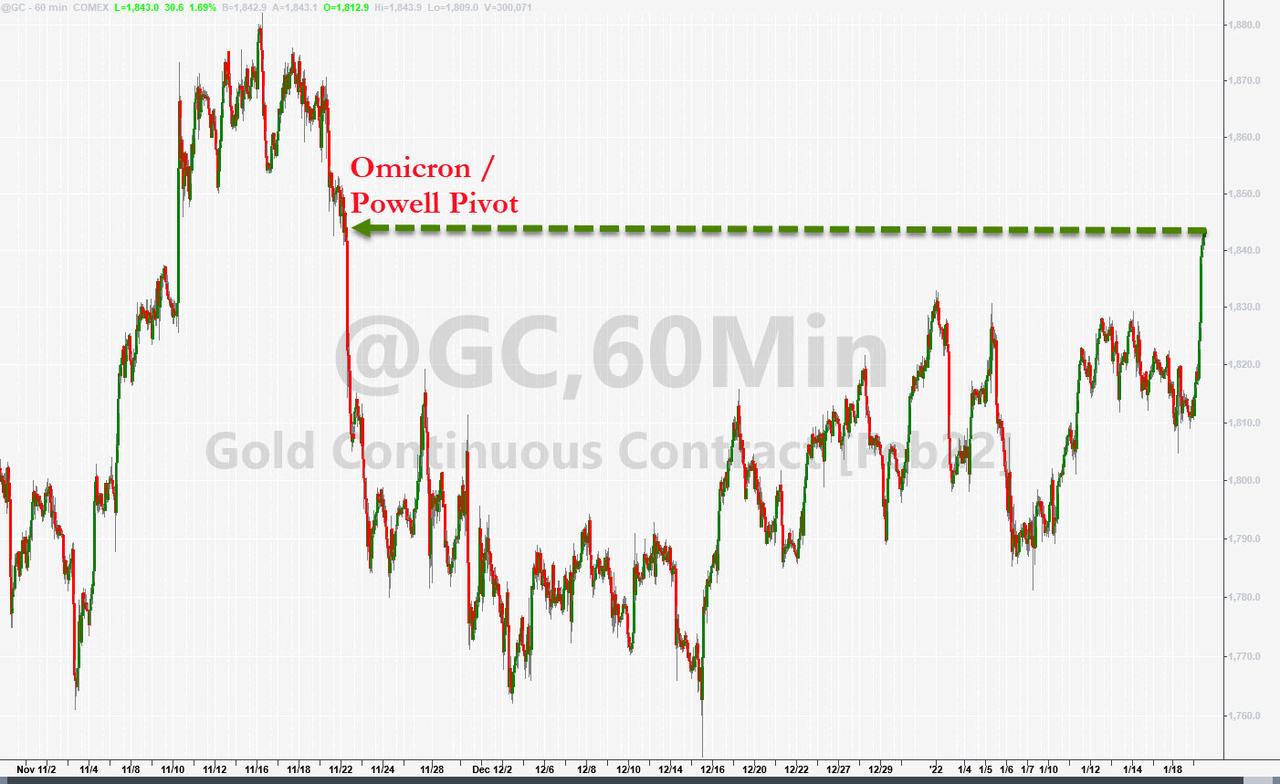
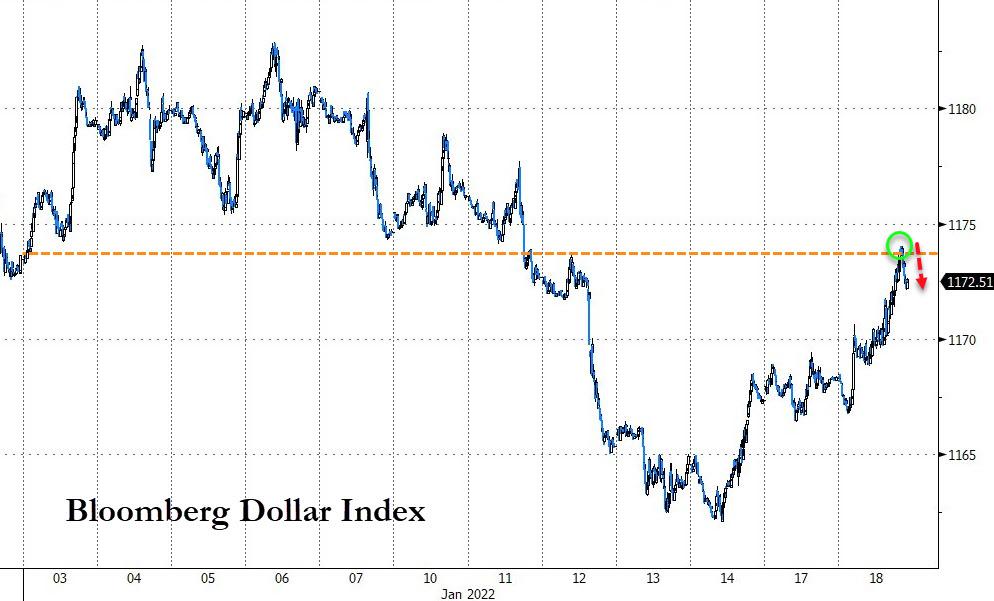
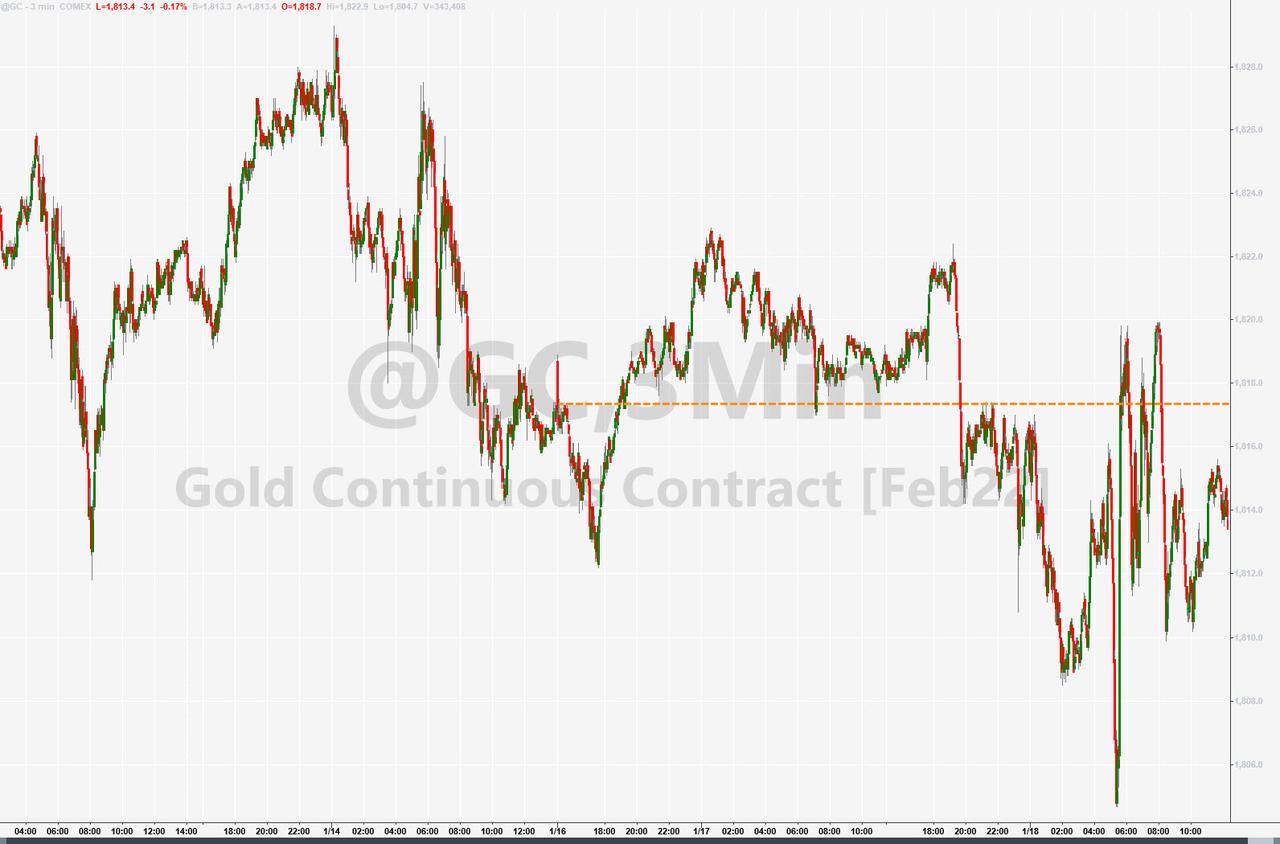
Despite Gold’s modest pullback for the day, the precious metal has now rallied for the 5th week in the last 6 and hanging on above it’s $1,800 level, as ZH pointed out.
Our Trend Tracking Indexes both weakened with the Domestic one now having dipped into bear market territory for the first time since July 2020. Please see section 3 below for details.
What’s next? All eyes are now on Fed head Powell to see whether there is justified hope for him to start placating markets or resuming using his Q4 2018 playbook, which was more tightening followed by market implosions.
Nobody can be sure, but his upcoming policy meeting next Tuesday will likely be the most watched ever and may give some hints as to whether a dovish reversal is in the cards, or if he considers his hawkish inflation fighting policies to be of a higher priority.
ETF Data updated through Thursday, January 20, 2022
Methodology/Use of this StatSheet:
1. From the universe of over 1,800 ETFs, I have selected only those with a trading volume of over $5 million per day (HV ETFs), so that liquidity and a small bid/ask spread are assured.
2. Trend Tracking Indexes (TTIs)
Buy or Sell decisions for Domestic and International ETFs (section 1 and 2), are made based on the respective TTI and its position either above or below its long-term M/A (Moving Average). A crossing of the trend line from below accompanied by some staying power above constitutes a “Buy” signal. Conversely, a clear break below the line constitutes a “Sell” signal. Additionally, I use an 12% trailing stop loss on all positions in these categories to control downside risk.
3. All other investment arenas do not have a TTI and should be traded based on the position of the individual ETF relative to its own respective trend line (%M/A). That’s why those signals are referred to as a “Selective Buy.” In other words, if an ETF crosses its own trendline to the upside, a “Buy” signal is generated. Here too, I recommend trailing sell stop of 12%, or less, depending on your risk tolerance.
If you are unfamiliar with some of the terminology, please see Glossary of Termsand new subscriber information in section 9.
1. DOMESTIC EQUITY ETFs: BUY— since 07/22/2020
Click on chart to enlarge
Our main directional indicator, the Domestic Trend Tracking Index (TTI-green line in the above chart) has now rallied above its long-term trend line (red) by +1.02% and remains in “BUY” mode as posted.
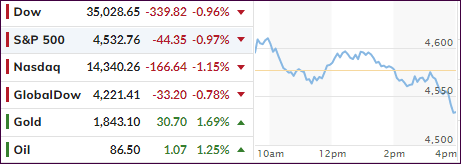
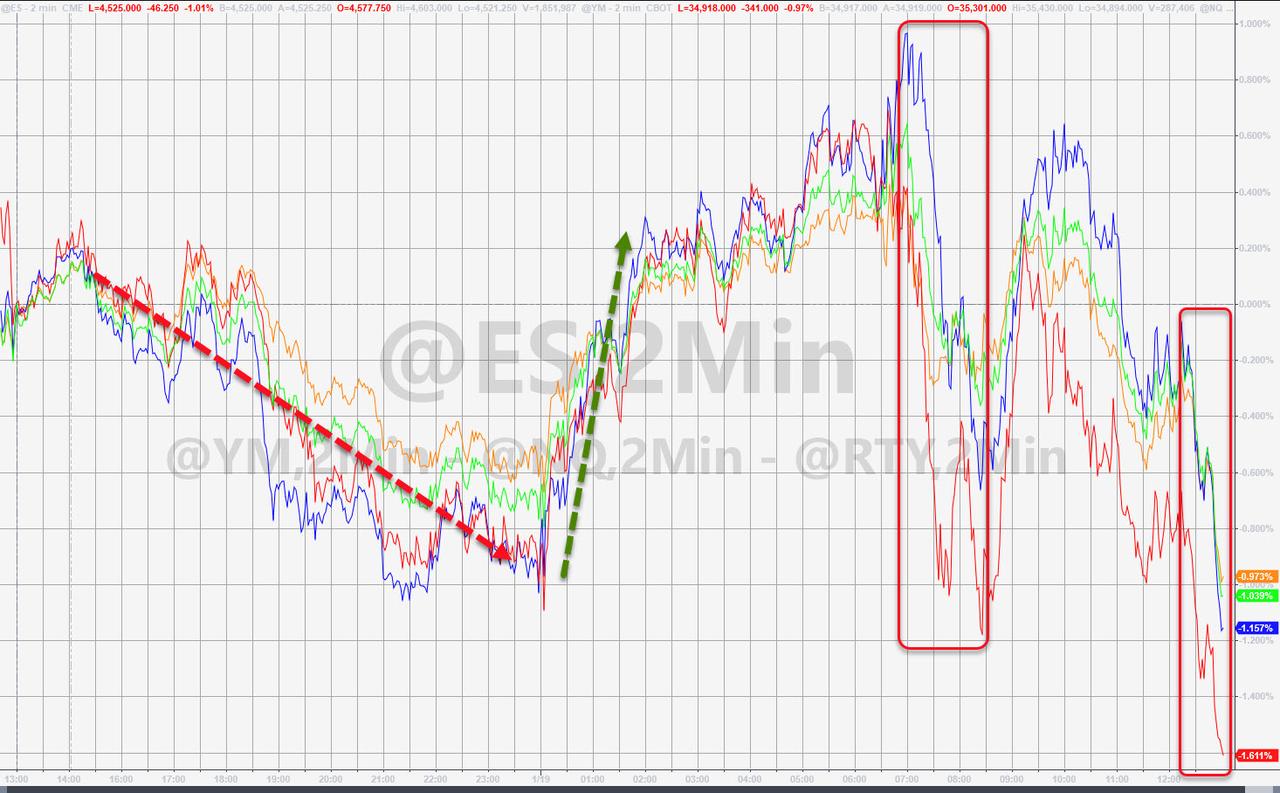
A solid early bounce in the major indexes hit the skids, found upward impetus for a second time but then lost momentum with all three major indexes doing their best imitation of a swan dive by closing at the lows of the day.
It turned into another disappointing day for the dip buyers, as the midday pullback proved to have not enough support to justify taking new positions therefore handing the bears their second win in a row.
With today’s loss, the Nasdaq has now slipped into correction territory, which means a drop of 10% from its record high scored in November. As I posted yesterday, I ended up liquidating one or our positions, which had lately produced nothing but aimless meandering with a bent towards bearishness.
MarketWatch accurately described the current state of the market this way:
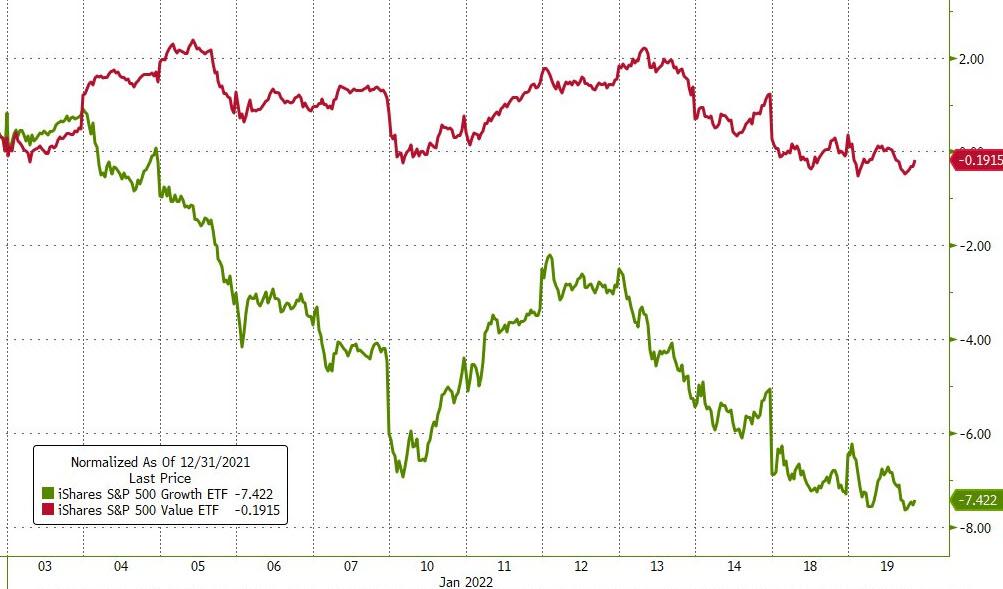
Nasdaq’s pullback from its November high has been led by growth stocks whose valuations ballooned during the pandemic. Shares of Peloton are off more than 80% from their highs. Zoom Video has shed more than 70%. Moderna, DocuSign and PayPal are all down more than 40% from their highs.
This is not surprising, as higher bond yields and generally tighter financial conditions always lead to weakness in those sectors which have superbly benefited by the Fed’s largesse over the past decade. So, it came as no surprise that “value” outperformed “growth.”
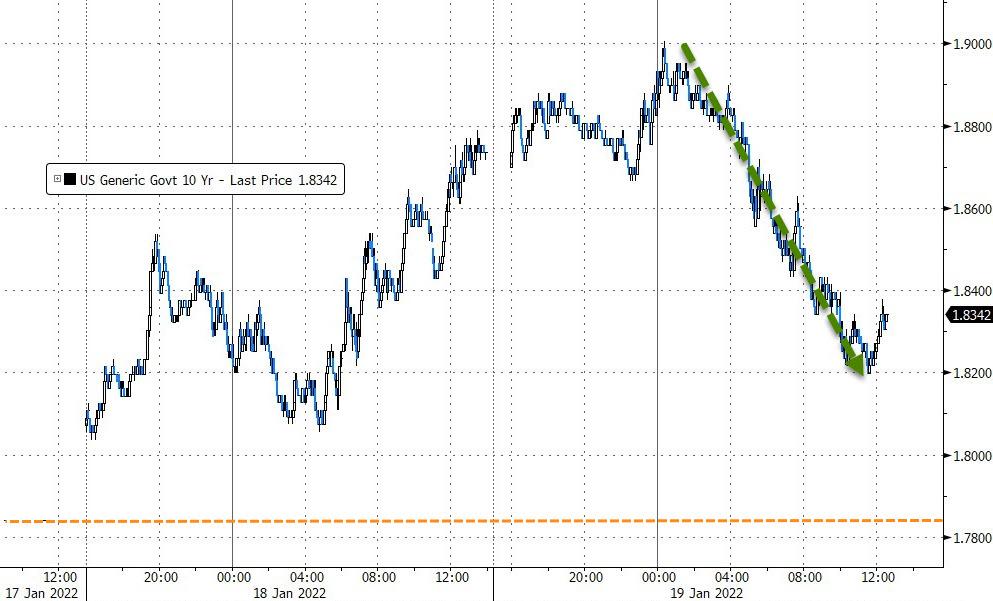
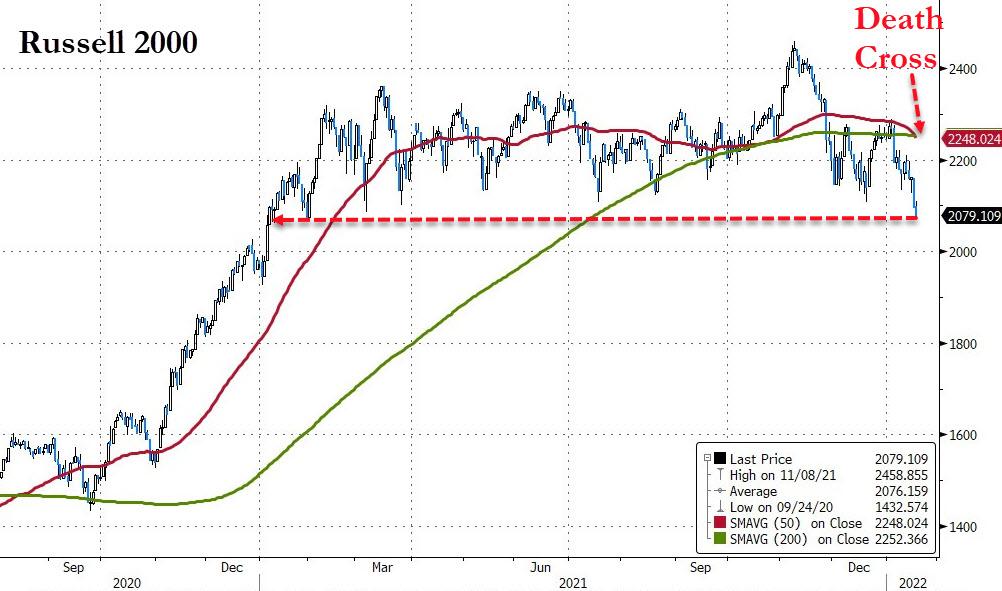
Bond yields ended the session slightly lower but not before the 10-year touched the 1.90% level, which turned out to be the reversal moment for equities, and down we went. SmallCaps were hit hard and suffered a Death Cross (50-day M/A below 200-day M/A).
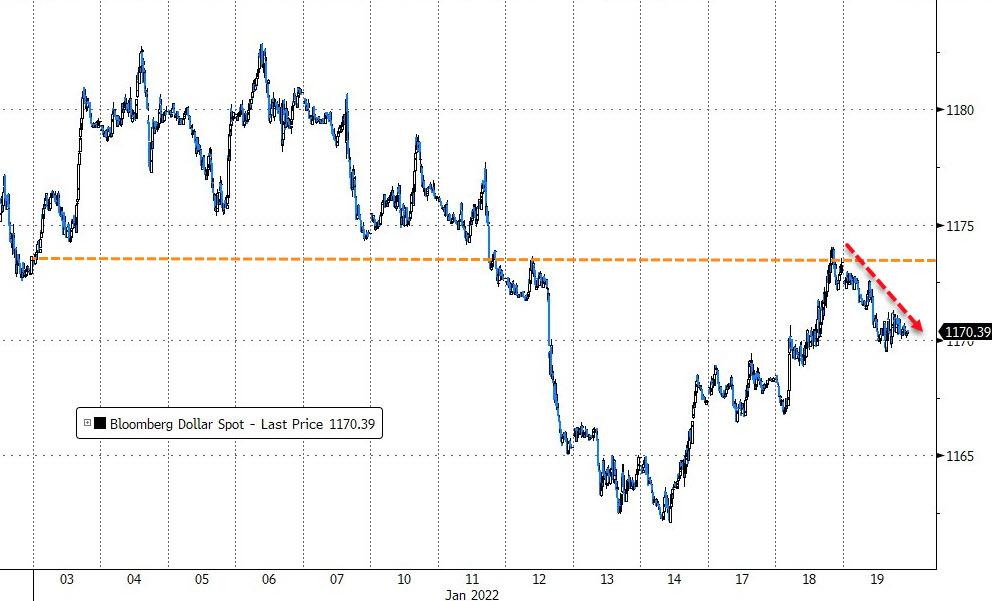
The US Dollar bounced off its YTD unchanged line and closed lower. The shining star of the day was gold, which added +1.6% and reclaimed its $1,840 level.
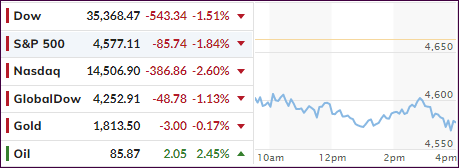
As we’ve witnessed for most of this year, surging bond yields have been the culprit to not only keep equities in check but also pull them off their lofty levels. Such was the case again today when the session got off to a bad start with the Dow dumping some 500 points right after the opening. The markets are having their worst start to a year since 2016, as ZH pointed out.
Adding to the sour mood was Goldman Sachs’ disappointing earnings report due in part to a 23% surge in operating expenses, which spanked their shares at the tune of -7%.
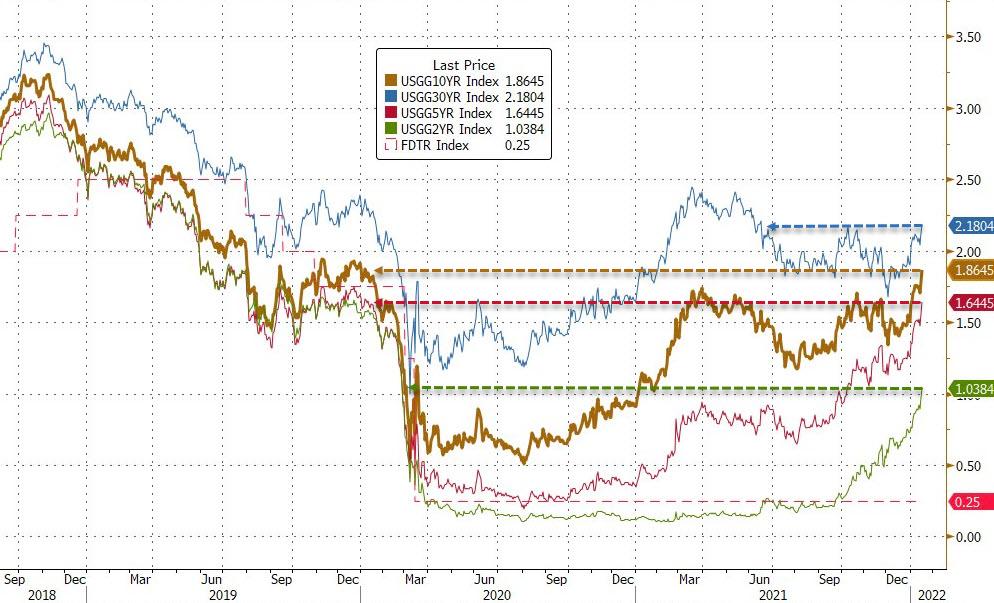
In bond land, the closely watched 2-year yield pierced the 1% level for the first time in almost 2 years. It has proven to be a reliable measure as to where the Fed will set short-term borrowing rates. Not to be left behind, the 10-year followed suit by touching its 1.86% level, also its highest since January 2020.
What that means is that the bond market is pricing in the announced aggressive policy tightening by the Fed, as well as their hawkish guidance. So far, they have not done anything other than spook the markets, and it remains to be seen whether they will follow through or simply leave traders and computer algos to deal with nothing but anticipation.
In terms of earning season, MarketWatch summed it up like this:
Overall, 33 S&P 500 companies have reported calendar fourth-quarter earnings thus far, according to Refinitiv. Of those companies, nearly 70% posted bottom-line results that beat analyst expectations.
The US Dollar extended recent gains but pulled back into the close, while gold chopped around and only ended slightly lower.
While our TTIs (section 3) remain on the bullish side of their respective trend lines, one of our holdings has broken clearly through its trailing sell stop and will be sold, unless a rebound materializes tomorrow.
There was no place to hide during today’s drop, and it looks like further bond yield spikes could deflate this equity bubble even more and eventually send us to the safety of the sidelines.
Below, please find the latest High-Volume ETF Cutline report, which shows how far above or below their respective long-term trend lines (39-week SMA) my currently tracked ETFs are positioned.
This report covers the HV ETF Master List from Thursday’s StatSheet and includes 312 High Volume ETFs, defined as those with an average daily volume of more than $5 million, of which currently 172 (last week 168) are hovering in bullish territory. The yellow line separates those ETFs that are positioned above their trend line (%M/A) from those that have dropped below it.
In case you are not familiar with some of the terminology used in the reports, please read the Glossary of Terms. If you missed the original post about the Cutline approach, you can read it here.


