
ETF Tracker StatSheet
You can view the latest version here.
A WILD WEEK CLOSES WITH A BOUNCE BACK
- Moving the markets
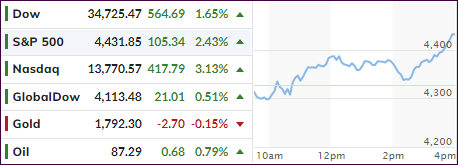
After 3 consecutive weeks of losses, the S&P finally managed to eke out a 0.8% gain, but it was a hard-fought battle with the move to the plus side happening during the last hour of trading today.
Boosting the major indexes was Apple with a 7% advance, while some of the heavy hitters like Microsoft, Amazon and Google finally gave an assist after having been beaten down earlier in the week.
Also helping the bullish cause was month-end pension and mutual fund rebalancing, which ZH estimates to be about $65 billion. This meme may very well come into play again on Monday, the last trading day of the month.
Commented MW about this week’s volatility:
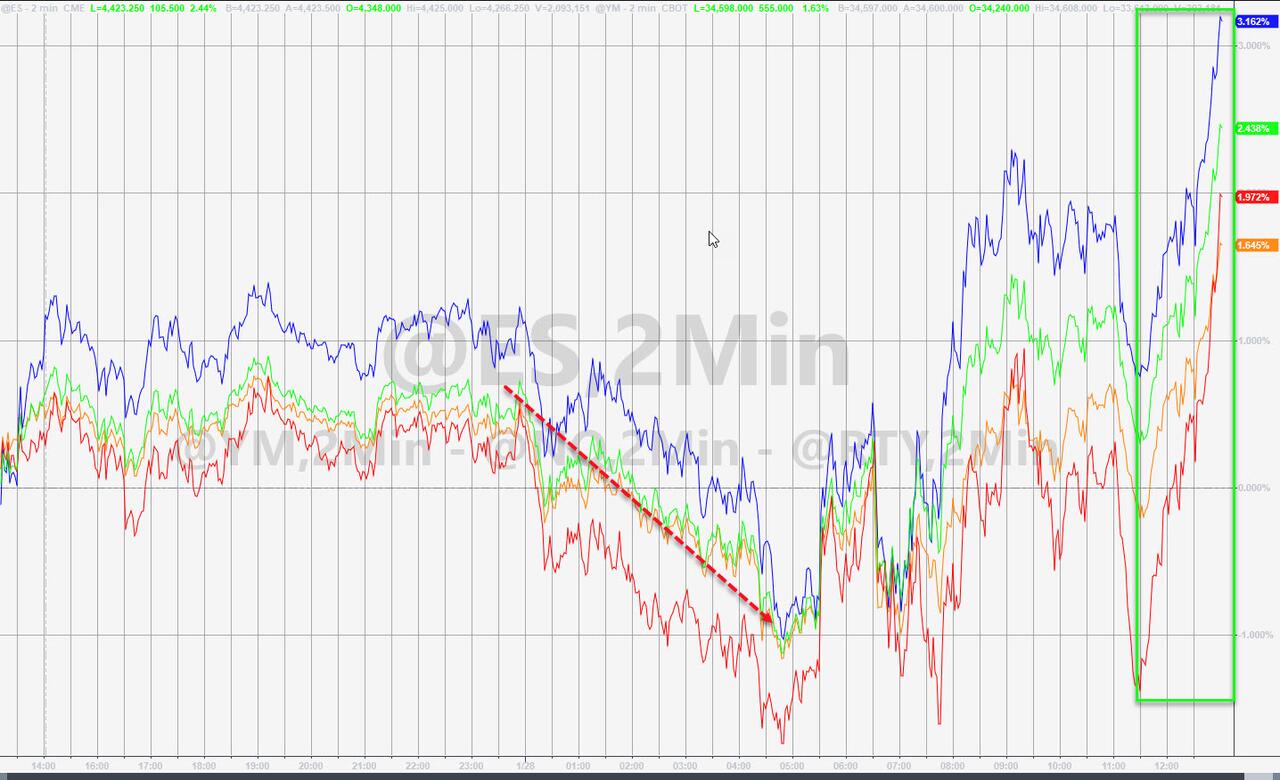
The major indexes have experienced outsized swings each day this week — including the Dow making up a more than 1,000-point intraday deficit to close higher on Monday for the first time ever. The S&P 500 has posted an intraday range of at least 2.25% every day this week, according to Bespoke Investment Group.
Despite today’s rebound, the S&P 500 is on pace for its weakest month since March 2020, while the Nasdaq looks to be hit the hardest by heading for its not only worst month since 2008 but also towards “the worst month of the year of all time.”
ZH expounded further on the reality of what we are witnessing:
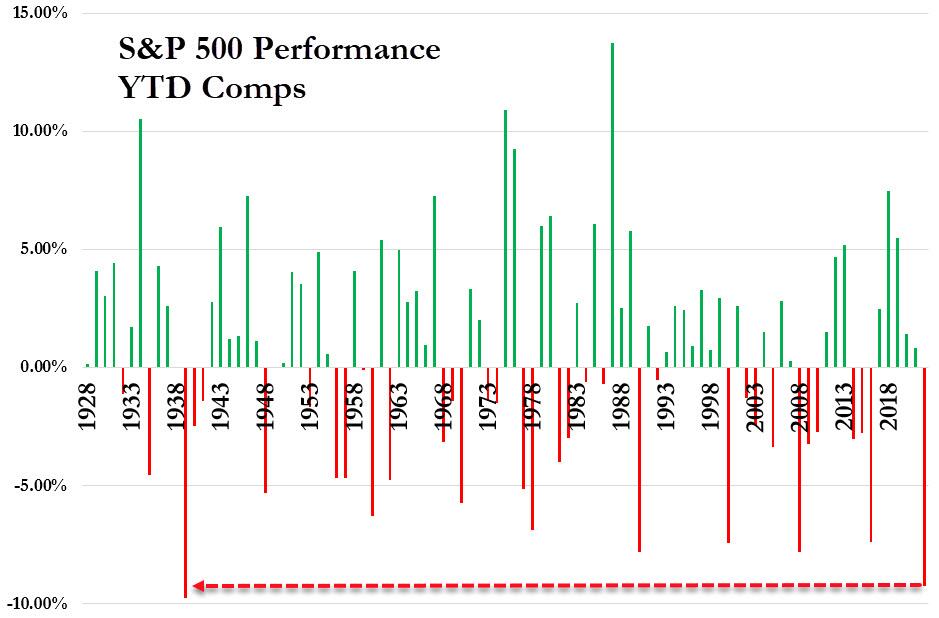
Despite today’s panic-buying, this is the worst start to a year for the S&P 500 since 1939 (and on course for its worst January ever)…
Ouch!
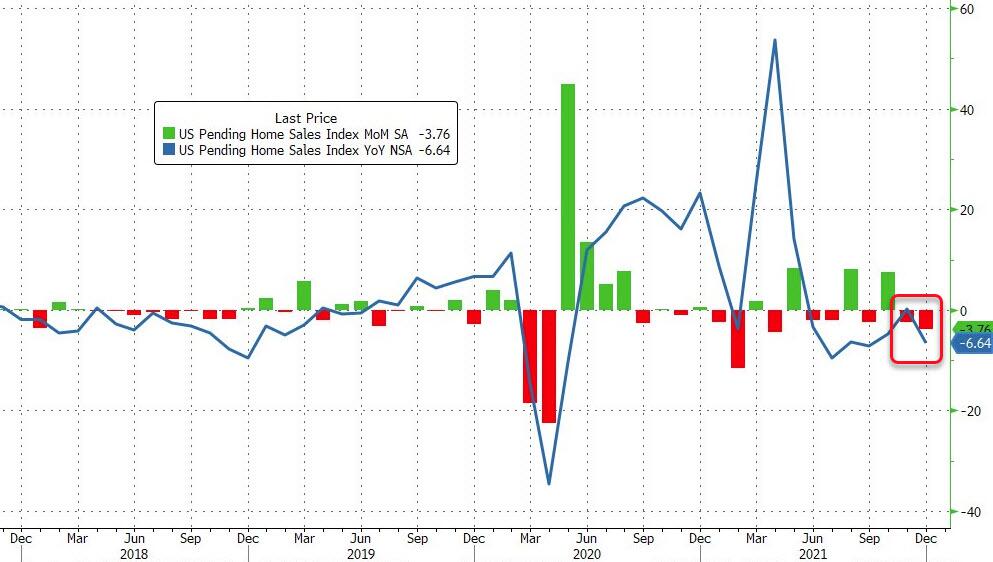
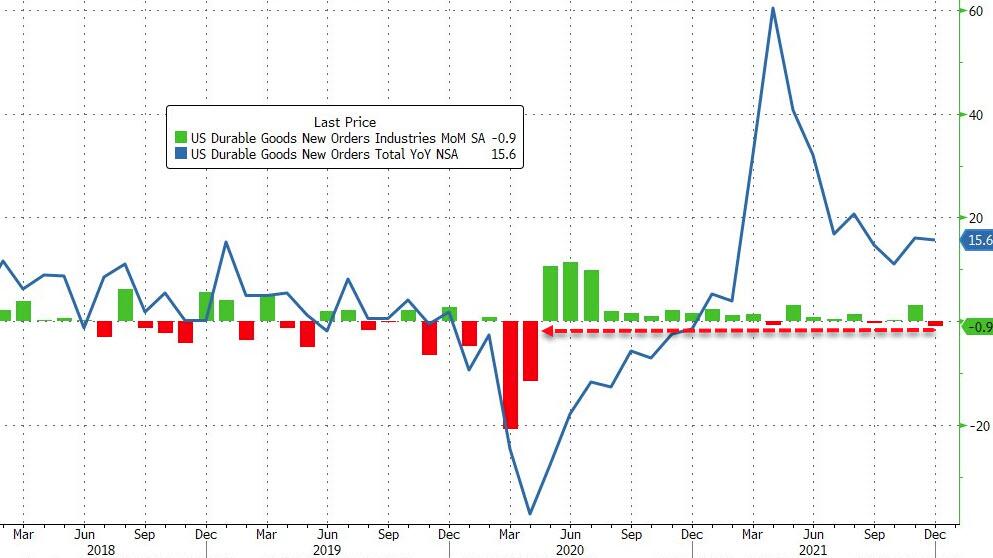
Even though we rebounded into the weekend, the economic environment looks anything but rosy. We saw Pending Home Sales tumbling, likely due to higher mortgage rates, and December US Durable Goods collapsing the most since the beginning of Covid.
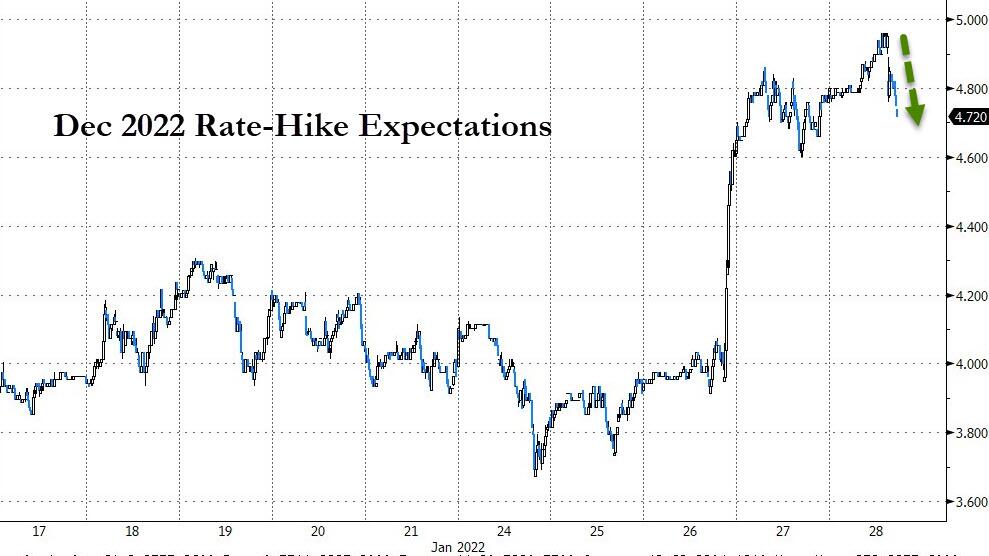
Today, we watched Q1 GDP forecasts puking big time with the Atlanta Fed’s expectations crashing to just about zero, as this chart shows. As a result, the much tracked December 2022 Rate-Hike expectations shifted toward a more dovish mode (fewer hikes), which helped the major indexes to ramp sharply into the close.
Looking at inflation, it seems that the Fed is at a fork in the road between popping the stock market bubble via higher rates or allowing persistent inflation to brutalize the middle and lower class. Depending on their choices, the markets are still at a level where a breakout in either direction is a distinct possibility.
You can see the effect of this month’s madness on our Trend Tracking Indexes (TTIs) in section 3 below.
2. ETFs in the Spotlight
In case you missed the announcement and description of this section, you can read it here again.
It features some of the 10 broadly diversified domestic and sector ETFs from my HighVolume list as posted every Saturday. Furthermore, they are screened for the lowest MaxDD% number meaning they have been showing better resistance to temporary sell offs than all others over the past year.
The below table simply demonstrates the magnitude with which these ETFs are fluctuating above or below their respective individual trend lines (%+/-M/A). A break below, represented by a negative number, shows weakness, while a break above, represented by a positive percentage, shows strength.
For hundreds of ETF choices, be sure to reference Thursday’s StatSheet.
For this current domestic “Buy” cycle, here’s how some of our candidates have fared:

Click image to enlarge.
Again, the %+/-M/A column above shows the position of the various ETFs in relation to their respective long-term trend lines, while the trailing sell stops are being tracked in the “Off High” column. The “Action” column will signal a “Sell” once the -12% point has been taken out in the “Off High” column, which has replaced the prior -8% to -10% limits.
3. Trend Tracking Indexes (TTIs)
Our Domestic TTI managed to recover today, which otherwise would have confirmed a domestic Sell signal. In my advisor practice, it did not matter, since of our trailing sell stops had taken us out of most holdings already. Right now, I will add those sector funds, which do well in the current inflationary environment.
As you can see by proximity of the TTI to its trendline, we are stuck in neutral territory, which simply means that it’s not clear which way the markets will turn next. Should it be further south, then we are in a good position to not participate in the coming bear market.
However, should we break out to the upside, I will have to re-enter the market and consider this event a whipsaw signal. Those types of signals are simply an unavoidable byproduct of our quest to sidestep portfolio crushing bear markets.
My view is that we will witness one at some point this year.
This is how we closed 01/28/2022:
Domestic TTI: -0.55% below its M/A (prior close -2.12%)—Buy signal effective 07/22/2020.
International TTI: +1.39% above its M/A (prior close +0.97%)—Buy signal effective 07/22/2020.
Disclosure: I am obliged to inform you that I, as well as my advisory clients, own some of the ETFs listed in the above table. Furthermore, they do not represent a specific investment recommendation for you, they merely show which ETFs from the universe I track are falling within the specified guidelines.
All linked charts above are courtesy of Bloomberg via ZeroHedge.
———————————————————-
WOULD YOU LIKE TO HAVE YOUR INVESTMENTS PROFESSIONALLY MANAGED?
Do you have the time to follow our investment plans yourself? If you are a busy professional who would like to have his portfolio managed using our methodology, please contact me directly or get more details.
Contact Ulli