1. From the universe of over 1,800 ETFs, I have selected only those with a trading volume of over $5 million per day (HV ETFs), so that liquidity and a small bid/ask spread are assured.
2. Trend Tracking Indexes (TTIs)
Buy or Sell decisions for Domestic and International ETFs (section 1 and 2), are made based on the respective TTI and its position either above or below its long-term M/A (Moving Average). A crossing of the trend line from below accompanied by some staying power above constitutes a “Buy” signal. Conversely, a clear break below the line constitutes a “Sell” signal. Additionally, I use an 12% trailing stop loss on all positions in these categories to control downside risk.
3. All other investment arenas do not have a TTI and should be traded based on the position of the individual ETF relative to its own respective trend line (%M/A). That’s why those signals are referred to as a “Selective Buy.” In other words, if an ETF crosses its own trendline to the upside, a “Buy” signal is generated. Here too, I recommend trailing sell stop of 12%, or less, depending on your risk tolerance.
If you are unfamiliar with some of the terminology, please see Glossary of Termsand new subscriber information in section 9.
1. DOMESTIC EQUITY ETFs: SELL— since 02/24/2022
Click on chart to enlarge
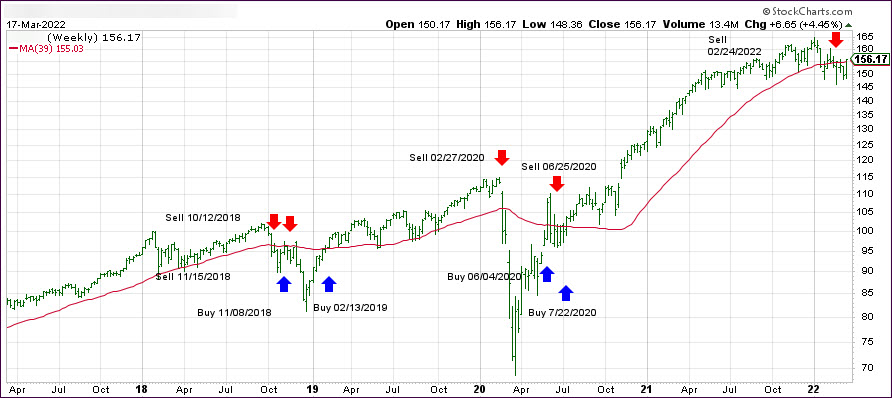
Our main directional indicator, the Domestic Trend Tracking Index (TTI-green line in the above chart) has just broken above its long-term trend line (red) by +0.92% and remains in “SELL” mode—although it is on the edge of moving back to the Buy side.
Equities jumped for the third straight day pushing our Domestic Trend Tracking Index (TTI) above its long-term trend line for the first time, since the effective date of our latest Sell signal on 2/24/22.
As I pointed out yesterday, the markets are ignoring all the geopolitical and economic dramas (Stagflation) and are focusing on the main driver, which can make or break bull markets, and that is Fed interest rate policy.
It’s now been widely accepted that the Fed has made a policy error and that, despite the Fed’s remaining 2 rate hikes, they will walk back their tough talk, as ZH explained:
The market is now pricing in rate-hikes to 2.00% in 2022… and then a full rate-cut in 2023…
That is full policy error pricing as the market is now convinced The Fed will hike into stagflation, guaranteeing a recession, sparking rate-cuts. All of which is perhaps another reason why gold is rebounding today…
Here are some snippets from Rabobank and BofA, who called it like this:
“By the September meeting the damage from the Ukraine crisis to the global economy may become a threat to the US economic expansion. The doves in the FOMC are likely to jump from the hiking bandwagon by then and demand a pause.”
Putting it all together, Marey’s Rabobank colleague Michael Every picks up where we left off with our FOMC post-mortem, and writes that “the market is going even further. With 30-year yields dropping and US 5-10s inverting, and only 20bp to go on 2s-10s, and with stocks, gold, and crypto all up, we are now pricing for a policy error and the inevitable rate cuts and new QE that will have to follow.” In other words, and as we have been hammering for months, “just as the Fed drives things off a cliff, Mr Market is already pricing in the trampoline at the bottom of it that will take us to even higher market-y highs.”
There you have it. The markets fully anticipate the above scenario and are already counting on future rate cuts and QE, even though none of that may happen till the end of this year.
As you can see in section 3 below, our Domestic TTI has moved back into bullish territory and, should that condition hold for a couple of days, we will look for new domestic exposure next week.
Looking at the big picture, ZH added:
Meanwhile, the Russia-Ukraine conflict continues, stagflation fears are soaring (today’s Philly Fed saw growth expectations plunge, prices paid soar), COVID cases are on the rise again, China growth concerns persist, and commodity prices are rebounding again.
Let’s see what the panic-BTFD algos say tomorrow after options expirations…
Continue reading…
2. ETFs in the Spotlight
In case you missed the announcement and description of this section, you can read it here again.
It features some of the 10 broadly diversified domestic and sector ETFs from my HighVolume list as posted every Saturday. Furthermore, they are screened for the lowest MaxDD% number meaning they have been showing better resistance to temporary sell offs than all others over the past year.
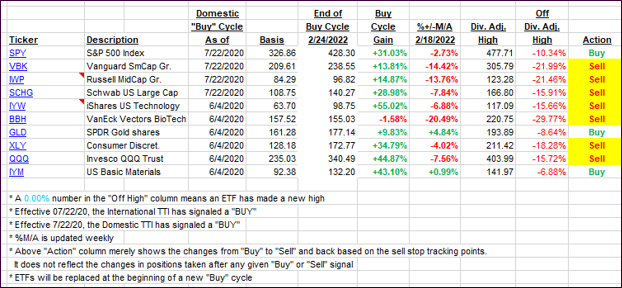
The below table simply demonstrates the magnitude with which these ETFs are fluctuating above or below their respective individual trend lines (%+/-M/A). A break below, represented by a negative number, shows weakness, while a break above, represented by a positive percentage, shows strength.
For hundreds of ETF choices, be sure to reference Thursday’s StatSheet.
For this just closed-out domestic “Buy” cycle, here’s how some of our candidates have fared:
Click image to enlarge.
Again, the %+/-M/A column above shows the position of the various ETFs in relation to their respective long-term trend lines, while the trailing sell stops are being tracked in the “Off High” column. The “Action” column will signal a “Sell” once the -12% point has been taken out in the “Off High” column, which has replaced the prior -8% to -10% limits.
3. Trend Tracking Indexes (TTIs)
Our TTIs followed the broad market direction higher, with the Domestic one crossing above its trend line into bullish territory. I need to see more staying power before activating a new “Buy” signal.
This is how we closed 03/17/2022:
Domestic TTI: +0.92% above its M/A (prior close -0.34%)—Sell signal effective 02/24/2022.
International TTI: -0.94% below its M/A (prior close -2.18%)—Sell signal effective 03/08/2022.
Disclosure: I am obliged to inform you that I, as well as my advisory clients, own some of the ETFs listed in the above table. Furthermore, they do not represent a specific investment recommendation for you, they merely show which ETFs from the universe I track are falling within the specified guidelines.
All linked charts above are courtesy of Bloomberg via ZeroHedge.
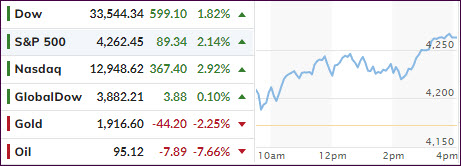
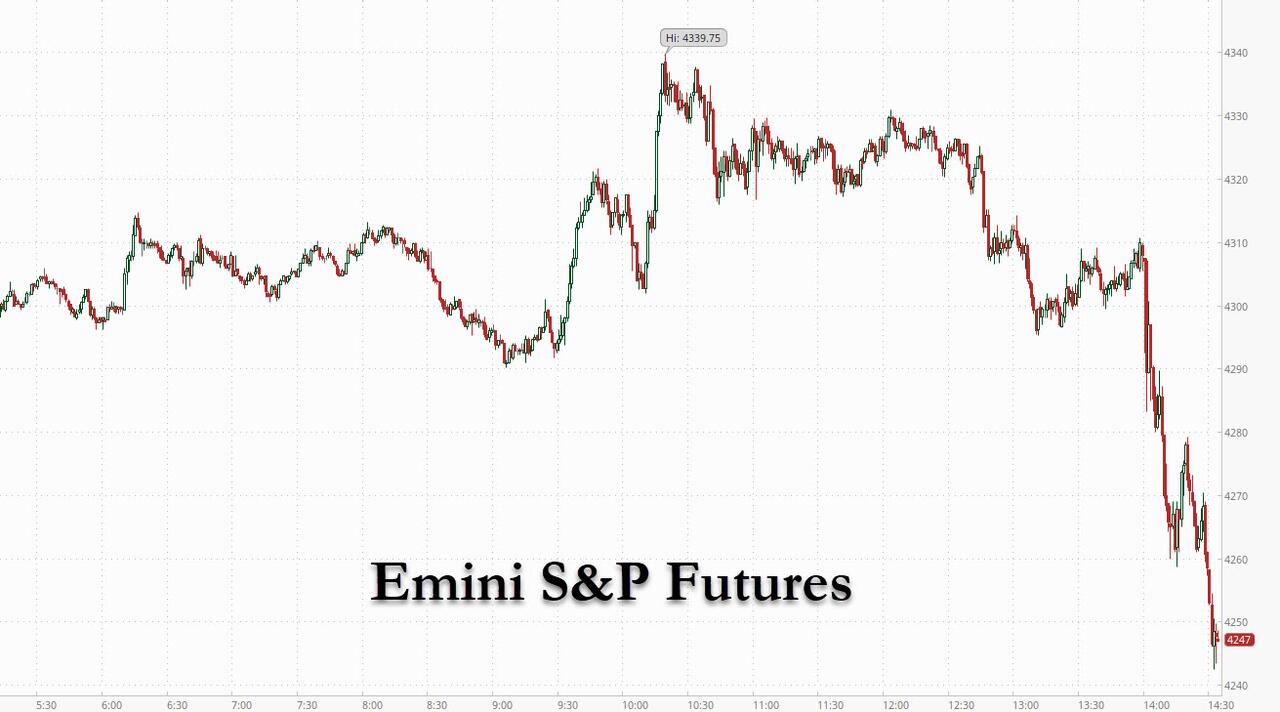
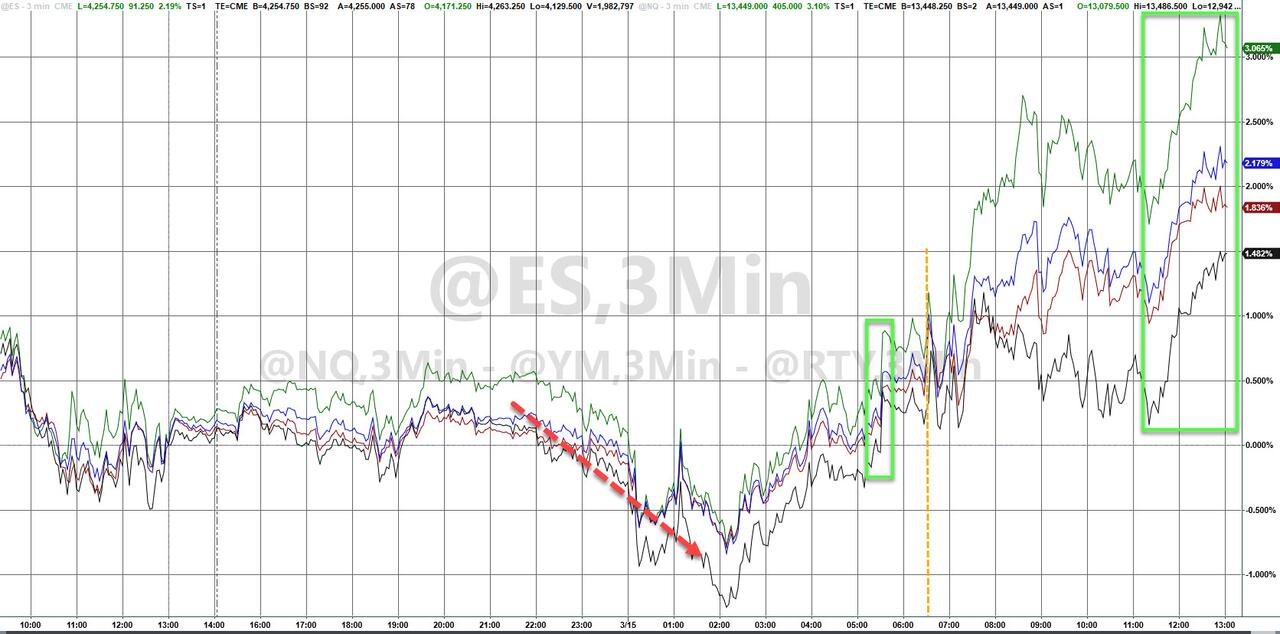
Today’s session turned into another wild ride, when an early 350-point ramp in the Dow was wiped out, with major indexes retreating to their unchanged lines, only to see them as a springboard for a last hour rebound to intra-day highs.
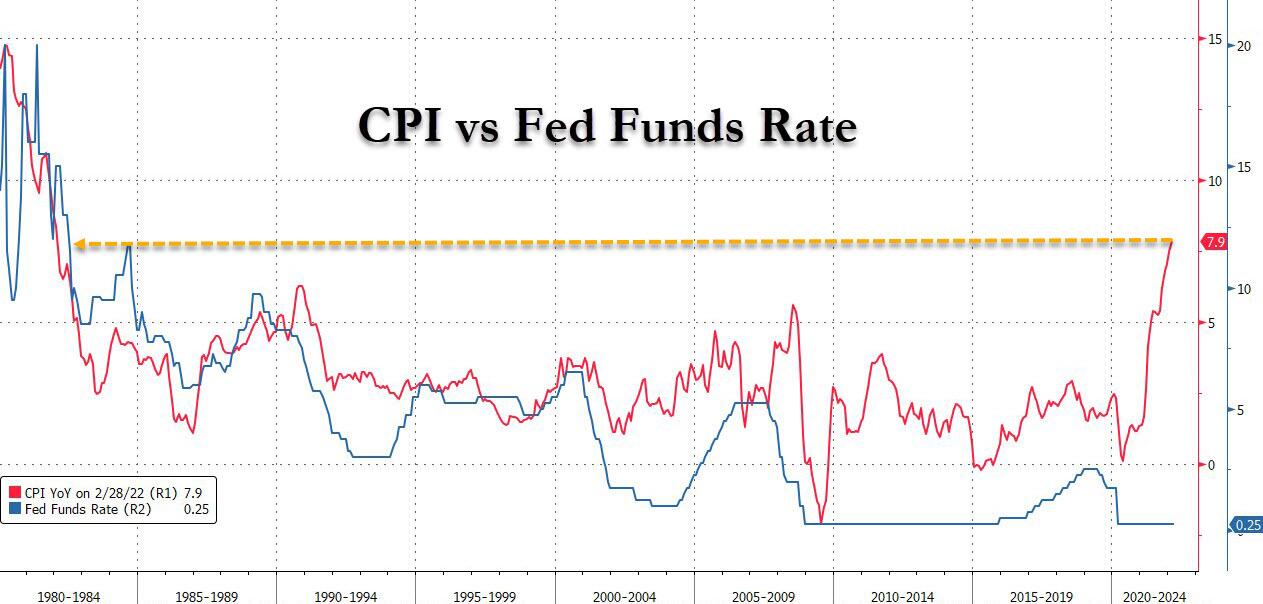
Today we learned that the Fed, as expected, raised their Federal Funds rate from zero to +0.25%, however, I could not find any explanation as to how that tiny change will fight 7.9% runaway inflation.
ZeroHedge added some color by explaining that the Fed is way behind the curve with any inflation fighting efforts, because the last time the CPI was at the current number (1982), the Fed Funds rate was at 13%, as this chart shows.
Makes me wonder how they possibly can expect that such a tiny hike will make a difference. Of course, it won’t, and we all know that any serious attempt to extinguish the inflation monster via a serious increase in rates would instantly prick the various bubbles and destroy the financial and real estate markets.
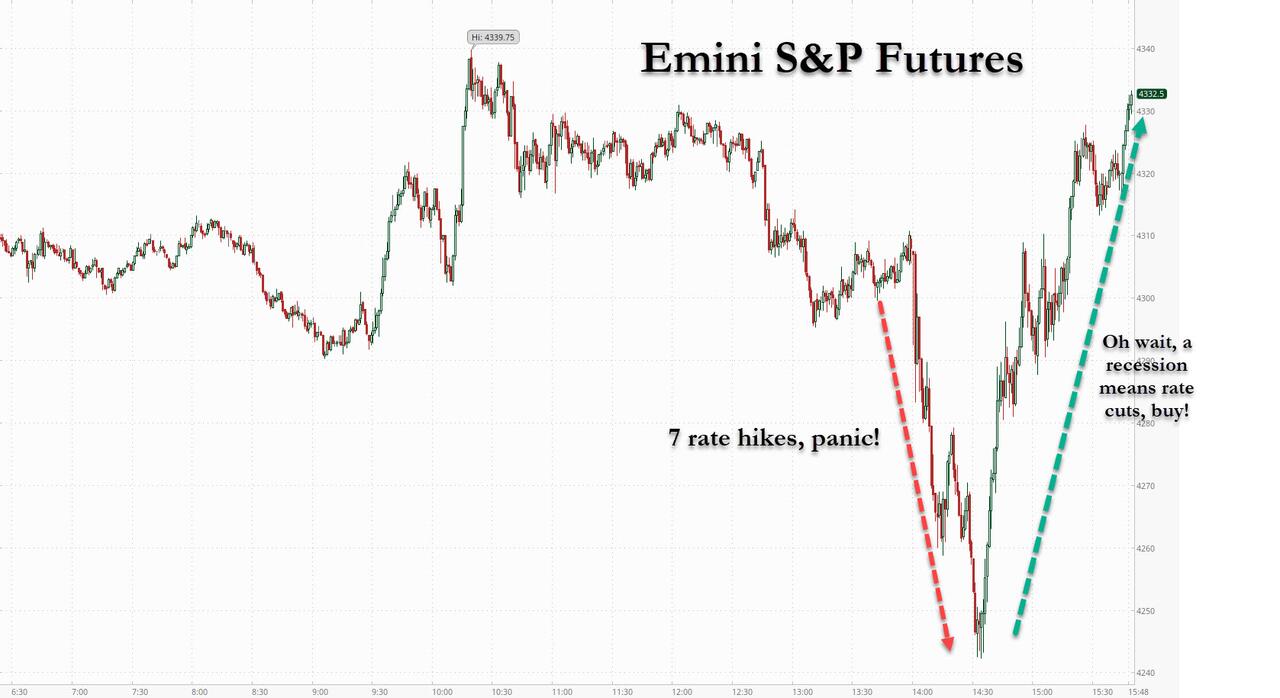
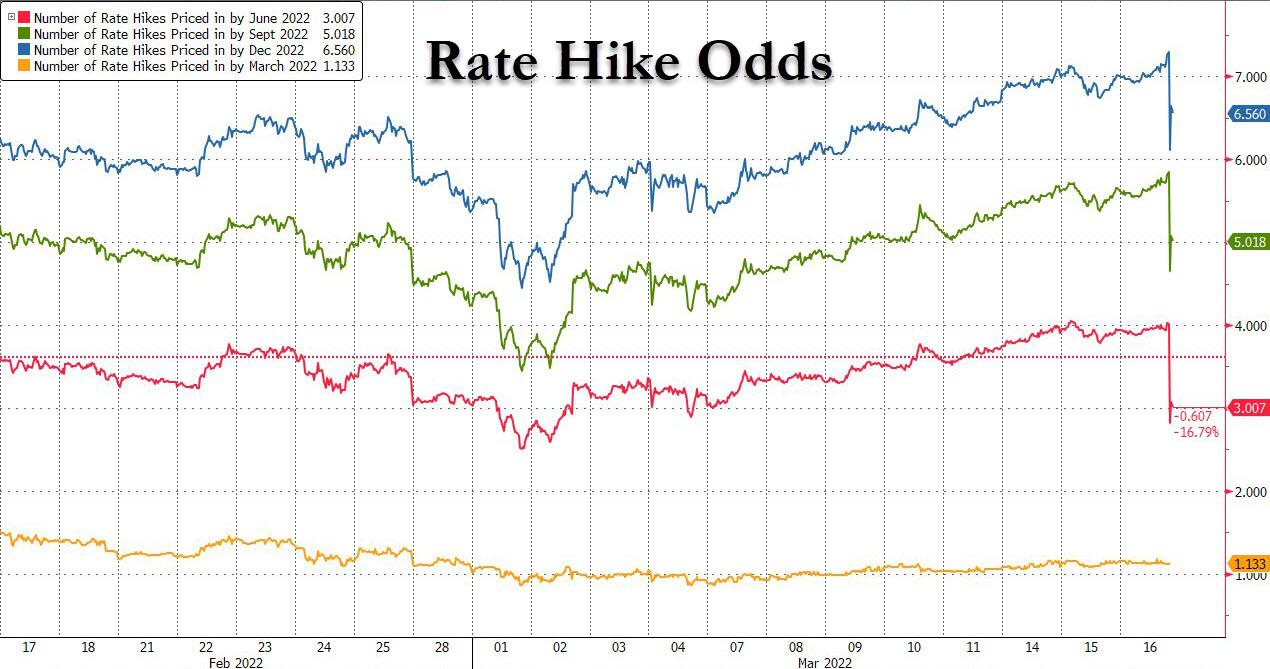
What caused the markets to stage a comeback late in the session? The Fed expects 6 more rate hikes in 2022, as did the market, or one at every meeting. Yet, once the word was out, rate hike odds plunged, and set the stage for the late rebound, which ZH explained this way:
Because with even the Fed now forecasting a big slowdown to growth coupled with a surge in inflation…
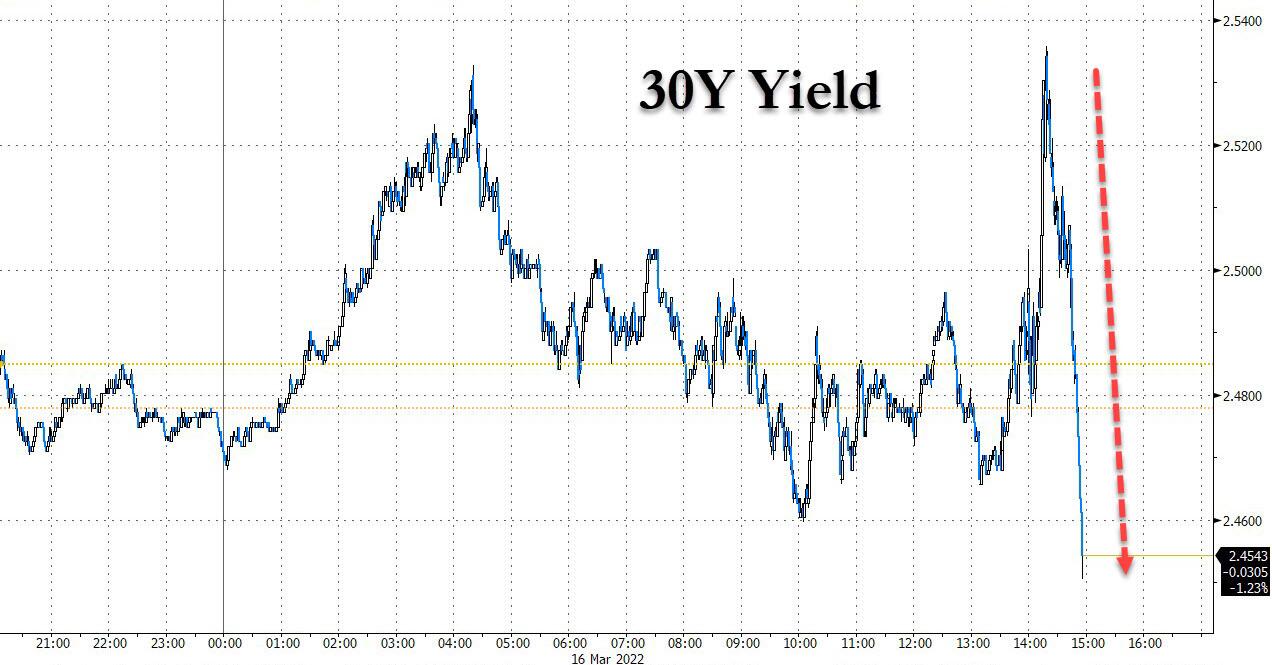
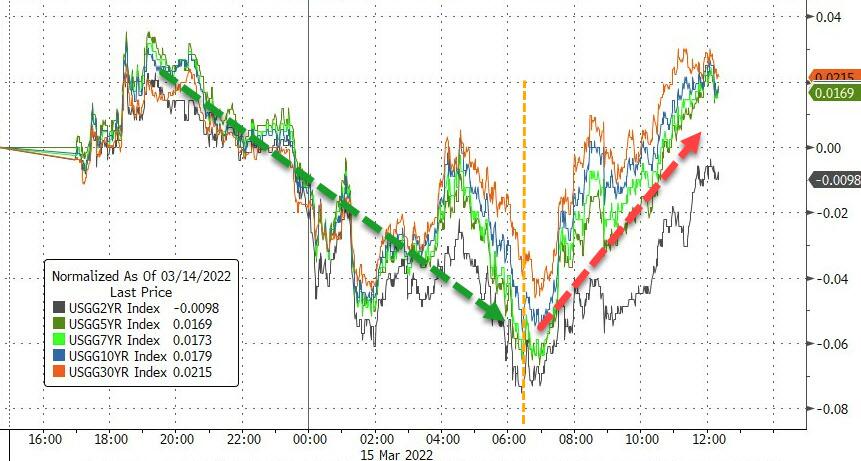
… the most likely outcome now is stagflation. This immediately manifested itself in a plunge in 30Y yields…
… culminating with the 5s10s inverting, a clear sign that a recession – the same recession which the Fed hopes to induce to crush commodity demand – is now coming.
… confirming that the Fed, which was trapped long before today’s rate hike, will be forced to ease and/or resume QE in the not-too-distant future even as inflation continues to rage. Translation: policy error.
In short, the more hawkish Powell gets, the bigger the liquidity firehose he will have to unleash in a few months when the economy plummets into an all-out recession, if not depression.
There is a good chance that, if markets continue to view this as a positive for stocks, we may find ourselves back in domestic equities—if only on a temporary basis, and before the bottom drops out.
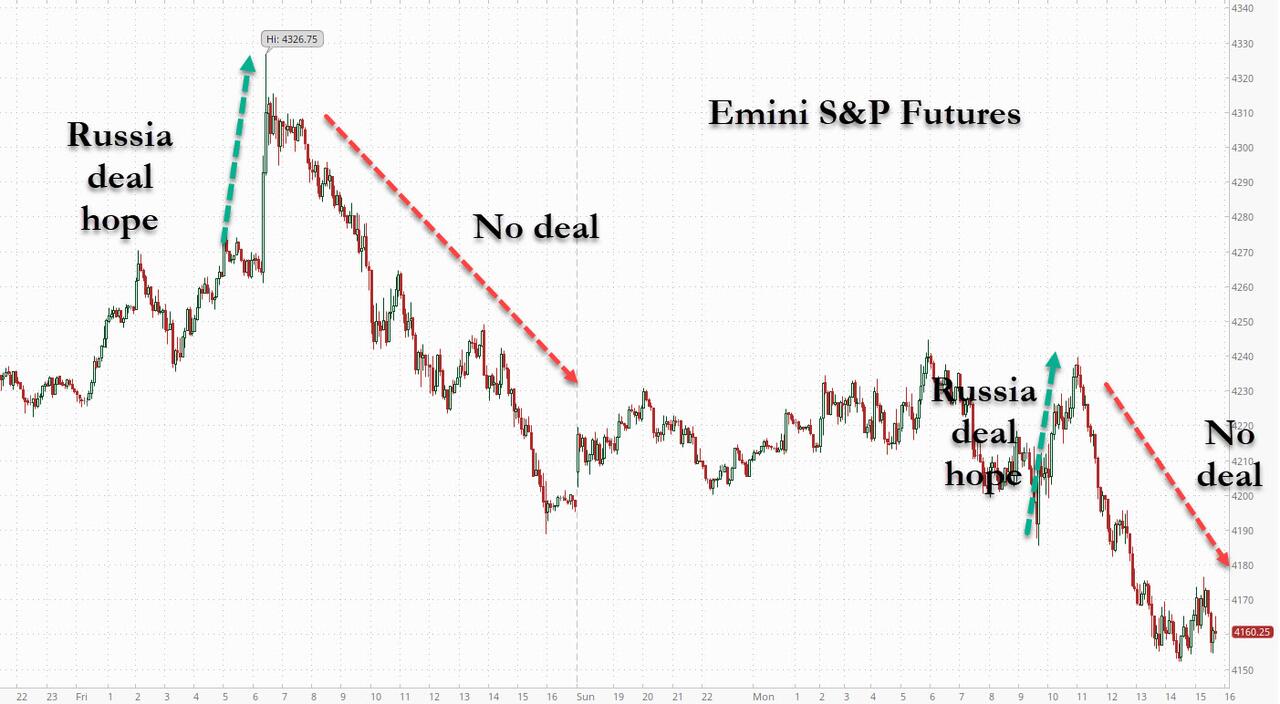
The day started with another rollercoaster ride, as equity futures first plunged, along with markets in China and Europe, but a sudden U-turn, due to changing sentiment, started the ramp-a-thon, even though the scheduled Fed’s rate hike tomorrow represents the uncertainty on deck.
As a result, and despite the bear’s relentless efforts on wiping out early rallies during the past 3 trading days, stocks finally found some relief, and the bullish theme survived with the major indexes finally scoring a win.
Despite US Producer Prices soaring at double digits for the first time, as ZH pointed out, the rise ended up being +10% YoY in February (vs. +9.7% YoY in January). When looking at the MoM data, this is the 21st straight month of increases, a trend which does not seem to have ended.
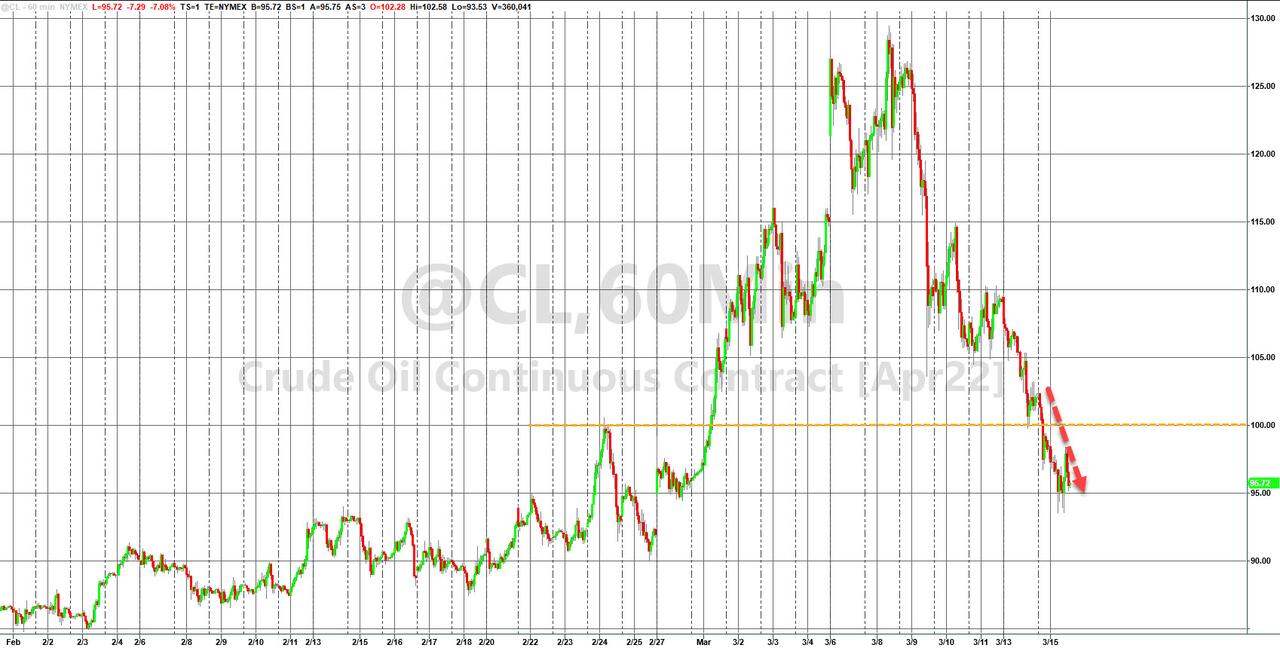
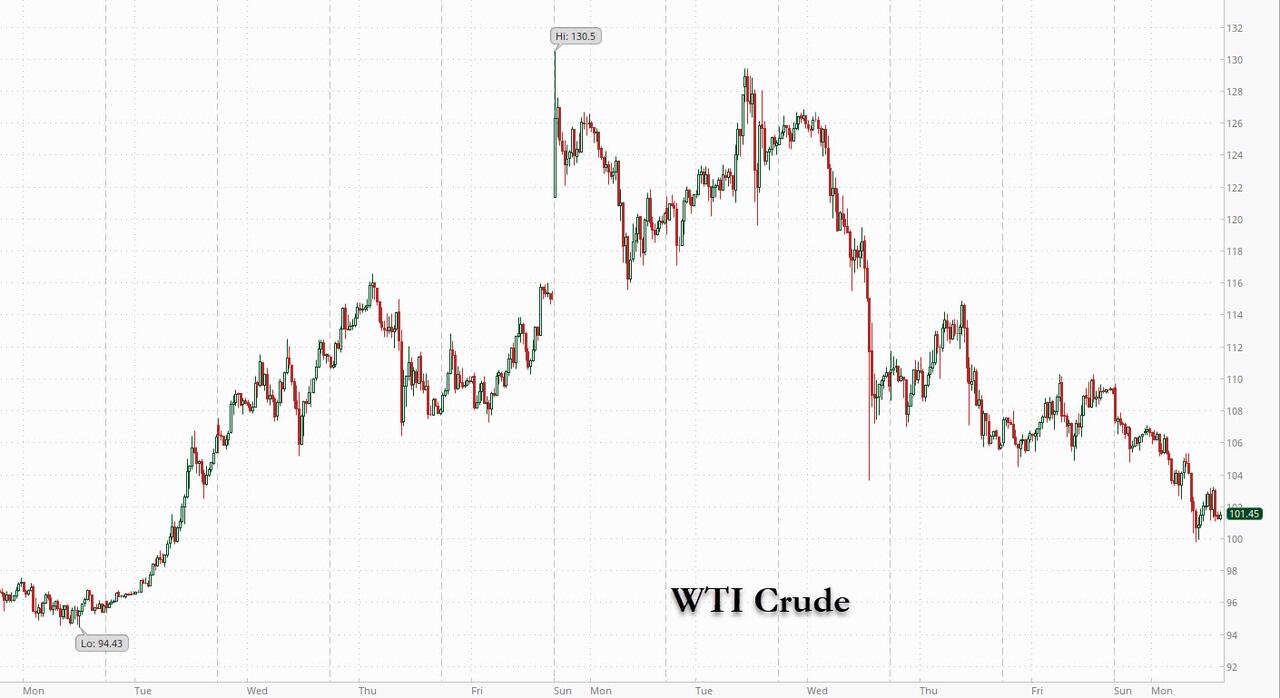
Supporting equities was weakness in the inflationary sector with Crude Oil dumping -7.5% to under $100, which also affected the energy ETF VDE and the commodities arena. DBC had given us an astonishing runup of some +23% in a mere 6 weeks, but it then crashed -13%, in the process triggering our trailing sell stop and sending us back to the sidelines.
Bonds were having a bloodbath on their own, which ZH described as yields taking a straight shot higher after an early sell-off, which left the 10-year at its highest since July 2019.
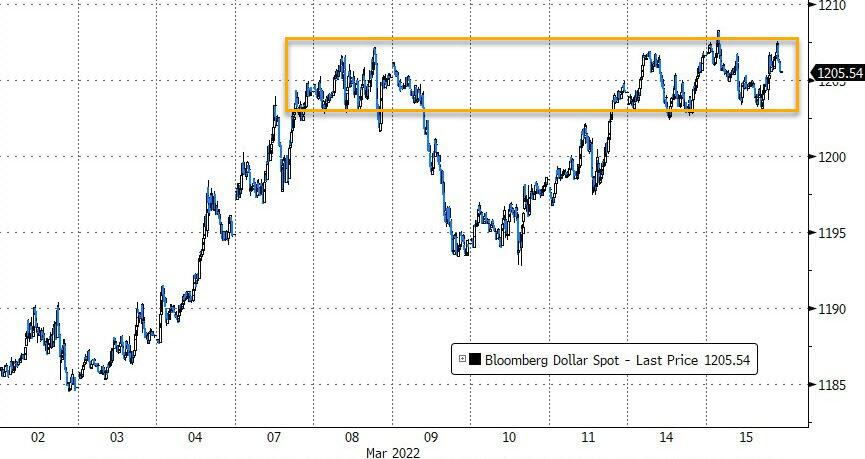
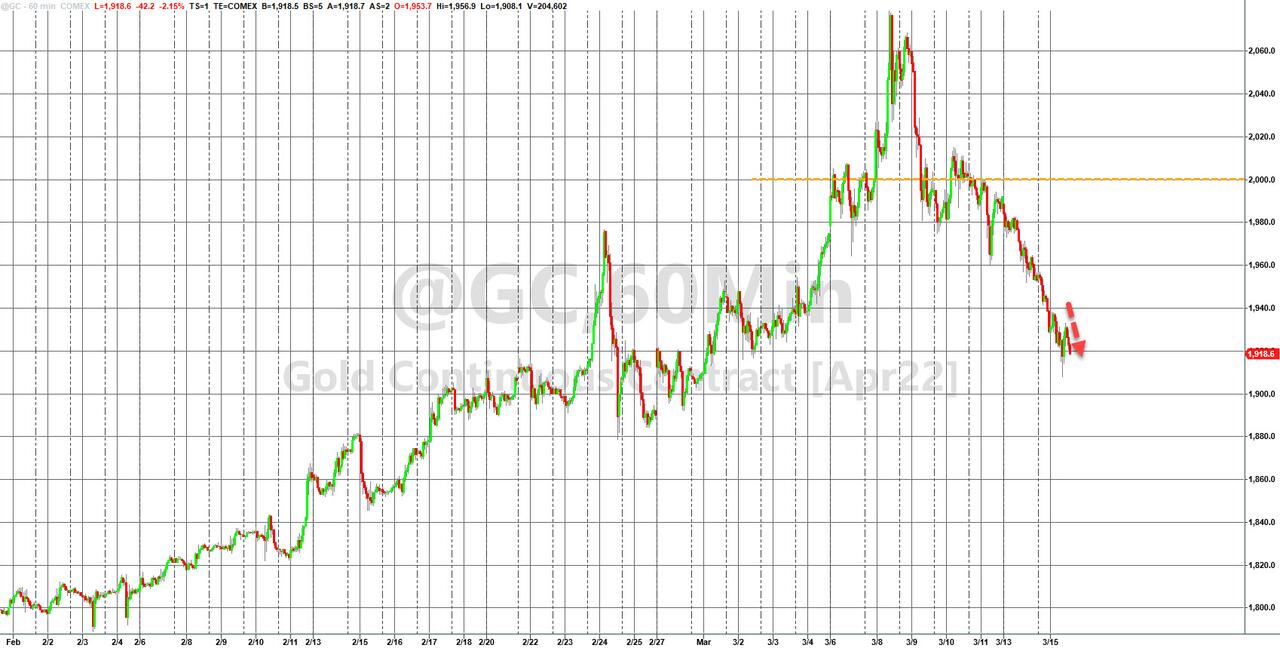
The US Dollar meandered and closed a tad lower, while Gold could not hang on to recent gains and slipped back to $1,917, down -2.21%.
In case, you find all this confusing and are wondering why stocks really rallied, here’s ZH’s straight forward explanation:
And so just to clarify – stocks rallied today… because enough rate-hikes are priced-in to guarantee a recession… which assures rate-cuts!
As we’ve seen recently with almost regular frequency, early rallies suddenly reversed, got wiped out and turned into losses. Today was no exception when a 300-point surge in the Dow hit the skids, and south we went. The Nasdaq took the biggest hit with a -2.04% loss.
Oil, commodities, and gold gave back recent gains even as uncertainty reigned yet hope of a possible oil trading arrangement by an American company with Venezuela (yes, that sanctioned Venezuela) was said to potentially provide relief.
Be that as it may, markets overall continued to be in disarray with a crazy week on deck, as ZeroHedge pointed out:
A Fed rate hike, a Russian default, a meeting between the US and China, even more sanctions against Russia, the first double-digit (10%) PPI print in decades, a big drop in retail sales, a freak surge in covid across China, oh and a $3.3 trillion notional option expiration on Friday and all happening with liquidity at record lows. Yes, this week will be insane.
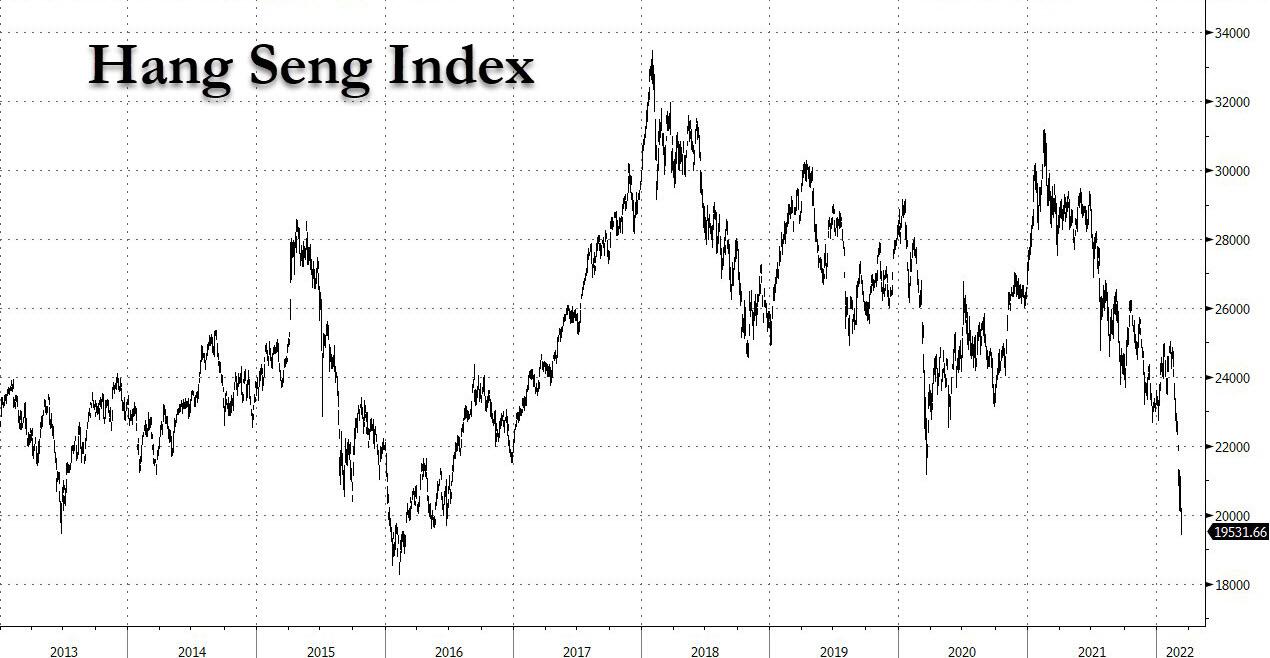
China’s stock market had its worst day in 6 years, in part due to its chummy relationship with Russia, a surge in Covid cases, including a lockdown, and regulatory issues.
Apple took a hit and dropped below its 200-day M/A, as traders worried about the shutdown of the Shenzhen Foxconn factory, which could lead to another supply chain shock for the world’s largest company.
For sure, gold turned out not to be a “safe haven”, at least not for today, as the precious metal got spanked and lost -1.5%.
Bond yields soared, as prices crashed, with the 10-year rallying over 14 bps to close at 2.14%, ahead of the Fed meeting in 2 days. The markets are now expecting 7 rate hikes, due to the inflation tsunami which, if implemented, will translate into enormous distress for stocks going forward.
Below, please find the latest High-Volume ETF Cutline report, which shows how far above or below their respective long-term trend lines (39-week SMA) my currently tracked ETFs are positioned.
This report covers the HV ETF Master List from Thursday’s StatSheet and includes 312 High Volume ETFs, defined as those with an average daily volume of more than $5 million, of which currently 64 (last week 78) are hovering in bullish territory. The yellow line separates those ETFs that are positioned above their trend line (%M/A) from those that have dropped below it.
In case you are not familiar with some of the terminology used in the reports, please read the Glossary of Terms. If you missed the original post about the Cutline approach, you can read it here.


