
- Moving the markets
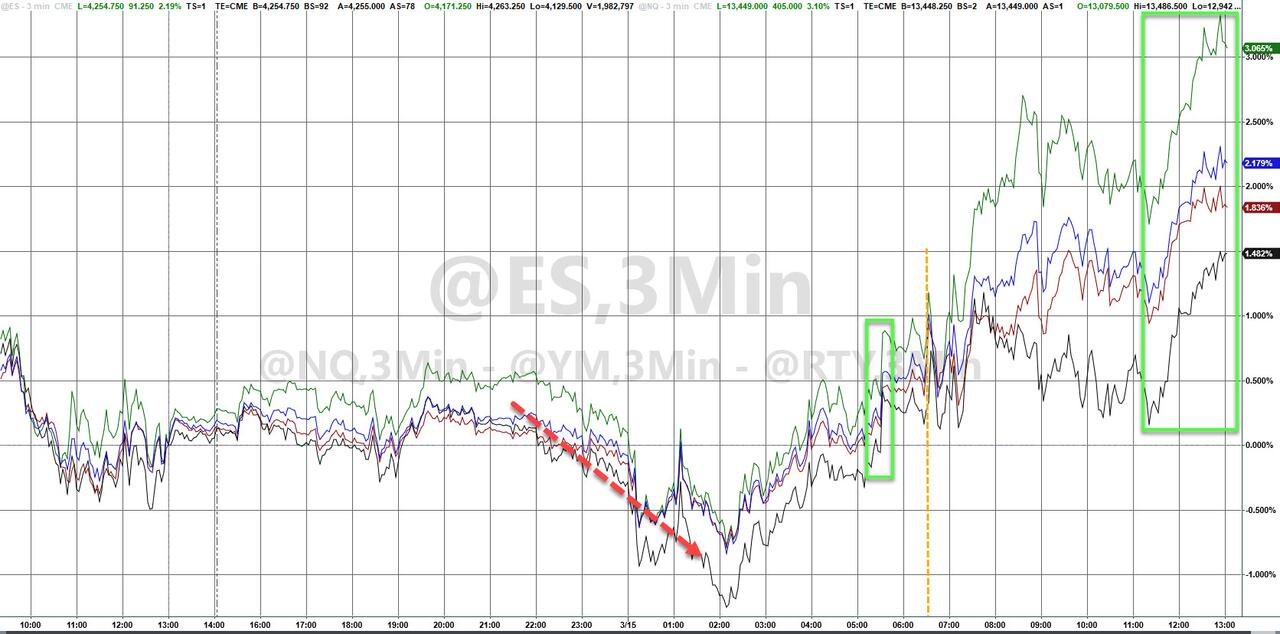
The day started with another rollercoaster ride, as equity futures first plunged, along with markets in China and Europe, but a sudden U-turn, due to changing sentiment, started the ramp-a-thon, even though the scheduled Fed’s rate hike tomorrow represents the uncertainty on deck.
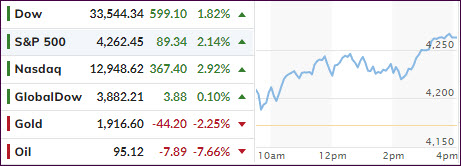
As a result, and despite the bear’s relentless efforts on wiping out early rallies during the past 3 trading days, stocks finally found some relief, and the bullish theme survived with the major indexes finally scoring a win.
Despite US Producer Prices soaring at double digits for the first time, as ZH pointed out, the rise ended up being +10% YoY in February (vs. +9.7% YoY in January). When looking at the MoM data, this is the 21st straight month of increases, a trend which does not seem to have ended.
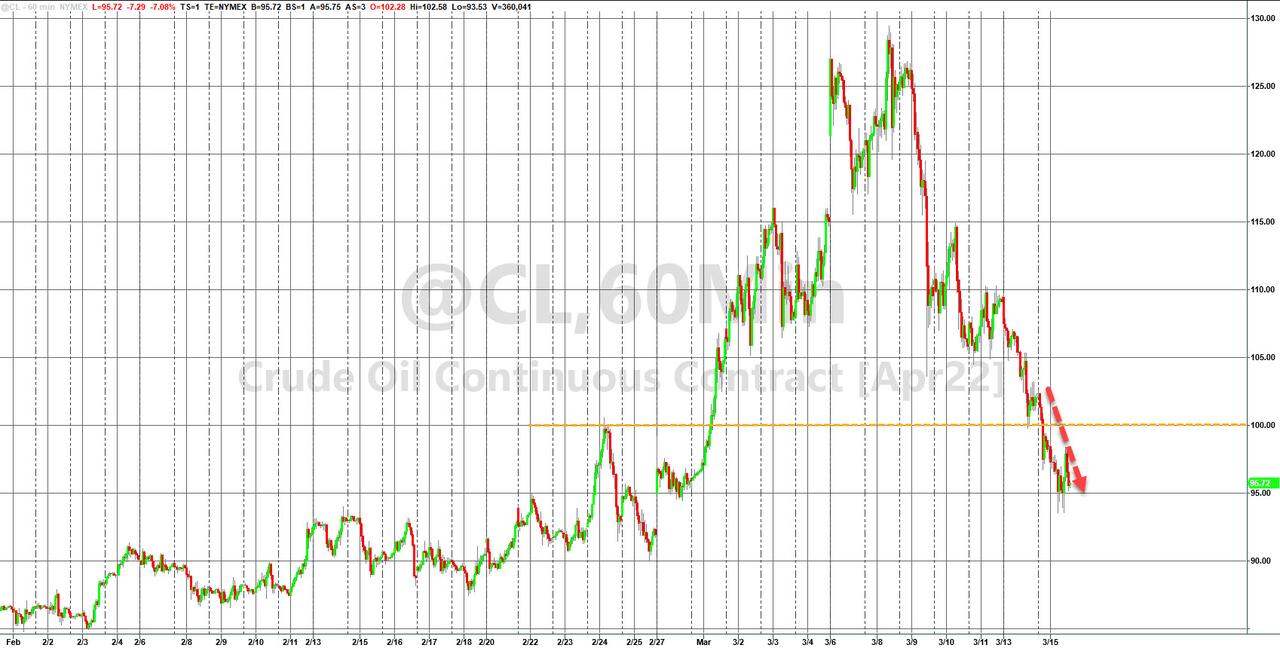
Supporting equities was weakness in the inflationary sector with Crude Oil dumping -7.5% to under $100, which also affected the energy ETF VDE and the commodities arena. DBC had given us an astonishing runup of some +23% in a mere 6 weeks, but it then crashed -13%, in the process triggering our trailing sell stop and sending us back to the sidelines.
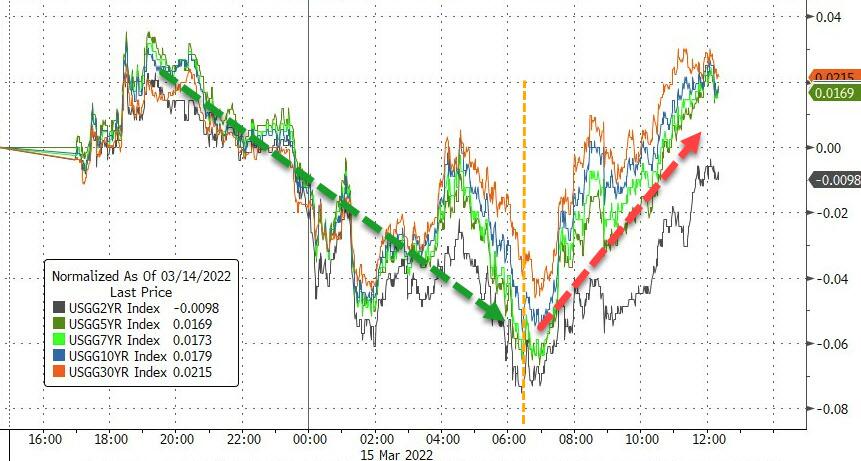
Bonds were having a bloodbath on their own, which ZH described as yields taking a straight shot higher after an early sell-off, which left the 10-year at its highest since July 2019.
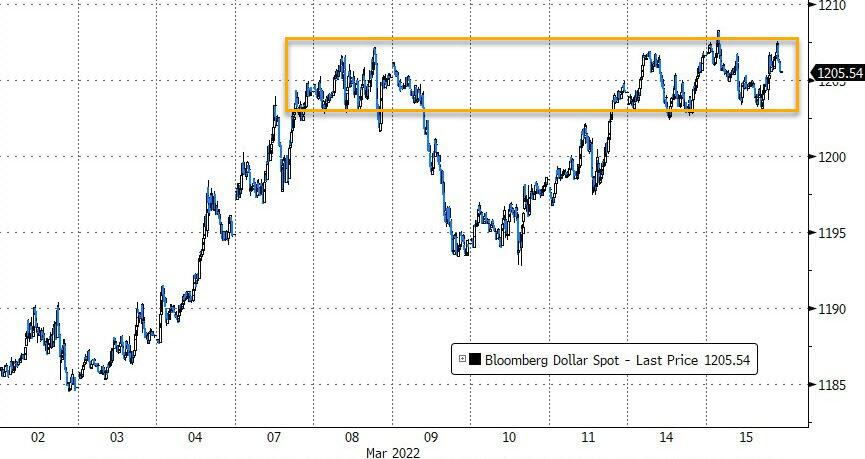
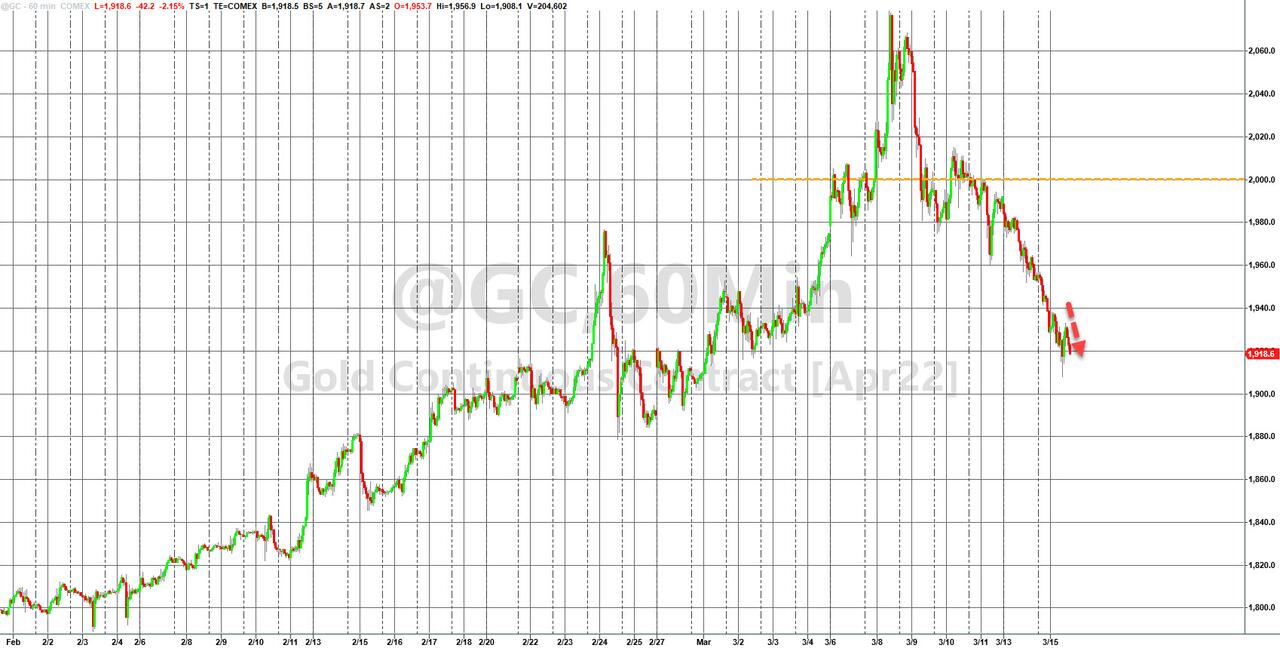
The US Dollar meandered and closed a tad lower, while Gold could not hang on to recent gains and slipped back to $1,917, down -2.21%.
In case, you find all this confusing and are wondering why stocks really rallied, here’s ZH’s straight forward explanation:
And so just to clarify – stocks rallied today… because enough rate-hikes are priced-in to guarantee a recession… which assures rate-cuts!
Go figure…
2. ETFs in the Spotlight
In case you missed the announcement and description of this section, you can read it here again.
It features some of the 10 broadly diversified domestic and sector ETFs from my HighVolume list as posted every Saturday. Furthermore, they are screened for the lowest MaxDD% number meaning they have been showing better resistance to temporary sell offs than all others over the past year.
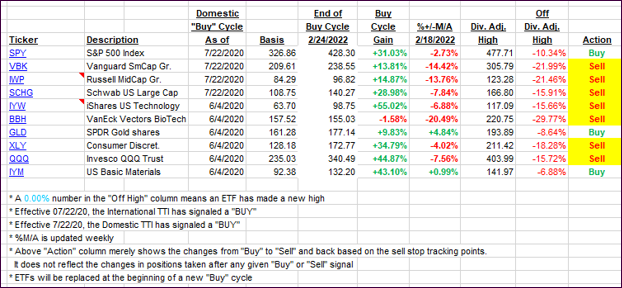
The below table simply demonstrates the magnitude with which these ETFs are fluctuating above or below their respective individual trend lines (%+/-M/A). A break below, represented by a negative number, shows weakness, while a break above, represented by a positive percentage, shows strength.
For hundreds of ETF choices, be sure to reference Thursday’s StatSheet.
For this just closed-out domestic “Buy” cycle, here’s how some of our candidates have fared:
Click image to enlarge.
Again, the %+/-M/A column above shows the position of the various ETFs in relation to their respective long-term trend lines, while the trailing sell stops are being tracked in the “Off High” column. The “Action” column will signal a “Sell” once the -12% point has been taken out in the “Off High” column, which has replaced the prior -8% to -10% limits.
3. Trend Tracking Indexes (TTIs)
Our TTIs recovered, as the bulls finally had a day in the sun.
This is how we closed 03/15/2022:
Domestic TTI: -2.18% below its M/A (prior close -3.74%)—Sell signal effective 02/24/2022.
International TTI: -4.34% below its M/A (prior close -4.64%)—Sell signal effective 03/08/2022.
Disclosure: I am obliged to inform you that I, as well as my advisory clients, own some of the ETFs listed in the above table. Furthermore, they do not represent a specific investment recommendation for you, they merely show which ETFs from the universe I track are falling within the specified guidelines.
All linked charts above are courtesy of Bloomberg via ZeroHedge.
Contact Ulli