
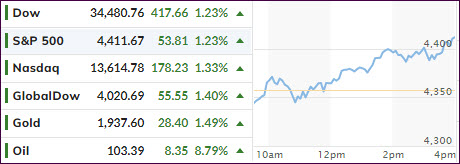
- Moving the markets
Equities jumped for the third straight day pushing our Domestic Trend Tracking Index (TTI) above its long-term trend line for the first time, since the effective date of our latest Sell signal on 2/24/22.
As I pointed out yesterday, the markets are ignoring all the geopolitical and economic dramas (Stagflation) and are focusing on the main driver, which can make or break bull markets, and that is Fed interest rate policy.
It’s now been widely accepted that the Fed has made a policy error and that, despite the Fed’s remaining 2 rate hikes, they will walk back their tough talk, as ZH explained:
The market is now pricing in rate-hikes to 2.00% in 2022… and then a full rate-cut in 2023…
That is full policy error pricing as the market is now convinced The Fed will hike into stagflation, guaranteeing a recession, sparking rate-cuts. All of which is perhaps another reason why gold is rebounding today…
Here are some snippets from Rabobank and BofA, who called it like this:
“By the September meeting the damage from the Ukraine crisis to the global economy may become a threat to the US economic expansion. The doves in the FOMC are likely to jump from the hiking bandwagon by then and demand a pause.”
Putting it all together, Marey’s Rabobank colleague Michael Every picks up where we left off with our FOMC post-mortem, and writes that “the market is going even further. With 30-year yields dropping and US 5-10s inverting, and only 20bp to go on 2s-10s, and with stocks, gold, and crypto all up, we are now pricing for a policy error and the inevitable rate cuts and new QE that will have to follow.” In other words, and as we have been hammering for months, “just as the Fed drives things off a cliff, Mr Market is already pricing in the trampoline at the bottom of it that will take us to even higher market-y highs.”
There you have it. The markets fully anticipate the above scenario and are already counting on future rate cuts and QE, even though none of that may happen till the end of this year.
As you can see in section 3 below, our Domestic TTI has moved back into bullish territory and, should that condition hold for a couple of days, we will look for new domestic exposure next week.
Looking at the big picture, ZH added:
Meanwhile, the Russia-Ukraine conflict continues, stagflation fears are soaring (today’s Philly Fed saw growth expectations plunge, prices paid soar), COVID cases are on the rise again, China growth concerns persist, and commodity prices are rebounding again.
Let’s see what the panic-BTFD algos say tomorrow after options expirations…
Continue reading…
2. ETFs in the Spotlight
In case you missed the announcement and description of this section, you can read it here again.
It features some of the 10 broadly diversified domestic and sector ETFs from my HighVolume list as posted every Saturday. Furthermore, they are screened for the lowest MaxDD% number meaning they have been showing better resistance to temporary sell offs than all others over the past year.
The below table simply demonstrates the magnitude with which these ETFs are fluctuating above or below their respective individual trend lines (%+/-M/A). A break below, represented by a negative number, shows weakness, while a break above, represented by a positive percentage, shows strength.
For hundreds of ETF choices, be sure to reference Thursday’s StatSheet.
For this just closed-out domestic “Buy” cycle, here’s how some of our candidates have fared:
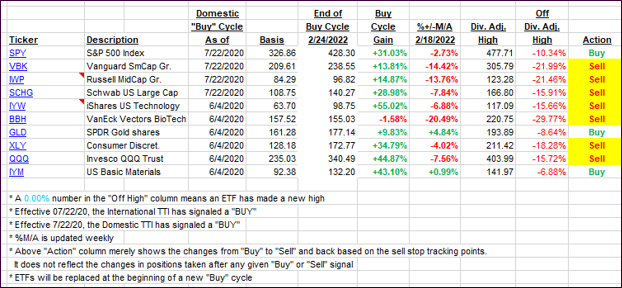
Click image to enlarge.
Again, the %+/-M/A column above shows the position of the various ETFs in relation to their respective long-term trend lines, while the trailing sell stops are being tracked in the “Off High” column. The “Action” column will signal a “Sell” once the -12% point has been taken out in the “Off High” column, which has replaced the prior -8% to -10% limits.
3. Trend Tracking Indexes (TTIs)
Our TTIs followed the broad market direction higher, with the Domestic one crossing above its trend line into bullish territory. I need to see more staying power before activating a new “Buy” signal.
This is how we closed 03/17/2022:
Domestic TTI: +0.92% above its M/A (prior close -0.34%)—Sell signal effective 02/24/2022.
International TTI: -0.94% below its M/A (prior close -2.18%)—Sell signal effective 03/08/2022.
Disclosure: I am obliged to inform you that I, as well as my advisory clients, own some of the ETFs listed in the above table. Furthermore, they do not represent a specific investment recommendation for you, they merely show which ETFs from the universe I track are falling within the specified guidelines.
All linked charts above are courtesy of Bloomberg via ZeroHedge.
Contact Ulli